Key point layout suggestionsThe current gold market is showing a weak rebound pattern. Although there was a small rebound on Wednesday, if it cannot stand above 3330, the overall trend will still be weak.
From the daily level, the support level is 3300 and the resistance level is 3335. The price is oscillating between the middle and lower tracks of the Bollinger Bands, and there is a possibility of upward or downward breakthrough.
Focus on the H4 cycle trend: if the rebound can stand above 3330, the price may further rise to 3335 US dollars;
Once it stands at 3335, it can be basically confirmed that the callback is over, and the subsequent challenge of 3345 resistance level may be repeated.
It is recommended to adopt a long-on-dip strategy near the support level, focusing on the support strength of the 3310-15 area below; the resistance level of 3335-3340 should be paid attention to above.
In terms of specific operations, if the price rebounds to the 3335-3340 range, short selling can be considered; if it pulls back to the 3310-3315 range, long selling can be considered.
Xauusdupdates

7/9: Focus on Selling Gold on ReboundsGood evening, everyone!
Apologies for the late update today—I had some matters to attend to. I hope your trades are going smoothly.
Yesterday, gold found support around 3284 and continued to rebound during today’s session, reaching as high as 3330. The key resistance at 3321 has now been broken and is currently acting as a short-term support level. However, based on the current price structure, this level is likely to be retested multiple times, and some consolidation may follow.
The next major resistance lies between 3337 and 3343. In the absence of strong bullish momentum, the preferred short-term strategy remains selling on rebounds, especially near resistance zones.
⚠️ Additionally, the U.S. Initial Jobless Claims data will be released during the New York session tonight, which may cause increased volatility and potentially whipsaw price action. Be cautious with position sizing, and avoid emotional trades or chasing price action during news releases. Patience and discipline will be key.

XAUUSD Analysis todayHello traders, this is a complete multiple timeframe analysis of this pair. We see could find significant trading opportunities as per analysis upon price action confirmation we may take this trade. Smash the like button if you find value in this analysis and drop a comment if you have any questions or let me know which pair to cover in my next analysis.

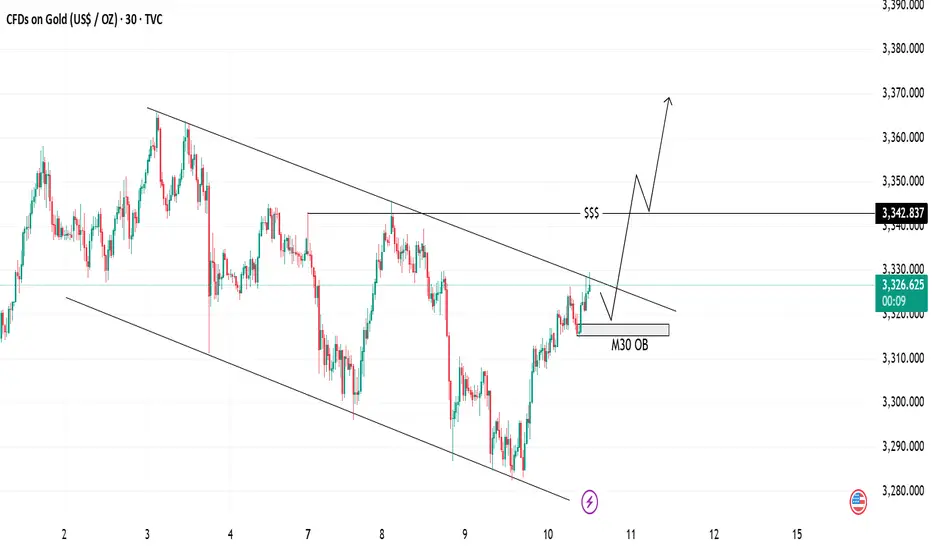
Gold Analysis Bullish Breakout | Trendline & OB Setup📈 Gold Analysis
We are currently seeing price action within a descending channel, testing key support at the M30 OB (Order Block). The price is pushing higher after bouncing off the support level, and the trendlines suggest a potential breakout to the upside.
💡 Key Levels:
Support Zone: 3326
Resistance Zone: 3342
The market is primed for a possible rally, indicated by the upward momentum and price breaking out above the trendline. Watch for confirmation as we approach the liquidity level for further bullish movement.
⚡ Trade Idea: Look for a long entry if price closes above the trendline for a continuation towards the next resistance.
GOLD Intraday Chart Update For 10 July 25Hello Traders,
as you can see that GOLD is stuck in tight range between 3300-3330 all eyes on clear breakout for now
further only market will break clearly 3345 level then we will consider market will move further advance below 3300 GOLD will move towards 3250
Scalping Range 3300 - 3330 for the short time period
Disclaimer: Forex is Risky

XAUUSD:Stay long
Today's Shock Trading strategy:
Day traders can buy long positions at 3318-23 with a target range of 3340-45
Median traders please refer to the previous thinking unchanged.
More detailed strategies and trading will be notified here ↗↗↗
Keep updated, come to "get" ↗↗↗

XAUUSD Idea: 4H Trendline First Breakout - Liquidity PlayFOREXCOM:XAUUSD
🔍 Analysis Overview:
Price has just broken above a 4H descending trendline for the first time. However, I remain cautious due to the following key observations:
📌 NOTES:
The broader market sentiment is still bearish due to recent tariff-related news, which often fuels risk-off behavior.
Historically, the first breakout of a strong trendline often fails, trapping early buyers.
This breakout is likely attracting buy-side liquidity, giving institutions an opportunity to hunt stops.
My observation shows buying interest started around the 3308–3313 range, suggesting smart money accumulation and a possible trap.
📉 I'm watching for a fake breakout and potential reversal targeting the liquidity zones marked below around 3307 and possibly lower.
The liquidity sweep below equal lows could offer a better risk-reward setup.
💡 Conclusion:
If price fails to hold above this breakout and shows signs of rejection, I will be anticipating a return towards the previous demand zone for a liquidity grab.
#XAUUSD #GoldAnalysis #SmartMoneyConcepts #LiquidityGrab #ForexTrading #TrendlineBreak #MarketPsychology #TradingSetup #SMC #PriceAction

XAUUSD Sell Nowthis is gold pairs and my analysis say gold down soon possible, like my analysis and share.

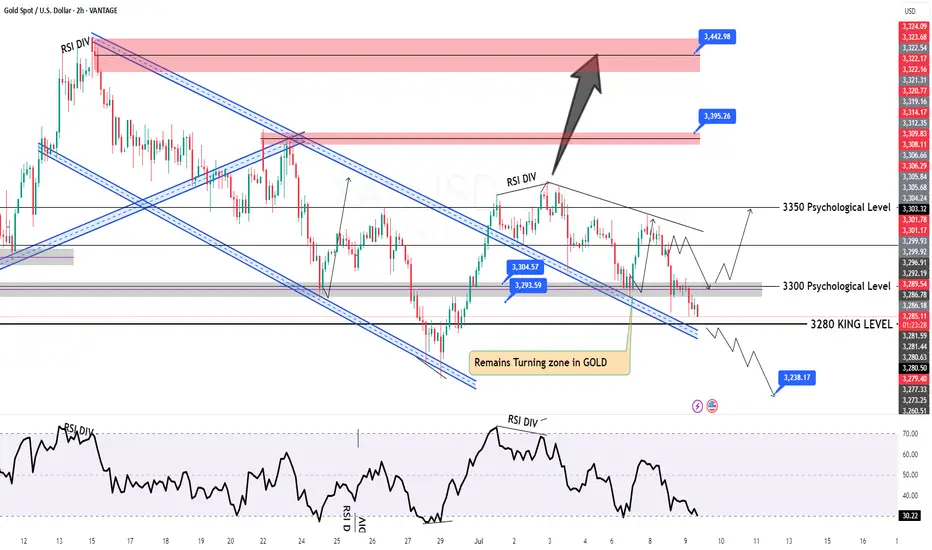
Elliott Wave Analysis – XAUUSD July 10, 2025
🌀 Elliott Wave Structure
On the H4 timeframe, price has returned to test the upper boundary of the converging triangle – currently acting as dynamic resistance. Based on the current wave count, wave e (purple) may have completed at the 3279 low, and price is potentially starting a breakout move.
👉 A confirmed breakout above the triangle would validate the end of the abcde correction and mark the beginning of a new upward trend.
🔋 Momentum Analysis
D1 timeframe: As forecasted yesterday, momentum is entering oversold territory and showing early signs of a reversal. This suggests that an upward trend could dominate over the next 5 days.
H4 timeframe: The two momentum lines are sticking together, indicating a weakening upward drive. A minor pullback may be needed before the next leg up. Key nearby resistance levels to watch are 3330 and 3342.
🎯 Key Price Levels & Validation Zones
The following support zones are crucial for identifying potential entries:
Support Zone 1: 3306 – 3308
Support Zone 2: 3294 – 3297
‼️ Important: A break below 3294 would invalidate the current wave structure, and a new count would be required.
📌 Trade Plan
Scenario 1 – Buy at higher support:
Buy Zone: 3308 – 3306
SL: 3303
TP1: 3342
TP2: 3366
TP3: 3390
Scenario 2 – Buy at deeper support (if stronger correction occurs):
Buy Zone: 3297 – 3294
SL: 3287
TP1: 3342
TP2: 3366
TP3: 3390
Scenario 3 – Safer option (breakout confirmation):
Wait for a breakout above the triangle, then enter on the retest (around 3325–3330)
SL: Based on structure formed during the retest
TP range: 3366 – 3390
📌 Preferred strategy: Wait for H4 to reach oversold or wait for a confirmed breakout and retest to enter safely in alignment with the new uptrend.

XAUUSD Idea: 4H Trendline First Breakout - Liquidity PlayFOREXCOM:XAUUSD
🔍 Analysis Overview:
Price has just broken above a 4H descending trendline for the first time. However, I remain cautious due to the following key observations:
📌 NOTES:
The broader market sentiment is still bearish due to recent tariff-related news, which often fuels risk-off behavior.
Historically, the first breakout of a strong trendline often fails, trapping early buyers.
This breakout is likely attracting buy-side liquidity, giving institutions an opportunity to hunt stops.
My observation shows buying interest started around the 3308–3313 range, suggesting smart money accumulation and a possible trap.
📉 I'm watching for a fake breakout and potential reversal targeting the liquidity zones marked below around 3307 and possibly lower.
The liquidity sweep below equal lows could offer a better risk-reward setup.
💡 Conclusion:
If price fails to hold above this breakout and shows signs of rejection, I will be anticipating a return towards the previous demand zone for a liquidity grab.
#XAUUSD #GoldAnalysis #SmartMoneyConcepts #LiquidityGrab #ForexTrading #TrendlineBreak #MarketPsychology #TradingSetup #SMC #PriceAction

Waiting for the Perfect Entry: XAUUSD Market Structure Breakdown🔍 Taking a look at XAUUSD today: it’s clearly in a downtrend 📉 on the 4H chart, with consecutive lower highs and lower lows 🔽.
📌 My bias is bearish, and I’m patiently waiting for price action to set up for an entry 🎯.
If we get a break of market structure 🧱, followed by a retest and failure of the current range high 🚫, that could present an opportunity 👀 — not financial advice ⚠️.

Market Structure Break & Bearish Reaction from Supply Zone.🔍 GOLD – Market Structure Break & Bearish Reaction from Supply Zone
Gold has recently broken its market structure (MSS), which is a significant shift in momentum and a potential indication of a change in the prevailing trend. Following this break, price retraced into a key supply zone, where it was rejected sharply—this rejection came in the form of a strong bearish engulfing candle, highlighting aggressive selling interest.
Interestingly, the market has now printed a second consecutive bearish engulfing from the same zone. This is a powerful signal that sellers are active and defending this level, making it a valid and confirmed short-term resistance zone. The repeated rejection suggests that smart money or institutional sellers may be positioned here.
Given this price action, we can anticipate a potential retracement from the current levels. The most probable downside target for this retracement would be the Fair Value Gap (FVG) that has been marked on the chart. If price respects the FVG and reacts bullishly from there, we may then see a resumption of the uptrend, possibly taking price higher again.
This setup presents a good opportunity for both short-term intraday traders and swing traders to watch for confirmation signals before entering the trade.
📌 Key Takeaways:
MSS indicates shift in trend
Consecutive bearish engulfing candles from supply zone
Sellers likely active in this area
Potential retracement toward marked FVG
Possible bullish continuation from FVG zone
🚨 As always, Do Your Own Research (DYOR) and manage your risk accordingly before making any trading decisions.

XAUUSD Reaching Supply ZoneXAUUSD is reaching a supply zone. There resides a good S&R level. We can expect gold to hit supply zone and follow the sell trend again. The strength of the gold is saying the same. The other possibility might be gold may break S&R level and go higher. Sellers are in stronger position and we may see higher probability percentage for sell.

Gold Price Analysis - 4-Hour Chart4-hour candlestick chart for the Gold Spot price in U.S. Dollars (XAUUSD), sourced from OANDA. The chart displays the price movement over time, with green candles indicating an increase in price and red candles indicating a decrease. The chart also features various technical indicators and annotations, including a trend line and a support level.

Start buying gold, a rebound may come at any time!Gold is undoubtedly weak at present, and bears have the upper hand. However, since gold touched the 3290-3280 area, gold bears have made more tentative moves, but have never really fallen below the 3290-3280 area, proving that as gold continues to fall, bears have become more cautious.
From the perspective of gold structure, multiple technical structural supports are concentrated in the 3285-3275 area, which makes it difficult for gold to fall below this area easily. After gold has failed to fall below this area, gold is expected to build a short-term bottom structure with the help of multiple supports in this area, thereby stimulating bulls to exert their strength and a rebound may come at any time.
Therefore, in the short term, I do not advocate chasing short gold; instead, I prefer to try to find the bottom and go long gold in the 3290-3280 area; but we should note that because gold is currently in an obvious short trend, we should appropriately reduce the expectation of gold rebound, so we can appropriately look at the rebound target: 3305-3315 area.

Gold is in the Bearish direction from a Support levelHello Traders
In This Chart GOLD HOURLY Forex Forecast By FOREX PLANET
today Gold analysis 👆
🟢This Chart includes_ (GOLD market update)
🟢What is The Next Opportunity on GOLD Market
🟢how to Enter to the Valid Entry With Assurance Profit
This CHART is For Trader's that Want to Improve Their Technical Analysis Skills and Their Trading By Understanding How To Analyze The Market Using Multiple Timeframes and Understanding The Bigger Picture on the Charts

4-Hour Chart Strategy: Sell High, Buy Low Within 3280-3325 RangeBased on the 4-hour analysis 😎, today's short-term resistance above focuses on the hourly top-bottom conversion level around 3318-3324 🚫. If there's an intraday rebound leaning on this zone, first go short to target a pullback ⬇️. The short-term support below is around 3280 🔍. Overall, rely on the 3280-3325 range to maintain the main strategy of "shorting at highs and buying at lows" in cycles ✅. For prices in the middle of the range, always watch more and act less 👀, be cautious of chasing orders 🚫, and wait patiently for key levels to enter positions 🕙
Strategy:
🚀 Buy @3280 - 3285
🚀 TP 3290 - 3295 - 3305
🚀 Sell @3320 - 3315
🚀 TP 3310 - 3305 - 3295
Accurate signals are updated every day 📈 If you encounter any problems during trading, these signals can serve as your reliable guide 🧭 Feel free to refer to them! I sincerely hope they'll be of great help to you 🌟 👇

XAUUSD (GOLD) – 1H Analysis – Smart Money ConceptPrice is currently reacting around the 1H bearish order block (OB) within the supply zone near $3,300 – $3,320. We expect a short-term bullish retracement into this premium zone before a potential bearish continuation toward our Point of Interest (POI) at the green demand zone ($3,245 – $3,260).
📌 Two scenarios in play:
Sell from current supply zone ($3,300–$3,320) → First TP near $3,265 → Final TP at $3,250.
If price breaks above, next entry is at higher supply zone ($3,340–$3,360) for a deeper sell.
⚠️ Watch for price reaction around the POI (Demand Zone) for potential bullish setup later in the week.
🧠 Smart Money Concept (SMC) in play:
Supply zone respect
BOS/CHOCH confirmed
POI (Demand) targeted
FVG/Imbalance below being filled
📅 NFP & CPI events this week – expect increased volatility.

7.9 Latest gold trend analysis and operation layout📰 News information:
1. Federal Reserve meeting minutes
📈 Technical Analysis:
Our decision to close our positions at 3305 yesterday was undoubtedly a very strategic one. After reaching a high of around 3310 last night, it began to fall. At the same time, I also gave VIP members the news that it might fall back to around 3300. Since the opening, the lowest point has reached around 3285. The overall trend is still under our control.
At present, gold will still usher in technical corrections in the short term. The current price of 3293-3290 support can be considered for long positions. If the European session continues to fall below the low, you can try to go short during the NY session. If the European session continues to maintain sideways consolidation, you can consider retreating and going long during the NY session. As long as the key support of 3250 below is held, gold will maintain its consolidation trend in short-term trading. On the contrary, once it falls below 3250, gold may directly touch the 3200 mark. Focus on the minutes of the Federal Reserve meeting, which may further influence the trend of gold.
🎯 Trading Points:
BUY 3293-3290-3285
TP 3305-3310-3320
In addition to investment, life also includes poetry, distant places, and Allen. Facing the market is actually facing yourself, correcting your shortcomings, facing your mistakes, and exercising strict self-discipline. I share free trading strategies and analysis ideas every day for reference by brothers. I hope my analysis can help you.

gold on buy retrace#XAUUSD buy on 2 times breakout above 3300. The bullish needs formation there to start buying.
Buy limit 3300 on 2 times breakout, target 3316-3328, stop loss 3290.
Below 3287 holds bearish continuation if the m30-H1 closes below there target 3267.

(XAU/USD – Gold vs US Dollar on 4H timeframe)(XAU/USD – Gold vs US Dollar on 4H timeframe), the analysis shows a bearish setup with a breakdown from the ascending trendline and confirmation below the Ichimoku cloud.
1. First Target: 3,220
2. Second Target: 3,180
3. Final Target Zone: 3,130 – 3,100
Note.
Price has rejected from the resistance zone (highlighted in yellow).
Break below support and cloud suggests bearish momentum.
The blue box (around 3,240–3,250) seems to be a possible retest zone before continuation downward.
📉 Bias: Bearish
If price stays below 3,250, these targets remain valid. Watch for retest failures or strong rejection candles to confirm entries.
Let me know if you want SL (stop-loss) or entry suggestion too.

GOLD Intraday H2 Chart update for 9 July 2025Hello Traders
as you can see that we have strong resistance on 3310 level only break above that level will consider bullish move
Below 3300 Psychological level market remains Bearish and move towards 3245 level
FOMC Meeting minutes dues today
Disclaimer: Forex is Risky
XAU/USD 09 July 2025 Intraday AnalysisH4 Analysis:
-> Swing: Bullish.
-> Internal: Bullish.
You will note that price has targeted weak internal high on two separate occasions forming a double top which is a bearish reversal pattern. This is in-line with HTF bearish pullback phase.
Remainder of analysis and bias remains the same as analysis dated 23 April 2025.
Price has now printed a bearish CHoCH according to my analysis yesterday.
Price is now trading within an established internal range.
Intraday Expectation:
Price to trade down to either discount of internal 50% EQ, or H4 demand zone before targeting weak internal high priced at 3,500.200.
Note:
The Federal Reserve’s sustained dovish stance, coupled with ongoing geopolitical uncertainties, is likely to prolong heightened volatility in the gold market. Given this elevated risk environment, traders should exercise caution and recalibrate risk management strategies to navigate potential price fluctuations effectively.
Additionally, gold pricing remains sensitive to broader macroeconomic developments, including policy decisions under President Trump. Shifts in geopolitical strategy and economic directives could further amplify uncertainty, contributing to market repricing dynamics.
H4 Chart:
M15 Analysis:
-> Swing: Bullish.
-> Internal: Bullish.
H4 Timeframe - Price has failed to target weak internal high, therefore, it would not be unrealistic if price printed a bearish iBOS.
The remainder of my analysis shall remain the same as analysis dated 13 June 2025, apart from target price.
As per my analysis dated 22 May 2025 whereby I mentioned price can be seen to be reacting at discount of 50% EQ on H4 timeframe, therefore, it is a viable alternative that price could potentially print a bullish iBOS on M15 timeframe despite internal structure being bearish.
Price has printed a bullish iBOS followed by a bearish CHoCH, which indicates, but does not confirm, bearish pullback phase initiation. I will however continue to monitor, with respect to depth of pullback.
Intraday Expectation:
Price to continue bearish, react at either M15 supply zone, or discount of 50% internal EQ before targeting weak internal high priced at 3,451.375.
Note:
Gold remains highly volatile amid the Federal Reserve's continued dovish stance, persistent and escalating geopolitical uncertainties. Traders should implement robust risk management strategies and remain vigilant, as price swings may become more pronounced in this elevated volatility environment.
Additionally, President Trump’s recent tariff announcements are expected to further amplify market turbulence, potentially triggering sharp price fluctuations and whipsaws.
M15 Chart:
