Gold falls back to 18-24 and goes longFrom the 4-hour analysis, pay attention to the short-term support of 3318-3324 below, pay attention to the short-term resistance of 3345-50 above, and focus on the suppression of 3365-70. The overall high-altitude low-multiple cycle participation theme remains unchanged. In the middle position, watch more and do less, and follow orders cautiously, and keep the main theme of participation in the trend. Be patient and wait for key points to participate. I will prompt the specific operation strategy in the link, please pay attention in time.
Gold operation strategy:
1. Go long at 3318-3324, stop loss at 3312, target at 3345-50, and continue to hold if it breaks;
2. Go short at 3345-50 when gold rebounds, stop loss at 3357, target at 3318-24, and continue to hold if it breaks;
Xauusdupdates

Can the gold bulls reverse?From the technical perspective of gold, the lowest price fell to 3295 on Monday and stopped falling. There is a lot of room for the rise, and the highest rose to around 3345. The overall trend was a "V" reversal of falling first and then rising. Therefore, it can be determined that the adjustment of gold has been completed, and the bullish force has emerged. The market outlook will continue to see room for growth. The upper side will maintain around 3365 to 3400, and the effective target of the rise this week is 3400. In the 4-hour chart, the technical pattern is also three consecutive positive days at a low level, and the Bollinger band is closing. Standing firmly above the middle track of the Bollinger band is absolutely strong. If it continues to rise, it will be around 3365. 3365 is the high point last week. If this point breaks and the Bollinger band opens, there is a possibility of a big rise to 3400 this week. Today's key point is the 3345 line above. Before the intraday breakout and stabilization at 3345, the rebound is an opportunity to go short. If it stabilizes above 3345, it means the formation of the bottom pattern, and the bulls will start to pull up. At that time, the bears can no longer hold on. The small cycle support is around 3320. Don't chase the long position in the Asia-Europe session, wait for it to fall back to the key support point and then go long.
Gold operation strategy: It is recommended to go long at 3320-3322, stop loss at 3314, and target 3330-3340; it is recommended to go short at 3342-3340 on the rebound, stop loss at 3350, and target 3330-3320;

4‑Hour Technical Framework- 8th July 2025Current Price: ~$3,330
Timeframe Focus: 4‑Hour and 1‑Hour
Directional Bias: Neutral-to-Bearish
Methodologies Used:
✅ Price Action, Fibonacci Levels, Support & Resistance
✅ Supply & Demand Zones
✅ ICT / Smart Money Concepts (BOS, CHoCH, Liquidity, OB, FVG)
4‑Hour Market Structure Analysis
Gold has shifted into a neutral-to-bearish regime on the 4‑hour timeframe, after a decisive Break of Structure (BOS) below prior swing lows at ~$3,345 and a clear Change of Character (CHoCH) as bulls failed to sustain above the ~$3,350 level. Price currently hovers around ~$3,330, consolidating within a bearish Fair Value Gap (FVG) left by the recent impulsive drop.
Key Observations:
A liquidity grab above $3,349 (stop sweep) preceded a sharp reversal, validating this as a sell-side liquidity zone.
The 4H supply zone / bearish Order Block (OB) at $3,345–$3,350 remains unmitigated and likely to attract sellers.
Immediate downside is cushioned by a 4H demand zone & FVG at $3,300–$3,305, which has acted as support during the prior dip.
A deeper daily demand zone rests around $3,280–$3,290, which aligns with historical support and unmitigated buy‑side liquidity.
Key 4‑Hour Levels to Watch
Price Level Type Notes
$3,360–$3,365 Supply / Fib 61.8% Strong resistance
$3,345–$3,350 Supply / OB + 50% Fib Primary sell zone
$3,330–$3,334 Bearish FVG Active imbalance
$3,300–$3,305 Demand / FVG Primary buy zone
$3,280–$3,290 Demand (daily OB) Secondary buy zone
The neutral-to-bearish bias is reinforced by the fact that price has failed to reclaim prior support and continues to respect supply zones.
1‑Hour Intraday Trade Ideas
Zooming into the 1‑hour chart, we align intraday setups with the broader 4H directional bias: selling into supply and covering into demand.
Setup 1: Short at 4H Imbalance
Entry: ~$3,332–$3,334 (inside active FVG)
Stop-Loss: Above $3,335
Targets:
TP1: $3,305
TP2: $3,280
Confluences: BOS + CHoCH, 4H FVG, sell‑side liquidity above.
Setup 2: Short on Retracement
Entry: ~$3,345–$3,350 (50% Fib + OB)
Stop-Loss: Above $3,352
Targets: Same as Setup 1.
Setup 3: Aggressive Long (Countertrend)
Entry: ~$3,300–$3,305 (demand + FVG)
Stop-Loss: Below $3,295
Target: $3,327
Note: Only valid if strong bullish reaction occurs in demand.
The Golden Setup
Sell at ~$3,332–$3,334 (active 4H imbalance) with a target of $3,300.
This setup offers maximum confluence — bearish FVG, BOS, and supply rejection — with tight risk parameters and favorable reward/risk ratio.
Summary Table
Bias Levels of Interest
Directional Bias Neutral-to-Bearish
Strong Sell Zones $3,330–$3,334 and $3,345–$3,350
Strong Buy Zones $3,300–$3,305 and $3,280–$3,290
Closing Notes
Gold continues to respect Smart Money footprints on the 4‑hour chart, suggesting more downside unless bulls reclaim $3,350 decisively. Today’s focus remains on short opportunities at premium levels into supply and imbalances, targeting well‑defined demand areas below.
Watch price action closely in the $3,332–$3,334 zone for the highest‑probability short entry of the session — The Golden Setup.
XAUUSD Outlook: How Risk Sentiment Could Shape the Next MoveI’m currently analysing XAUUSD (Gold) 🟡, which has come under bearish pressure 📉, showing signs of downside momentum. In the video 🎥, we also explore the inverse correlation between Gold and risk assets like the NASDAQ 📊.
Keep a close eye on NASDAQ movements—if risk assets break bullish 🚀, we may see further weakness in Gold. On the other hand, if risk sentiment shifts and risk assets break bearish 🛑, Gold could attract safe-haven demand and gain strength 💪.
We also dive into the price action, market structure, and pull up the volume profile 🧩. Gold is currently trading around the Point of Control (POC) ⚖️—a key level where significant volume has accumulated. A clean break above or below this area could act as a technical trigger for the next move 📈📉.
As always, this is not financial advice ⚠️—just my market view.

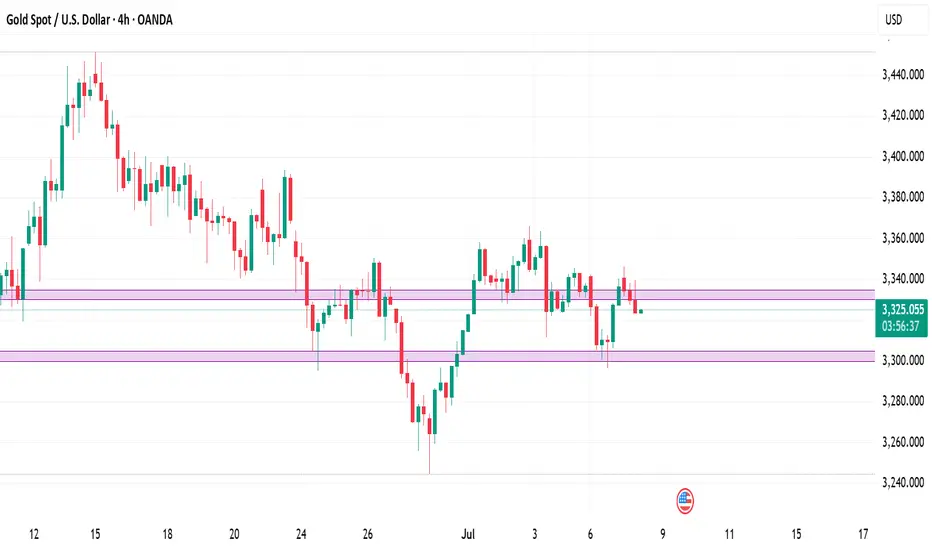
GOLD H2 Intraday Chart Update for 8 July 2025Hello Traders
Gold is still in a range between 3300 - 3350 Psychological level, all eyes on breakout of both mentioned psychological levels for now
Intraday Strong support zone is located 3290-3300
Intraday Strong Resistance zone is located 3350-3360
US TARIFF WAR remains agenda for now
Disclaimer: Forex is Risky

XAU/USD 08 June 2025 Intraday AnalysisH4 Analysis:
-> Swing: Bullish.
-> Internal: Bullish.
You will note that price has targeted weak internal high on two separate occasions forming a double top which is a bearish reversal pattern. This is in-line with HTF bearish pullback phase.
Remainder of analysis and bias remains the same as analysis dated 23 April 2025.
Price has now printed a bearish CHoCH according to my analysis yesterday.
Price is now trading within an established internal range.
Intraday Expectation:
Price to trade down to either discount of internal 50% EQ, or H4 demand zone before targeting weak internal high priced at 3,500.200.
Note:
The Federal Reserve’s sustained dovish stance, coupled with ongoing geopolitical uncertainties, is likely to prolong heightened volatility in the gold market. Given this elevated risk environment, traders should exercise caution and recalibrate risk management strategies to navigate potential price fluctuations effectively.
Additionally, gold pricing remains sensitive to broader macroeconomic developments, including policy decisions under President Trump. Shifts in geopolitical strategy and economic directives could further amplify uncertainty, contributing to market repricing dynamics.
H4 Chart:
M15 Analysis:
-> Swing: Bullish.
-> Internal: Bullish.
H4 Timeframe - Price has failed to target weak internal high, therefore, it would not be unrealistic if price printed a bearish iBOS.
The remainder of my analysis shall remain the same as analysis dated 13 June 2025, apart from target price.
As per my analysis dated 22 May 2025 whereby I mentioned price can be seen to be reacting at discount of 50% EQ on H4 timeframe, therefore, it is a viable alternative that price could potentially print a bullish iBOS on M15 timeframe despite internal structure being bearish.
Price has printed a bullish iBOS followed by a bearish CHoCH, which indicates, but does not confirm, bearish pullback phase initiation. I will however continue to monitor, with respect to depth of pullback.
Intraday Expectation:
Price to continue bearish, react at either M15 supply zone, or discount of 50% internal EQ before targeting weak internal high priced at 3,451.375.
Note:
Gold remains highly volatile amid the Federal Reserve's continued dovish stance, persistent and escalating geopolitical uncertainties. Traders should implement robust risk management strategies and remain vigilant, as price swings may become more pronounced in this elevated volatility environment.
Additionally, President Trump’s recent tariff announcements are expected to further amplify market turbulence, potentially triggering sharp price fluctuations and whipsaws.
M15 Chart:

Below 3360, short sellers still have profit potential!Although gold has steadily rebounded to around 3345, compared with yesterday's gold falling below 3330 again, the rebound in the short term is not strong; overall, gold is still in a weak and volatile pattern, with pressure from the upper side at 3350-3360; and there is technical buying support in the lower 3300-3290 area. It is under the influence of the resistance area and the support area that gold lacks continuity.
So before gold breaks through effectively, I think both the long and short sides of gold have profit potential, so for the current short-term trading, we can temporarily maintain the high-sell-low-dregs trading within the range.
1. Consider shorting gold in batches with 3345-3365 as resistance, TP: 3330-3320-3310;
2. Consider going long gold in batches with 3325-3305 as support, TP: 3345-3355-3365

Gold Reverses with a Pin Bar – Is the Drop Over?📈 What happened yesterday on Gold (XAU/USD)?
Gold had a tricky session – during the early hours it dipped just below 3300, testing support. But by the New York session, bulls stepped in strongly, pushing price back up and closing near the daily highs. The result? A strong daily Pin Bar with a long tail, signaling possible bullish reversal.
________________________________________
❓ Is the drop over, or will the market fake out again?
That's the big question now. Yesterday’s close definitely leans bullish, but we need to see confirmation.
________________________________________
📌 Why a continuation to the upside is possible:
• Price rejected sub-3300 levels pretty strongly.
• A daily Pin Bar formed, signaling buyer strength.
• A break above yesterday’s high would confirm bullish intent.
• 3390–3400 is the next key resistance zone on the radar.
________________________________________
🧠 My trading plan:
I closed my short near break-even – no need to fight the price action. Now I'm patiently waiting for a clean break above yesterday’s high to enter long trades, aiming for the 3390–3400 resistance area.
Disclosure: I am part of TradeNation's Influencer program and receive a monthly fee for using their TradingView charts in my analyses and educational articles.

Elliott Wave Analysis – XAUUSD – July 8, 2025🔎 Momentum Analysis
On the daily (D1) timeframe, momentum is currently declining. At the same time, the 4H momentum is showing signs of reversing downward. This suggests a likely short-term corrective decline, which provides a basis for projecting potential Elliott Wave patterns.
🌀 Elliott Wave Structure
On the 4H chart, I currently see two main possible scenarios:
Scenario 1: Contracting Triangle Correction (abcde – purple)
This scenario assumes a contracting triangle correction labeled abcde in purple.
The market appears to be in wave d (purple), which is unfolding as a wxy corrective structure. Currently, it is likely in wave y.
The projected target for the end of wave y is between 3393 – 3402.
However, due to the declining momentum, I expect a short-term pullback to the 3318 – 3321 region before price resumes upward to complete wave d.
Scenario 2: Larger WXY Correction
In this case:
Wave W has completed as a standard 3-wave abc.
Wave X has also completed as a double zigzag.
Wave Y appears to be forming a small contracting triangle abcde in red.
Currently, the price is being compressed between the upper and lower boundaries of the red triangle, suggesting that it is in the final wave e.
In this scenario, the projected retracement also aligns with the 3318 – 3321 zone. After completing wave e, price is expected to break out strongly above the upper boundary of the red triangle.
✅ Strategic Conclusion
Both scenarios point to a confluence zone at 3318 – 3321, making this a key potential buying area. Two trading approaches can be considered:
Aggressive Entry: Buy within the 3318 – 3321 range.
Conservative Entry: Wait for a confirmed breakout above the red triangle before entering a long position.
📈 Suggested Trade Plan
Buy Zone: 3318 – 3321
Stop Loss: 3308
Take Profit 1: 3342
Take Profit 2: 3362
Take Profit 3: 3393

XAUUSD Short Term Possibility AnalysisGold has an are between 3324 to 3328. It hold for a while there and target back to one hour OB which is residing on 3355 to 3365. Previous day gold move shows intense buying which is sign of potential buying in gold. As weekly candles show strong uptrend the possible move for gold will be in uptrend therefore two scenarios are shared here. If gold breaks 3324 to 3328 support it will possibly target the daily low which is residing on 3295.

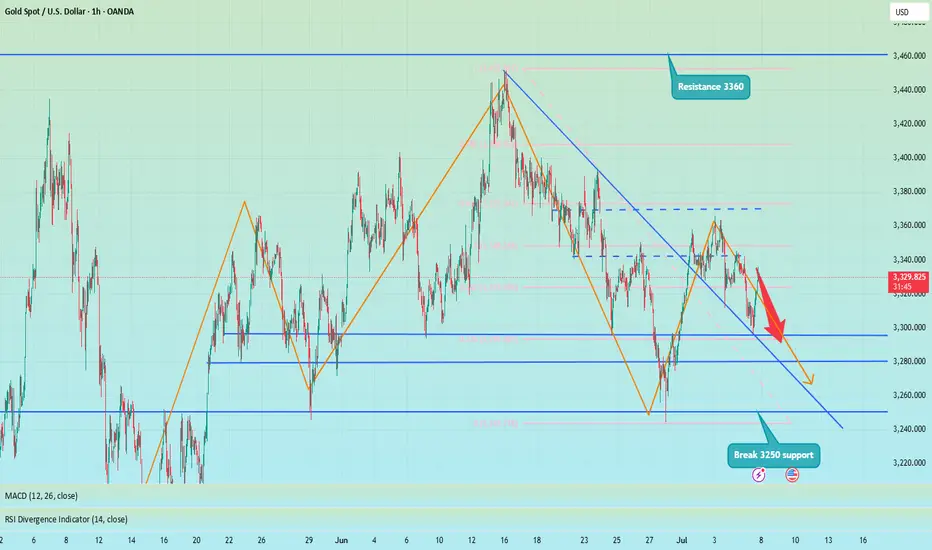
XAU/USD Eyes Key Resistance Amid Fresh Tariff Fears🟡 TVC:GOLD Gold Price Forecast: XAU/USD Eyes Key Resistance Amid Fresh Tariff Fears
OANDA:XAUUSD Spot gold (XAU/USD) is recovering from intraday lows near $3,296, now trading around $3,330 as fears over renewed U.S. tariffs fuel safe-haven demand. President Trump has begun issuing formal letters announcing fresh import tariffs—25% on South Korea, additional measures on Japan, and a 10% universal tariff on countries aligning with BRICS. With the 90-day tariff pause expiring August 1 and no trade progress in sight, geopolitical and economic uncertainty continue to support gold’s floor.
📉 Technical Structure
XAU/USD remains within a descending channel on the 1H chart, with price currently approaching the $3,338–$3,340 Resistance Zone 1. A clean breakout above the upper channel boundary could trigger a move toward the broader $3,364 Resistance Zone 2. Conversely, failure to break above Resistance Zone 1 would keep the bearish channel intact, with downside targets toward the $3,302–$3,305 support zone.
📌 Key Technical Zones
Resistance Zone 1: $3,338–$3,340
Resistance Zone 2: $3,364
Support Zone: $3,302–$3,305
Channel Structure: Bearish unless broken to the upside
📘 Strategy Summary
XAU/USD is showing signs of short-term recovery, but remains technically capped unless it breaks through $3,340 resistance. As long as the descending channel holds, rallies may be sold into. A confirmed break above $3,340 could shift bias toward $3,364, while rejection may reopen the path to $3,305 and potentially lower.
⚠️ Disclaimer
This analysis is for informational purposes only and does not constitute investment advice. Please consult a licensed financial advisor before making trading decisions.

XAUUSD - Liquidity Sweep & Smart Money Play | Dual Setup BreakdoFOREXCOM:XAUUSD
Liquidity Sweeps
Smart Money Concepts (SMC)
Trendline Liquidity
Demand/Order Blocks
Risk-Reward Structure
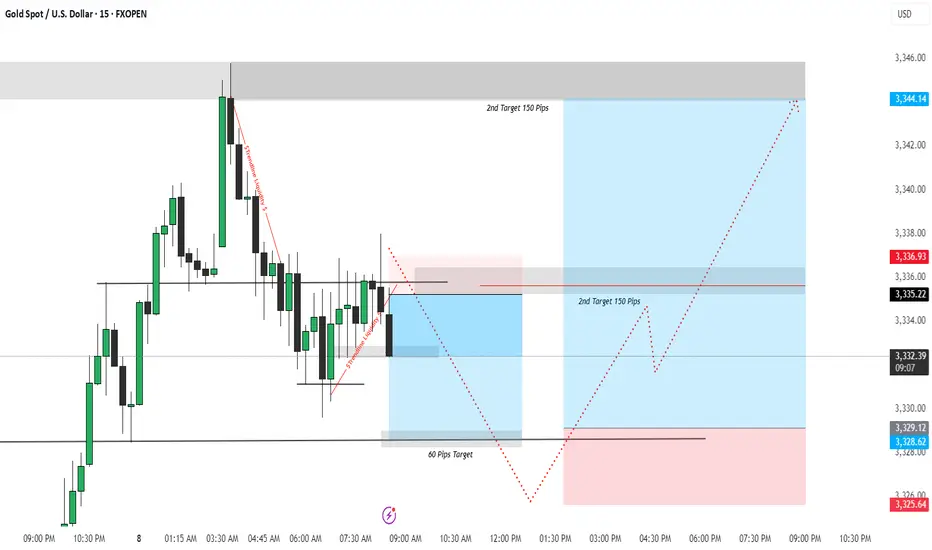
🔻 First Trade Idea – Short Position (Sell Setup)
🧠 Psychology & Liquidity Insight:
The market formed equal lows before a sudden rally which attracted retail traders.
Price created a bearish structure with lower highs, signaling weakness.
A strong liquidity sweep occurred by breaking trendline liquidity twice (as shown by red lines), targeting early buyers' stop losses.
A supply zone (red box) was respected near 3337, providing an ideal entry point for shorting.
📉 Trade Logic:
Entry: Near 3336.93 (Supply Zone)
SL: Above 3344.14 (Liquidity Sweep zone)
TP: 3328.62 / 3325.64 (Targeting demand imbalance & internal liquidity)
R:R: Approx. 1:2+
🔺 Second Trade Idea – Long Position (Buy Setup)
🧠 Psychology & Liquidity Insight:
After the initial selloff, price taps into the demand zone (blue box) created by the last impulsive move.
Internal liquidity is built again near 3328–3330, where retail traders expect a continued fall — ideal for smart money to reverse.
Price is expected to accumulate and reverse with a strong rally toward the upper liquidity resting above 3344.
📈 Trade Logic:
Entry: Near 3328.62 (Demand Zone Tap)
SL: Below 3325.64
TP: 3344.14 (Major Liquidity Target)
R:R: Over 1:3 – a high-quality reversal play.
🎯 Why This Trade Setup is Powerful:
✅ Both trades are liquidity-driven, not just indicator-based.
✅ Incorporates smart money logic and price structure.
✅ Clear risk-to-reward, validated by price behavior and institutional order flow.
Shorts trapped? No, the head and shoulders top is still downOver the weekend, I gave a trading strategy for going long at 3315-3305. Today, I updated and optimized the long order trading, maintained the high-short-low-long trading strategy, and began to rebound near the 3300 line, and successfully touched the long TP 3333. At present, I am executing short trades again according to the trading strategy and holding short orders.
Although gold has only retreated to around 3330, I am not worried about losses and failures in short trades. As I wrote in today's post, the daily K-line chart has a head and shoulders top pattern. As long as the bulls fail to recover 3360, it is still a short trend. Therefore, in the short term, I still think that the rebound is a good opportunity for us to go short.
At present, the short-term bullish momentum of gold has been consumed and the downward trend continues. Therefore, I still insist on holding short orders in the short term.
In addition to investment, life also includes poetry, distant places, and Allen. Facing the market is actually facing yourself, correcting your shortcomings, facing your mistakes, and being strict with yourself. I share free trading strategies and analysis ideas every day for reference by brothers. I hope my analysis can help you.
FXOPEN:XAUUSD PEPPERSTONE:XAUUSD FOREXCOM:XAUUSD FX:XAUUSD FXOPEN:XAUUSD OANDA:XAUUSD TVC:GOLD
Gold is still in rangeGold, the general trend is as described in the continuous analysis. The price has fallen from the historical high of 3500 to 3120 in the first round this year. After rising to 3452, it is currently in the second round of downward cycle. The mid-term top idea is maintained, and the operating target is 3120;
The non-agricultural data at the end of last week was under pressure at 3365, and it dropped to 3296 on Monday and rebounded. It broke the high overnight, and the daily chart closed positive. The K-line combination is in a volatile arrangement. In the short term, it will maintain consolidation below 3365; short-term support is 3330-3326, and strong support is 3320-3316; short-term resistance is 3350-3358, and strong resistance is 3365;

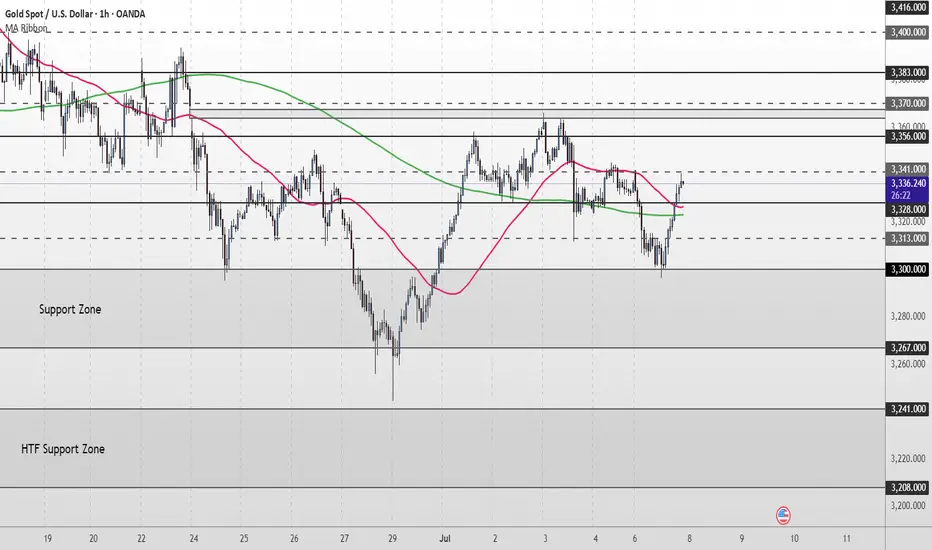
Gold Short Term OutlookGold dipped earlier in the session as the $3,328 support level failed, pushing price into the upper boundary of the broader Support Zone. From there, we’ve seen a strong bounce, with price now trending around the $3,341 minor resistance.
Price has reclaimed both the 50MA and 200MA, suggesting bullish momentum may be returning. A clean break and hold above $3,356 would likely open the path toward higher resistance levels, including $3,370 and $3,383.
However, failure to break and hold above $3,356 could lead to another pullback toward the Support Zone. If that zone fails to hold, we may see a deeper move into the higher timeframe (HTF) support area below $3,300.
📌 Key Levels to watch:
Resistance:
$3,356 ‣ $3,383 ‣ $3,400 ‣ $3,416
Support:
$3,328 ‣ $3,300 ‣ $3,267 ‣ $3,241 ‣ $3,208 (HTF Support)
Tuesday Outlook on Gold (XAU/USD)
After Monday’s move into the 4H Fair Value Gap and rejection near the trendline and Asia High, I’m expecting a corrective move to start Tuesday.
I’m currently watching two possible downside targets:
🔸 Scenario 1: A short-term drop into the upper part of the 4H FVG (around 3320–3310) – this zone could act as intraday demand and cause a quick bounce.
🔸 Scenario 2: A deeper retracement toward the unfilled imbalance around 3290–3280, lining up with the London Low and completing the 4H FVG.
This would be a more significant liquidity sweep before a potential bullish reaction.
From both zones, I’ll be looking for price action to confirm a possible long setup back toward the trendline and above.
Let’s see how Tuesday plays out.

90-day tariffs expire, how to position gold next week📰 News information:
1. 90-day tariffs are about to expire
📈 Technical Analysis:
With the Trump administration's massive tax cut and spending bill officially implemented, the U.S. Treasury may start a "supply flood" of short-term Treasury bonds to make up for the trillions of dollars in fiscal deficits in the future. Concerns about the oversupply of short-term Treasury bonds have been directly reflected in prices. The yield of 1-month short-term Treasury bonds has risen significantly since Monday this week. Slowing wage growth, falling total work hours, stagnant wage income growth and concerns about consumer spending are all signs that support gold.
From a technical perspective, Friday's closing long shadow small candle body, the price closed at a high of 3345 and a low of 3224. The overall idea for next week is to follow the trend and rely on the first short-term support of 3323 below to participate in long positions. Secondly, 3315-3305 is given below. If the support point is lost, then 3300 below is also in danger, and there is no need to overly insist on continuing to do more at low levels in the short-term rhythm. The key pressure above is 3340-3350, and the limit is the pressure of 3360 above.
🎯 Trading Points:
BUY 3325-3323
TP 3333-3340-3350
BUY 3315-3305
TP 3325-3333-3340
In addition to investment, life also includes poetry, distant places, and Allen. Facing the market is actually facing yourself, correcting your shortcomings, confronting your mistakes, and strictly disciplining yourself. I hope my analysis can help you🌐.
FXOPEN:XAUUSD PEPPERSTONE:XAUUSD FOREXCOM:XAUUSD FX:XAUUSD OANDA:XAUUSD TVC:GOLD

GOLD TODAYHello friends🙌
🔊Due to the weakness of buyers and the strength of sellers, the price continues to fall...
We have identified two supports for you that will not be seen if the price continues to fall, and if the selling pressure increases, we will update you.
🔥Join us for more signals🔥
*Trade safely with us*

Gold: update hello friends✋️
According to the recent growth of gold, you can see that it is constantly resisting and forming a falling pattern.
For this reason, it can be a warning that the fall can continue and the price will fall to the specified limits.
🔥Follow us for more signals🔥
*Trade safely with us*

XAU/USD – 45-Minute Chart Breakdown **Date:** July 7, 2025 # 📊 XAU/USD – 45-Minute Chart Breakdown
**Date:** July 7, 2025
**Current Price:** $3,326.97
**Bias:** 📈 Bullish Breakout
---
## 🔹 Key Market Structure:
- **Trendline Breakout**: ✅
Price broke cleanly out of the descending trendline that had held since the $3,362 high.
- **LL → HL Shift**:
The structure is transitioning from Lower Lows to potential Higher Lows (HL) – a strong sign of **reversal**.
- **BOS Zone** (Break of Structure):
BOS has been confirmed; further upside is now **probable**.
---
## 🔸 Trade Zone:
| Type | Level | Description |
|------------|------------|--------------------------|
| **Entry** | ~$3,326 | Breakout confirmation 🔓 |
| **SL** | ~$3,319 | Below recent HL 🛡️ |
| **TP1** | $3,362 | Top of previous range 🎯 |
| **TP2** | $3,385+ | Momentum extension 📈 |
---
## 📌 Indicators & Labels:
- **Structure:** `Bullish` 🟢
- **Efficiency:** `Efficient` ✅
- **MSU:** Bearish (short-term countertrend, being invalidated)
- **VTA:** Active ⚡️
---
## 🧠 Strategy Note:
This breakout is occurring **after a full liquidity sweep** and a **strong bullish reaction** off the $3,290s. Volume is supporting the move and **confluence** builds toward continuation.
> 💬 *"The best trades come when structure, liquidity, and timing converge."* – Let's ride this wave with confidence.
---
### 👑 For Persian Princes of the Market 🇮🇷
We don’t guess. We **track, adapt, and lead**.
---
## 🟢 Potential Breakout from the Descending Channel
As observed in the **45-minute timeframe**, Gold (XAU/USD) has been respecting a classic **descending channel** formed by a sequence of Lower Highs (LH) and Lower Lows (LL), leading to an overall bearish structure.
However, in the latest candles, price has **broken above the upper boundary of the channel**, signaling a potential shift in market structure.
---
### 🔍 Technical Highlights:
- ✅ **Breakout above the channel** = First sign of bullish reversal
- ✅ **Formation of Higher Low (HL)** after a strong rally = Added confirmation
- ✅ **Efficient bullish move** with momentum pushing toward previous Highs
---
### 🎯 Forecast Scenario:
If price holds above the breakout zone (around **$3,327**), we can expect a bullish continuation toward:
- 🥇 **Target 1:** $3,362
- 🥈 **Target 2:** $3,385+
A **successful retest** of the broken channel would serve as a powerful confirmation for this setup.
---
> ⛳️ *This move reflects not just a breakout — but a disciplined journey through structure, liquidity, and price behavior. Pure technical elegance.*
> — *Mohsen Mozafari Nejad*
---
📈 **Structure:** Bullish
⚡️ **Momentum:** Efficient
🕰 **Timeframe:** 45 Min
💰 **Current Price:** ~$3,327

7/7: Key Zone – 3320 to 3350Good morning, everyone!
Due to the U.S. market closure on Friday, price movement remained relatively subdued, and the week concluded with modest gains. As of this morning, gold opened higher but has since pulled back, and the price remains in a consolidation phase.
Key technical levels for today:
Resistance: around 3350
Support: near 3321
Short-term traders may focus on range-bound strategies between these levels. If a breakout occurs, follow the trend accordingly:
If price breaks above and stabilizes above 3338, the market may shift its focus toward the 3400 psychological level;
If price drops below and holds under 3332, there’s potential for a retest of the 3260 support zone.
In terms of broader trend analysis, the MA20 and MA60 on the daily chart should be watched closely, as they currently serve as key dynamic resistance and support levels.
Lastly, stay alert to any developments related to trade tariffs, as such news may significantly impact market sentiment and gold price direction.

Gold fluctuates, beware of rebound caused by new tariffs📊 Gold Day Trading Strategy (Recommendation index ⭐️⭐️⭐️⭐️⭐️)
📰 News information:
1. 90-day tariffs are about to expire
2. New unilateral tariffs
3. Geopolitical situation
📈 Technical Analysis:
As I said this morning, shorting gold is divided into two times, the first time is near 3324, and the second time is at 3340 or 3345. If there is a short-term retracement after breaking through 24, you can follow up with a long order to look at 3335-3340. If gold is in a very weak state, you can consider shorting near 3315 and look at 3300. Because during the European session, 3300 has strong support, and the European session repeatedly tests this support. If it falls below 3300, we will go to 3295-3285, or even 3250. But at the same time, we need to pay attention to the rebound of gold that may be caused by tariff policies and geopolitical situations.
🎯 Trading Points:
SELL 3315-3325-3335
TP 3305-3295-3285
BUY 3290-3285
TP 3300-3310-3320
In addition to investment, life also includes poetry, distant places, and Allen. Facing the market is actually facing yourself, correcting your shortcomings, facing your mistakes, and being strict with yourself. I share free trading strategies and analysis ideas every day for reference by brothers. I hope my analysis can help you.
TVC:GOLD OANDA:XAUUSD FX:XAUUSD FOREXCOM:XAUUSD PEPPERSTONE:XAUUSD FXOPEN:XAUUSD

The bears will take the 3290-3280 area stronglyGold started to fall from 3342 during the day and fell below 3300 at one point. Gold is in an obvious short position, and during the London market, gold continued its downward momentum without any decent rebound. Gold is in an extremely weak state. In the absence of a rebound in the London market, I think New York is very likely to continue to fall.
According to the current structure, gold is facing technical suppression of the head and shoulders in the short term, which greatly limits the rebound space of gold and suppresses the rebound limit within 3335. As the center of gravity of gold moves down, the resistance in the short term moves down to the 3315-3325 area. After breaking through 3330, the downward space has been opened up to a certain extent. So don’t be fooled by the false bullish candle that appear near 3330. Gold will inevitably continue to fall to the 3290-3280 area.
The 3290-3280 area is bound to be won, so shorting gold is still the first choice for short-term trading. You can consider shorting gold with the 3315-3325-3335 area as resistance, and look to the target area: 3295-3285-3275.
