Gold falls below 3300, will it rebound or continue to fall?Gold opened lower in the morning today and then rebounded and fell again. This kind of jump market fluctuates quickly but is mostly short-term. I usually remind you to avoid chasing orders to prevent being washed. Gold rebounded weakly and failed to touch 3320 and began to fall continuously. This weak signal alerted me - it failed to rebound strongly after the gap and instead remained at a low level, suggesting that the downward momentum was very strong and fully released, and there was a risk of further weakening. In the afternoon, the gold price was still hovering around 3312-3307, confirming its weak pattern. Combined with the repeated pressure on the key support 3300, I judged that the trend has clearly turned to short.
Gold recommendation: short in the 3312-3315 range, stop loss 3320, target 3280
Xauusdupdates

New tariffs are coming. How should gold respond?📰 News information:
1. 90-day tariffs are about to expire
2. New unilateral tariffs
3. Geopolitical situation
📈 Technical Analysis:
On July 4th local time, there were constant turmoil in American politics and trade. Trump declared that the US government would send letters to trading partners that day to set new unilateral tariff rates, which would most likely take effect on August 1. He also revealed that the new tariff rates could soar to 70%. At the same time, Japan-US trade negotiations encountered obstacles, India planned to impose retaliatory tariffs on the United States, and the China-EU tariff war had also begun. At present, the news seems to be more favorable to the bulls.
From a technical point of view, gold closed higher last week, showing that there is still upward momentum this week. In the short term, we need to pay attention to the pressure in the 3365 and 3375 - 3380 areas, and the 3400 mark is a key position where bulls and bears are fighting fiercely. Before breaking through this position, we must be alert to the risk of falling back after a high rise. Pay attention to the support of 3310-3305 and 3295-3285 below. If effective support is obtained, we can consider going long. If it breaks, it may go to 3270-3260. Gold jumped to 3342 at the opening of the Asian session and then fell back. 3345 is the key in the short term. The news may affect its subsequent trend. In the short term, pay attention to the suppression of 3345 on the upper side, and further to the strong resistance area of 3365-3380. If there is resistance and pressure, you can short at a high level. The impact of recent news is erratic, so enter the market with caution and be sure to set TP and SL strictly.
🎯 Trading Points:
SELL 3330-3345
TP 3320-3310-3295
BUY 3310-3305
TP 3320-3330-3345
In addition to investment, life also includes poetry, distant places, and Allen. Facing the market is actually facing yourself, correcting your shortcomings, confronting your mistakes, and strictly disciplining yourself. I hope my analysis can help you🌐.
TVC:GOLD OANDA:XAUUSD FX:XAUUSD FOREXCOM:XAUUSD PEPPERSTONE:XAUUSD FXOPEN:XAUUSD

NFP continues to ferment, short-term trend dominated by bears📰 News information:
1. 90-day tariffs are about to expire
2. New unilateral tariffs
3. Geopolitical situation
📈 Technical Analysis:
Good morning, bros. From a technical point of view, the overall trend of the daily line is a head and shoulders top. If the bulls do not recover 3360, the bears will still be the medium-term trend. The 4H MACD indicator is dead cross running. The best position for the day to deploy the short position again is 3330-3335, and the 1H chart keeps testing the 3305 first-line support, which may be broken in the short term. At present, 3295-3285 below is a relatively important short-term support. Once it falls below, it is expected to reach 3250, which is also the point I repeatedly emphasized in the morning. The intraday operation suggestion is to rebound shorting as the main, and to go long at lows as the auxiliary. Pay attention to the 3325-3335 support area on the upper side and the 3295-3285 support on the lower side.
🎯 Trading Points:
SELL 3325-3335
TP 3315-3305-3295
BUY 3295-3285
TP 3305-3315-3325
In addition to investment, life also includes poetry, distant places, and Allen. Facing the market is actually facing yourself, correcting your shortcomings, confronting your mistakes, and strictly disciplining yourself. I hope my analysis can help you🌐.
FXOPEN:XAUUSD PEPPERSTONE:XAUUSD FOREXCOM:XAUUSD FX:XAUUSD OANDA:XAUUSD TVC:GOLD

Gold shock pattern breaksGold prices rose rapidly at the opening of the morning, reaching a high of 3342 before falling back. This early morning sharp pull-up market needs special attention, because from the perspective of short-term trading, this is the trend pattern that needs the most vigilance. Looking back at the trend of last Thursday, there was also a situation where the early morning surge could not continue. Historical data shows that this kind of morning pull-up often lacks sustained momentum and has limited room for subsequent increases. Combined with the recent trend, although the price rebounded on Monday and Tuesday, it basically maintained a volatile pattern in the following trading days, but the fluctuation range changed. After repeated struggles in the 3345-3322 range on Friday, the gold price rose again in this trading day and fell below the key support level of 3322. This important change means: 1. The original 3322-3345 oscillation range has been broken; 2. After the range moves down, 3322 changes from a support level to a resistance level; 3. The short-term trend weakens, and it is recommended to adopt a high-sell strategy. It is recommended to short at highs near 3322, and focus on the 3295-3293 support area below.

#XAUUSD: Early Mitigation Or Sellers Trap! Let's See Gold dropped after touching 3365 taking price to 3318.Currently ranging market showing confusion over how gold would react to NFP data which is coming out tomorrow. At this moment we are quite certain that price would drop tomorrow either from entry one or entry two. Please use accurate risk management while trading.
Good luck and trade!
Team Setupsfx_
XAUUSDGold continued to fall at the opening today, currently hitting the lowest level of 3300, with a high and low range of 40 US dollars, but the overall market is still volatile, so don't chase shorts at low points
Short-term needs to wait for a rebound before shorting, pay attention to the 3318/3323 resistance

Trade Breakdown: XAUUSD 15-Min | Liquidity Grab + Reversal PlayOANDA:XAUUSD
Psychological Setup
This trade is rooted in the psychology of smart money and retail behavior. After a sharp drop in price, most retail traders expect continuation (trend-following). However, institutions often manipulate liquidity zones — hunting for stop-losses before a true reversal. This trade capitalizes on that behavior.
🔍 Technical Explanation:
🔻 1. Market Structure:
Price was previously in a downtrend, forming lower highs and lower lows.
A falling wedge pattern (red lines) formed after a strong bearish move, signaling potential bullish reversal.
Price broke the wedge to the upside — a classic reversal signal.
🔁 2. Liquidity Concept:
Below the wedge: The market grabbed liquidity by taking out stop losses of buyers who entered too early.
Above the wedge (TP Areas):
TP 1 Area (red box): This is the first logical resistance where previous supply sits — many sellers will enter here, providing buy-side liquidity.
Next Target Liquidity (grey box above): This is a major imbalance zone and likely where stop-losses of early short sellers are stacked.
Price is expected to grab liquidity from that area (marked by the red arrow).
✅ Entry & Trade Logic:
Entry Zone: After liquidity was swept at the bottom of the wedge, a bullish engulfing candle formed near demand — signaling institutional interest.
Risk-Reward Setup:
Targeting 0.80% move (approx. 26.48 points).
Trade is based on reversal from demand zone + wedge breakout + liquidity grab confirmation.
🎯 Target Projections:
TP1 Area: Conservative target, just above recent structure.
Final Target: High-probability liquidity zone where market is drawn to clean up resting orders (grey zone).
🧠 Why This Trade Matters (Trading Psychology Insight):
Most retail traders get trapped in emotional entries — entering shorts after a drop or longs too early in a wedge.
Smart money waits for liquidity sweeps before moving price in the desired direction.
This setup shows the importance of patience, structure, and understanding market psychology rather than reacting emotionally to price action.
📌 Key Takeaways:
📉 Trap: Falling wedge builds false bearish confidence.
🧠 Psychology: Stop hunts create fuel for reversal.
📈 Reaction: Smart money absorbs liquidity, moves price toward next inefficiency.
Hashtags:
#XAUUSD #SmartMoney #LiquidityHunt #TradingPsychology #GoldTrade #PriceAction #WedgeBreakout #FXOpen #TechnicalAnalysis #SupplyDemand

GOLD H2 Intraday Chart Update For 7 July 2025Welcome to the new week traders
as we have FOMC meeting minutes report due this week so firs market is fell down from 3350 Psychological level now is testing 3300 psychological level
all eyes on breakout of 3300 level for now if market breaks 3300 level then it will move towards 3280 then 3350
only clear breakout of 3335 will clear path for towards 3368 level
Disclaimer: Forex is Risky

Where will the price of gold go under such strong pressure?From the 4-hour analysis, the support line of 3295-3301 is concerned below, the short-term resistance above is concerned about 3316, and the suppression line of 3345-50 is focused on. The overall main tone of high-altitude low-multiple cycle participation remains unchanged. In the middle position, watch more and do less, and follow orders cautiously, and maintain the main tone of participation in the trend. Wait patiently for key points to participate.

XAUUSD – Fresh Bearish Setup After TP HitWelcome to Velatrix Capital.
Last week’s short position on Gold has just hit Take Profit.
Based on current structure and momentum, we remain bearish-biased and have already entered a fresh short trade from a key resistance level.
This setup aligns with our internal system’s confluence logic and is now active.
🔍 Trade Parameters
• Timeframe: 1H
• Direction: Sell
• Entry: 3310.11
• Take Profit: 3266.76
• Stop Loss: 3324.51
• Risk/Reward: 1:3
Note: This is not financial advice. This is a real trade taken by our team based on a structured, repeatable trading model.
Use it as insight. Not as instruction.
🔔 Follow Us
We don’t chase hype.
We build edge.
Follow for raw setups, structured strategies, and institutional-grade breakdowns.

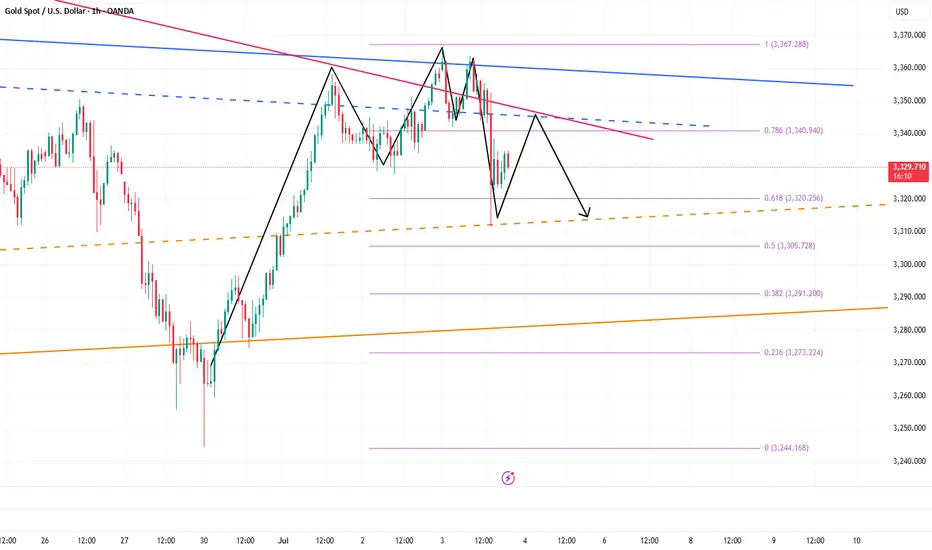
Elliott Wave Analysis – XAUUSD – June 8, 2025🌀 Elliott Wave Structure Timeframe: H4
Currently, price action is overlapping with multiple abc correction patterns. To reduce noise and gain a clearer perspective, I’ve shifted the analysis to the H4 timeframe.
From the 3500 level down to now, the entire corrective move has been composed of overlapping abc patterns rather than sharp, impulsive rallies. This suggests we are likely forming a contracting triangle correction in the form of abcde (green) as shown on the chart.
At the moment, price appears to be in wave d (green), which is unfolding as a wxy structure (red).
Trading during triangle corrections is particularly challenging due to the complex interweaving of corrective waves. Additionally, price is consolidating within the Volume Profile’s high-liquidity zone, as shown on the chart. Therefore, it is best to remain patient and wait for the triangle pattern to complete.
📉 Momentum
Daily (D1) momentum: Currently showing signs of a bearish reversal → suggesting that price may move sideways or lower this week. (Toward the end of a triangle, price tends to compress and lose clear directional bias.)
H4 momentum: Also shows reversal signals, and a strong bearish candle has recently formed. Thus, a short-term bearish bias is preferred until H4 momentum reaches the oversold region.
🎯 Price Targets
Since the market is currently forming overlapping abc structures, setting precise wave targets is difficult. Therefore, I rely on Volume Profile zones to define key levels:
3342 Resistance Zone: Marks the boundary between high and low liquidity areas → This is a Sell Zone, supported by confluence with D1 and H4 momentum signals.
3294 Support Zone: Represents the lower boundary of high liquidity → This is the projected end of wave X (red) and serves as our Buy Zone.
🧭 Trade Plan
🔻 Sell Zone:
Entry: 3340 – 3342
SL: 3350
TP1: 3320
TP2: 3300
🔺 Buy Zone:
Entry: 3295 – 3293
SL: 3285
TP1: 3312
TP2: 3342
TP3: 3390
📌 Personal Note:
At this stage, I prefer to wait for the abcde triangle to complete or for more structural confirmation. If you decide to trade, focus on short-term setups with reduced position size to manage risk during this complex correction phase.

XAUUSD – High-Precision Sell Setup with 1:2.70 R/RGreetings, traders.
After a brief tactical pause, we’ve identified a **high-conviction short setup** on **XAUUSD**.
Despite the U.S. Independence Day holiday, structural momentum suggests there’s still room for meaningful movement in gold during today’s session. The risk-to-reward profile on this setup is exceptional — clocking in at **1:8.70**, it meets our highest-tier execution standards.
If momentum stalls or price consolidates excessively, the trade will be manually closed by **23:00 (UTC+4)**, regardless of outcome.
🧠 Trade Parameters:
• **Timeframe:** 1-Hour (H1)
• **Direction:** Sell
• **Entry:** 3337.09
• **Take Profit:** 3312.16
• **Stop Loss:** 3345.63
• **Risk/Reward Ratio:** 1:2,70
• **Trade Management Note:** Will be closed manually by 23:00 (UTC+4) if momentum conditions are not met.
🔗 Signal Source
All trade setups are published directly by Velatrix Capital — a high-discipline trading desk focused on FX, crypto, and global indices.
No opinions. No hype. Just statistically-grounded execution.
All signals are posted via our TradingView desk:
👉 (www.tradingview.com)
📈 **We don’t chase hype. We build edge.**
🔔 **Subscribe for future setups and institutional-grade trade intelligence.**
**Velatrix Capital**

Continue to short gold, bears will exert force againAffected by the NFP market, gold fell precipitously, almost giving back 50% of the gains in the previous wave, and the short-selling performance was particularly strong; technically, gold successfully built a double-top structural resistance in the 3365-3363 area in the short term, which played a technical suppression role in the short term. As gold fell, the current short-term resistance moved down to the 3340-3350 area;
On the other hand, although gold began to rebound after falling to around 3312, it clearly showed the characteristics of weak rebound, and it did not even stand above 3340 once, and the long forces were insufficient; and technically, a single lower shadow line was not enough to support the continued rebound of gold, so gold still had the need to retrace the support below from a technical perspective; and once gold fell again, it was very likely to test the 3305-3295 area again.
So I think we can take advantage of the rebound of gold to short gold again. We can still short gold with the 3340-3350 area as resistance and look at the target area: 3315-3305-3295.
Consolidating Below Trendline Resistance, Bearish Bias IntactTechnical Structure:
OANDA:XAUUSD Gold (XAU/USD) continues to trade below the descending trendline TL1, having failed multiple times to breach the $3,338–$3,345 resistance zone. After retesting Support Zone 1 ($3,303–$3,310), the price is showing signs of a short-term bounce. However, the broader structure remains bearish unless the price can break above TL1.
Key Technical Levels:
Resistance Zone: $3,338 – $3,345
Support Zone 1: $3,303 – $3,310
Support Zone 2: $3,260 – $3,253
Trendline: TL1 continues to act as dynamic resistance
Strategy Insight:
If TVC:GOLD gold remains below the descending TL1, bearish pressure is likely to resume. A short opportunity may arise if the price retests the resistance area and stalls. A confirmed break below Support Zone 1 would expose targets at $3,260 and $3,253.
Disclaimer:
This analysis is for educational purposes only and does not constitute investment advice. Please consult a qualified financial advisor before making trading decisions.

XAUUSD – Gold at a Key AreaGold is now in a crucial zone with short potential.
If the market provides a valid bearish signal, I’ll take the short.
But if this zone breaks and confirms with a pullback, I’ll switch bias and go long.
💡 Remember:
We don’t control the market — we just try to profit using structure, setups, and solid risk management.
📌 Always risk max 1% per trade.
If the market goes against your bias, you only lose 1% — not your whole account.
🧠 One trade won’t make you rich,
But one reckless trade can destroy everything.
No gambling.
Just discipline, structure, and smart execution.

Gold Spot / U.S. Dollar (XAUUSD) 2-Hour Chart2-hour chart from OANDA displays the recent price movement of Gold Spot (XAUUSD) against the U.S. Dollar. The current price is $3,336.615, up by $10.585 (+0.32%). The chart highlights a recent upward trend with a buy signal at $3,336.970 and a sell signal at $3,336.260. Key price levels include a resistance zone around $3,364.828 and a support zone near $3,309.957, with the price showing a potential breakout above the recent consolidation range.

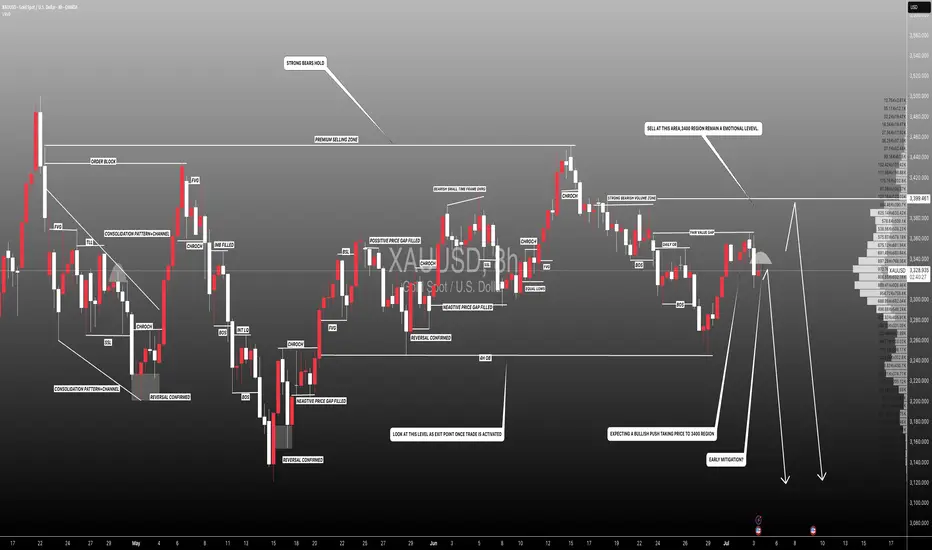
XAUUSD | 30m | Weekly Open Outlook Published by Mohsen Mozafari## 📍 XAUUSD | 30m | Weekly Open Outlook
⏱️ *Published by Mohsen Mozafarinejad*
---
### 🔍 Market Structure:
The market currently shows a **bearish structure**.
After a recent **BOS (Break of Structure)** near the 3344 zone, price retraced to mitigate unfilled sell orders within the **Extreme Supply OB (TLQ)**.
---
### 🔸 Key Observations:
- Price is reacting from a clear **supply zone (TLQ)** following BOS.
- The move appears to have cleared liquidity from late long entries.
- OB efficiency remains intact, indicating healthy market flow.
---
### 🧭 Scenario A – Short Bias
> If price consolidates or rejects below the 3340 level, a **high-probability short** may form.
🎯 Target: **Demand OB at 3295**
🚫 Invalidation: **Break & close above 3354 (last HH)**
---
### 🧭 Scenario B – Fakeout & V-Shape Reversal
> If price sweeps above TLQ but loses momentum, it could trap buyers and sharply reverse below BOS.
This would signal potential **seller exhaustion**.
---
### ⚙️ Technical Summary:
- **Structure:** Bearish 🔻
- **Efficiency:** Efficient ✅
- **MSU & VTA levels:** Valid for lower timeframe confirmations
- **Momentum:** Controlled pullback detected
---
> 📌 *"Precision beats prediction. Let the chart speak before you act."*
---
#### 🔖 Hashtags:
#XAUUSD #SmartMoney #SupplyDemand #OB #BOS #ScalpingGold #ForexAnalysis #MohsenMozafarinejad

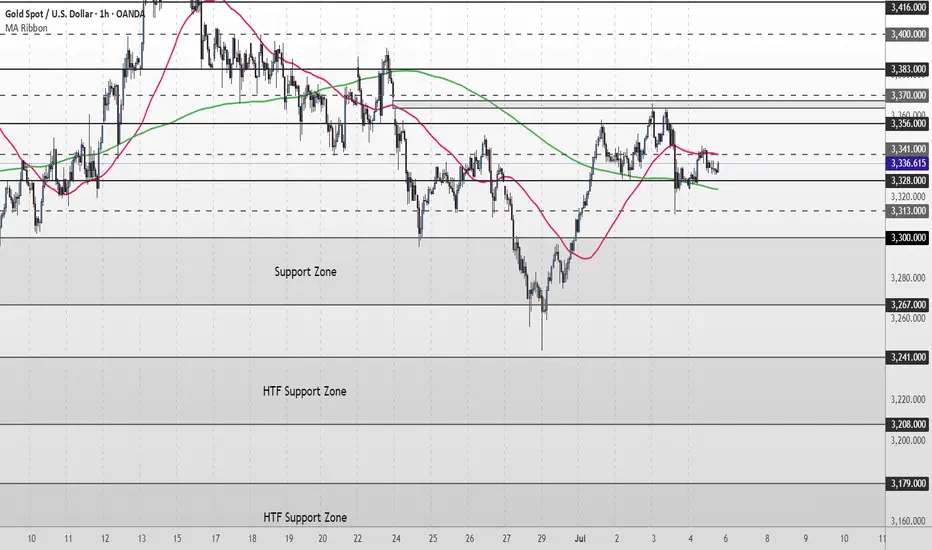
XAU/USD Weekly & Daily Outlook | What’s Next for Gold?Gold starts the new trading week still locked in a consolidation range, holding just above the $3,328–$3,327 support zone. Despite multiple attempts, price continues to struggle at the $3,356 resistance.
The 50MA and 200MA are now compressing, suggesting the market is preparing for a breakout. Until then, structure remains neutral and range-bound.
📌Key levels to watch:
Resistance:
$3,356 ‣ $3,383 ‣ $3,400 ‣ $3,416 ‣ $3,440
Support:
$3,328 ‣ $3,313‣ $3,300 ‣ $3,267 ‣ $3,241
‣ $3,208 / $3,179 – Deeper downside if bearish pressure builds
🔎 Fundamental Focus
The key risk event this week is Wednesday’s FOMC Meeting Minutes. Markets will be looking for clues on the Fed’s internal stance regarding future rate cuts and inflation expectations.
🔗 Follow for live updates and intraday chart setups.
XAU/USD possible shorts from 3,350 towards 3,290 longsThis week, my focus is on a potential sell setup that could form within the 4-hour supply zone, which is currently near price. I’ll be patiently watching for signs of Wyckoff distribution within this point of interest (POI), which could confirm a short opportunity.
Given that price action has been bearish, this would be a pro-trend setup, especially with the visible liquidity resting below that we can look to target. Additionally, there is an 8-hour demand zone further below, which may provide a potential long opportunity once price reaches that level.
Confluences for GOLD Sells:
- Bearish market structure: Gold has been trending downward and has recently left behind a clean, unmitigated 4-hour supply zone, which could prompt a bearish reaction.
- Liquidity targets below: There's significant liquidity under recent lows, including Asia session lows and the 8-hour demand zone, which can be targeted.
- DXY correlation: The dollar has reacted strongly from a notable demand zone, suggesting potential upside for DXY, which may add bearish pressure on gold.
- Higher timeframe Wyckoff: A Wyckoff distribution pattern has also formed on the higher timeframe, which may indicate temporary bearish order flow.
P.S. If price disrespects the current 4-hour supply zone, I will shift focus to an extreme 3-hour supply zone above. Until price reaches that level, I may look for short-term buy setups to trade the move up.
Wishing everyone a great and profitable trading week! Stay disciplined and manage risk accordingly.

GOLD Massive Bullish Breakout!
HI,Traders !
#GOLD is trading in a strong
Uptrend and the price just
Made a massive bullish
Breakout of the falling
Resistance line and the
Breakout is confirmed
So after a potential pullback
We will be expecting a
Further bullish continuation !
Comment and subscribe to help us grow !

Gold - The final resistance breakout!Gold - TVC:GOLD - prepares a final rally:
(click chart above to see the in depth analysis👆🏻)
Over the past 12 months, Gold rallied more than +70%. However the past three months clearly rejected a major horizontal resistance. But price action on the smaller timeframe remains incredibly bullish. Therefore an all time high breakout will most likely follow.
Levels to watch: $3.500
Keep your long term vision!
Philip (BasicTrading)

June Nonfarm Data: Gold PlungesThe US June nonfarm payrolls data is out: 147,000 jobs were added, exceeding the expected 106,000 and the previous 139,000, with slight upward revisions to the prior two months’ figures. The unemployment rate dipped from 4.2% to 4.1%, beating the forecast of 4.3%. While the US economy slows, the job market remains robust. 🌟
Post-data release, market bets on a July rate cut have evaporated, with the probability of a September cut dropping to around 75%. US stock futures extended gains, Treasury yields rose across the board, the US Dollar Index surged, and gold plunged nearly $40 in a short squeeze—signaling an unexpected major bearish hit to gold. Weng Fuhao advises trading with the trend, focusing on shorting on rebounds. 😲
Gold, jolted by the nonfarm data, slid sharply in the short term before a minor rebound, with bearish signals across all timeframes. The data triggered an immediate breakdown, shifting the short-term trend to downward: on the 3-hour chart, moving averages formed a death cross, MACD showed a death cross with expanding volume, and gold prices fell below the Bollinger Band lower track, confirming a clear bearish momentum. 📉
🚀 Sell@3355 - 3345
🚀 TP 3335 - 3325 - 3315
Accurate signals are updated every day 📈 If you encounter any problems during trading, these signals can serve as your reliable guide 🧭 Feel free to refer to them! I sincerely hope they'll be of great help to you 🌟 👇

Go short before breaking 3350, go long before falling to 3320📰 News information:
1. Geopolitical situation
2. Tariff implementation and interest rate cut bill
📈 Technical Analysis:
As I said, the US stock market closed early today, and the market will lack some momentum. It is difficult to have a large fluctuation. It is expected to fluctuate and consolidate. I also explained in the previous post that the upper pressure in the short term is at 3340-3350. If it is touched, we can try to short and defend 3360. If it falls back to 3323, we can try to go long for the first time. If it continues to fall, it is expected to reach 3315-3305. Therefore, if it first touches 3323, go long, SL 3316, and consider going long if it touches 15-05 below.
🎯 Trading Points:
SELL 3340-33350
TP 3330-3320-3310-3300
BUY 3323
TP 3333-3340-3350
BUY 3315-3305
TP 3325-3333-3340
In addition to investment, life also includes poetry, distant places, and Allen. Facing the market is actually facing yourself, correcting your shortcomings, confronting your mistakes, and strictly disciplining yourself. I hope my analysis can help you🌐.
TVC:GOLD OANDA:XAUUSD FX:XAUUSD FOREXCOM:XAUUSD PEPPERSTONE:XAUUSD FXOPEN:XAUUSD
