Elliott Wave Analysis – XAUUSD | February 7, 2025🌀 Elliott Wave Structure (H1 Timeframe)
Looking at the current price structure, we can see that the price is moving sharply and steeply—this suggests the formation of a 5-wave impulsive structure.
Specifically:
- Waves 1, 2, and 3 (green) appear to have completed.
- Currently, wave 4 is forming as a 3-wave corrective structure (abc in black).
- Once wave 4 completes, we anticipate the next upward move as wave 5, which will complete the full 5-wave cycle (green).
🎯 Potential Price Targets for Wave 4
Based on the structure of the abc correction and support zones, we identify two key target areas:
+ Target 1: 3324
+ Target 2: 3311
When the price breaks above the top of wave b (black), it will serve as a strong confirmation that wave 4 has ended and wave 5 is beginning.
📈 Momentum Analysis
Daily (D1): Momentum is still rising and likely needs 2–3 more days to enter the overbought zone, supporting the continuation of the uptrend.
H4: Momentum is about to turn upward, signaling wave 4 may be nearing completion.
H1: Momentum is also preparing to turn up, suggesting the price is approaching the end of the wave 4 correction zone.
💼 Trading Plan
BUY ZONE: 3325 – 3322
STOP LOSS: 3215
TAKE PROFIT 1: 3345
TAKE PROFIT 2: 3368
TAKE PROFIT 3: 3395
📌 Wait for H1–H4 momentum alignment before triggering a BUY entry for wave 5.
Xauusdupdates

As expected, it will fall and form a head and shoulders bottom📰 News information:
1. ADP data, for reference of tomorrow's NFP data
2. Interest rate cuts and Powell's dovish comments
3. Geopolitical impact on the gold market
📈 Technical Analysis:
Yesterday we expected gold to retreat to the 3330-3320 area. Today, gold hit a low of around 3328 during the Asian session, which is in line with our judgment of the market trend. In the short term, gold may still fall. First, it may test the 3323 support line. If it falls back to this position during the day, you can try to go long. In the short term, focus on the 3315-3305 long-short dividing line below. If gold gets effective support below, it is expected to form a head and shoulders bottom pattern. The short-term decline will accumulate momentum for the future rise. Pay attention to the ADP data during the NY period
🎯 Trading Points:
BUY 3323-3315-3305
TP 3340-3350-3360-3375
In addition to investment, life also includes poetry, distant places, and Allen. Facing the market is actually facing yourself, correcting your shortcomings, confronting your mistakes, and strictly disciplining yourself. I hope my analysis can help you🌐.
FXOPEN:XAUUSD PEPPERSTONE:XAUUSD FOREXCOM:XAUUSD FX:XAUUSD OANDA:XAUUSD TVC:GOLD

Exclusive trading strategy, short gold!From the current gold structure, we can see that gold still needs to continue to retest the 3320-3310, or even the 3305-3295 area; so in the short term, we can still seize the opportunity to consider shorting gold in batches in the 3340-3360 area.
Trading signal:
@3340-3360 Sell, TP:3325-3315-3305
A reliable trader must have an explanation for everything and respond to everything. I have always been committed to the market and insist on writing the most useful core strategies for traders. The transaction details can be seen in the channel!

gold on sell retrace#XAUUSD still on sell reverse, between 3347-3348 holds sell reverse. But if current H1 closes above 53 then bullish starts.
Sell limit 3347-3348, target 3320, stop loss 3356.
Above 3353 have bullish on H1 closure, target 3370

How do we plan before ADP and NFP?📰 News information:
1. ADP data, for reference of tomorrow's NFP data
2. Interest rate cuts and Powell's dovish comments
3. Geopolitical impact on the gold market
📈 Technical Analysis:
The market will continue to fluctuate before the ADP data, and the market will continue to rise after the adjustment. In the 4H cycle, the upper rail of the pressure is temporarily suspended, and the Bollinger Bands also close. This is why I emphasize the need to pay attention to the 3323 support line below. At present, gold rebounded, I think it will touch 3348 at most, that is, it rebounded to 50%. Therefore, before the ADP data, I still hold the position of 3340-3350 for shorting, and find support for long at 3325-3315 below. I have marked the pattern of head and shoulders bottom in the figure. I have been engaged in spot, futures, foreign exchange and other transactions for many years. My analysis ideas can be referred to by brothers
🎯 Trading Points:
SELL 3340-3350
TP 3330-3325-3315-3295
BUY 3323-3315-3305
TP 3340-3350-3360-3375
In addition to investment, life also includes poetry, distant places, and Allen. Facing the market is actually facing yourself, correcting your shortcomings, confronting your mistakes, and strictly disciplining yourself. I hope my analysis can help you🌐.
TVC:GOLD OANDA:XAUUSD FX:XAUUSD FOREXCOM:XAUUSD PEPPERSTONE:XAUUSD FXOPEN:XAUUSD

Will Gold Continue Its Strong Rally or Face a Pullback?XAUUSD 02/07: Will Gold Continue Its Strong Rally or Face a Pullback?
📉 Technical Analysis – Gold Faces Short-Term Pullback After Strong Rally
Gold has been experiencing a clear rally in recent days, but it’s currently undergoing a brief correction. The price has recently dropped slightly, prompting traders to keep a close eye on key levels for potential reversal or continuation of the bullish move.
🌍 Macroeconomic Context – Factors Impacting Gold's Price
USD Fluctuation: The weakness in the US Dollar continues to affect gold prices, creating opportunities for the precious metal to maintain its upward movement.
Geopolitical Tensions: Ongoing global tensions, including the US-Iran conflict, act as a safe-haven factor, supporting gold demand.
Interest Rate Expectations: The market is closely watching for any changes in interest rate policies. Any future rate cuts by the Fed could further bolster gold's price.
📊 Technical Outlook (H1 – H4 – D1)
Short-Term Trend: On the H1 timeframe, the price of gold touched a key level near 3340. From there, the price began to experience a pullback. However, the upward momentum remains strong on higher timeframes.
Key Support Levels: The 3300 level remains a crucial support. If the price stays above this, there’s a chance for gold to continue rising towards higher levels.
Key Resistance Levels: 3360 and 3380 are critical resistance levels. If breached, gold could move towards new highs.
📍 Important Support and Resistance Levels:
🔺 Resistance: 3345 – 3360 – 3380 – 3400
🔻 Support: 3300 – 3290 – 3270 – 3250
💡 Trading Plan for Today, 02/07:
🔵 BUY ZONE:
📈 Entry: 3305 – 3303
📉 SL: 3297
💰 TP: 3315 → 3325 → 3340 → 3360
🔴 SELL ZONE:
📉 Entry: 3360 – 3362
📈 SL: 3368
💰 TP: 3350 → 3340 → 3320
📣 Conclusion:
Gold is showing signs of short-term correction but remains a strong asset due to geopolitical factors and monetary policies. Buying opportunities continue to be attractive at support levels, while key resistances will play a crucial role for any breakout. Keep an eye on the mentioned levels to capitalize on market movements.
Happy trading and best of luck to all traders!

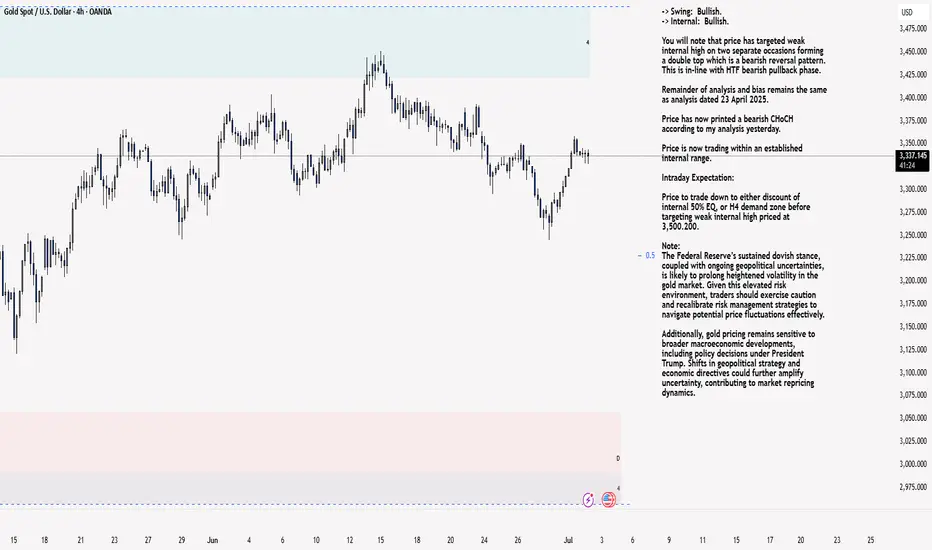
XAU/USD 02 July 2025 Intraday AnalysisH4 Analysis:
-> Swing: Bullish.
-> Internal: Bullish.
You will note that price has targeted weak internal high on two separate occasions forming a double top which is a bearish reversal pattern. This is in-line with HTF bearish pullback phase.
Remainder of analysis and bias remains the same as analysis dated 23 April 2025.
Price has now printed a bearish CHoCH according to my analysis yesterday.
Price is now trading within an established internal range.
Intraday Expectation:
Price to trade down to either discount of internal 50% EQ, or H4 demand zone before targeting weak internal high priced at 3,500.200.
Note:
The Federal Reserve’s sustained dovish stance, coupled with ongoing geopolitical uncertainties, is likely to prolong heightened volatility in the gold market. Given this elevated risk environment, traders should exercise caution and recalibrate risk management strategies to navigate potential price fluctuations effectively.
Additionally, gold pricing remains sensitive to broader macroeconomic developments, including policy decisions under President Trump. Shifts in geopolitical strategy and economic directives could further amplify uncertainty, contributing to market repricing dynamics.
H4 Chart:
M15 Analysis:
-> Swing: Bullish.
-> Internal: Bullish.
H4 Timeframe - Price has failed to target weak internal high, therefore, it would not be unrealistic if price printed a bearish iBOS.
The remainder of my analysis shall remain the same as analysis dated 13 June 2025, apart from target price.
As per my analysis dated 22 May 2025 whereby I mentioned price can be seen to be reacting at discount of 50% EQ on H4 timeframe, therefore, it is a viable alternative that price could potentially print a bullish iBOS on M15 timeframe despite internal structure being bearish.
Price has printed a bullish iBOS followed by a bearish CHoCH, which indicates, but does not confirm, bearish pullback phase initiation. I will however continue to monitor, with respect to depth of pullback.
Intraday Expectation:
Price to continue bearish, react at either M15 supply zone, or discount of 50% internal EQ before targeting weak internal high priced at 3,451.375.
Note:
Gold remains highly volatile amid the Federal Reserve's continued dovish stance, persistent and escalating geopolitical uncertainties. Traders should implement robust risk management strategies and remain vigilant, as price swings may become more pronounced in this elevated volatility environment.
Additionally, President Trump’s recent tariff announcements are expected to further amplify market turbulence, potentially triggering sharp price fluctuations and whipsaws.
M15 Chart:
Gold Price Analysis – Bullish Momentum Holds Above FVGs🧠 Chart Breakdown:
Instrument: Gold Spot (XAU/USD)
Timeframe: 1H
Current Price: $3,340
Trend: Short-term uptrend intact
🔑 Key Observations:
Ch.o.Ch Confirmed (Change of Character):
The break above the previous structure high confirmed a bullish market structure shift.
Fair Value Gaps (FVG):
Multiple FVGs exist between $3,320 – $3,335, acting as potential demand zones and support levels.
Fibonacci Retracement:
Price is respecting the 0.382–0.5 levels ($3,336 – $3,330) well so far.
Below this, the 0.618 level at $3,325 is the next strong confluence zone.
Trendline Support:
The price is testing a rising trendline, adding dynamic support around the current level.
Ichimoku Cloud:
Price is above the cloud, which supports the bullish bias.
Conversion line (blue) and base line (red) are bullishly aligned.
📉 Possible Next Moves:
✅ Bullish Scenario:
Price bounces from current levels or slightly lower ($3,336–$3,330) and retests the recent high (~$3,355).
Breakout above $3,355 could open the door to $3,370+.
⚠️ Bearish Scenario:
If price breaks below $3,330 and the trendline, expect deeper pullbacks to:
$3,325 (0.618 Fib)
Then possibly $3,308 FVG support or $3,258 major demand zone.
📌 Conclusion:
Gold is still respecting bullish market structure with healthy pullbacks into support zones. As long as the price stays above $3,325, the bullish outlook remains valid. Watch for bullish reaction near the FVGs or a break above $3,355 to confirm upside continuation.

Gold Trading Strategy June 27✏️The price reaction at 3348 forms a sustainable bearish structure. 3296 is an important zone when broken, it will continue to fall deeply without any recovery on Friday.
Today the downtrend will encounter less resistance than the uptrend. Therefore, it is not difficult to touch the support zones of 3278 and 3255.
Any recovery in the price in the European session is considered a good opportunity for a Sell signal towards the target of 3278 and 3255.
As analyzed, the SELL zone today is noted at many resistance zones and consider the price reaction for the SELL signals.
📈 Key Levels
Break out: 3296
Support: 3278-3255
Resistance: 3300-3312-3325-3336-3348-3363
📊 Recommended Trade Setups
BUY 3278-3276 SL 3272
SELL 3325-3327 SL 3330

GOLD H2 Intraday Chart Update For 2 July 2025Hello Traders,
Today all eyes on breakout of 3360-70 zone in order to GOLD go for further advance below this zone all eyes are remains on 3318 level if market successfully maintain 3330 level then will go down further towards 3300 Psychological Level after passing 3318
NFP main event of the day which is held by tomorrow
Disclaimer: Forex is Risky

7/2 Trapped Orders from Yesterday Turned ProfitableGood morning, everyone!
Yesterday’s early-entry gold short position encountered some temporary drawdown, but thanks to flexible adjustments, the trade has now moved into profit overall.
Currently, the price is hovering near a key support area. Based on the 1H and 2H charts, there is still room for further downside. At this point, there are two strategic options:
Close the position to lock in current profits;
Hold the position and wait for further decline, keeping in mind that if support holds, the price may rebound back toward the 3350 level, introducing some risk.
You can decide whether to stay in the trade or exit, depending on your risk tolerance and trading plan.

Gold operation suggestionsLooking back at the market in May and June, although gold has experienced adjustments, its shape is very resilient. In the monthly cycle, the price of gold is firmly above the MA5 moving average. From the perspective of large-cycle technical analysis, this is a typical strong bullish pattern, demonstrating the strong control of the bulls. As the adjustments are gradually in place, the later bullish outbreak is worth looking forward to. However, the adjustment to 3247 this time is not small, so in the short term, the gold price is likely to fluctuate upward. At present, 3451 is an important watershed. Once it is effectively broken through, the gold price is expected to hit the 3500 mark, and I personally believe that 3500 will not be the end point, and it is expected to be refreshed later.
Gold retreats as expected, how to trade in the future📰 News information:
1. Geopolitical situation
2. PMI data
3. Global Central Bank Governors Meeting
📈 Technical Analysis:
Our short orders have achieved profits. I closed the position near 3337, turning losses into profits. Interested friends can follow my previous post. In the short term, I am still optimistic that gold will retreat below 3335-3325. Today, gold rose sharply, and the rebound momentum was strong, while the short-term correction was slightly weak, so the space for a second decline in the short term will be limited. If it falls to the 3333-3323 range during the day and gets effective support, you can consider going long. The short-term upper resistance is 3360-3375.
🎯 Trading Points:
BUY 3333-3323-3315
TP 3341-3355-3360-3375
In addition to investment, life also includes poetry, distant places, and Allen. Facing the market is actually facing yourself, correcting your shortcomings, confronting your mistakes, and strictly disciplining yourself. I hope my analysis can help you🌐.
TVC:GOLD OANDA:XAUUSD FX:XAUUSD FOREXCOM:XAUUSD PEPPERSTONE:XAUUSD FXOPEN:XAUUSD
XAU/USD : GOLD AnalysisGold now shifts its direction downward as it was rejected from an hourly Order Block.
I am planning a short position in it, you guys can trade accordingly by managing your risk

Gold price rises by more than $100, will the bull run continue?📰 News information:
1. Geopolitical situation
2. PMI data
3. Global Central Bank Governors Meeting
📈 Technical Analysis:
The NY session is about to begin, and there are two things we need to pay attention to. First, the PMI data, and second, the talks between global central bank governors. If Powell again hints that the inflation outlook is weaker than expected, this will increase the Fed's easing bets and trigger a new round of decline in the US dollar. The dovish tone may help gold prices to further rebound. On the contrary, if Powell makes some hawkish or cautious remarks, this may exacerbate the recent downward trend in gold prices. The key point at present is the 3350 mark. If the 4H closing line of the NY session remains below 3350, then in the short term we are expected to continue to retreat to the 3330-3320 range. If the 4H closing line is above 3350 and stabilizes, gold may rebound to the 61.8% position, which is around 3372.
🎯 Trading Points:
SELL 3340-3350-3355
TP 3330-3325-3320
BUY 3330-3320
TP 3340-3350-3372
In addition to investment, life also includes poetry, distant places, and Allen. Facing the market is actually facing yourself, correcting your shortcomings, confronting your mistakes, and strictly disciplining yourself. I hope my analysis can help you🌐.
FX:XAUUSD FXOPEN:XAUUSD PEPPERSTONE:XAUUSD FOREXCOM:XAUUSD FX:XAUUSD OANDA:XAUUSD TVC:GOLD

gold on sell retest#XAUUSD price have retest 3350 which have short bearish retest, fundamental is possible to change market direction.
Sell limit 3350, target 3336-21, stop loss 3360.
2 times breakout above 3353 today high will continue bullish till 3370 bearish retracment.
#XAUUSD(GOLD)): 29/06/2025 Last Analysis Going Great!Gold has been moving nicely since our last analysis, which we posted. Currently, 750+ pips have been generated, and we expect further price drops. There are still two targets in place, as per our previous analysis. We anticipate a steady decline in the price. We recommend all of you to follow strict risk management. This is not a guaranteed analysis or view, but rather an overview/educational chart analysis.
If you want to support us, you can do the following:
- Like
- Comment
- Share
Team Setupsfx_

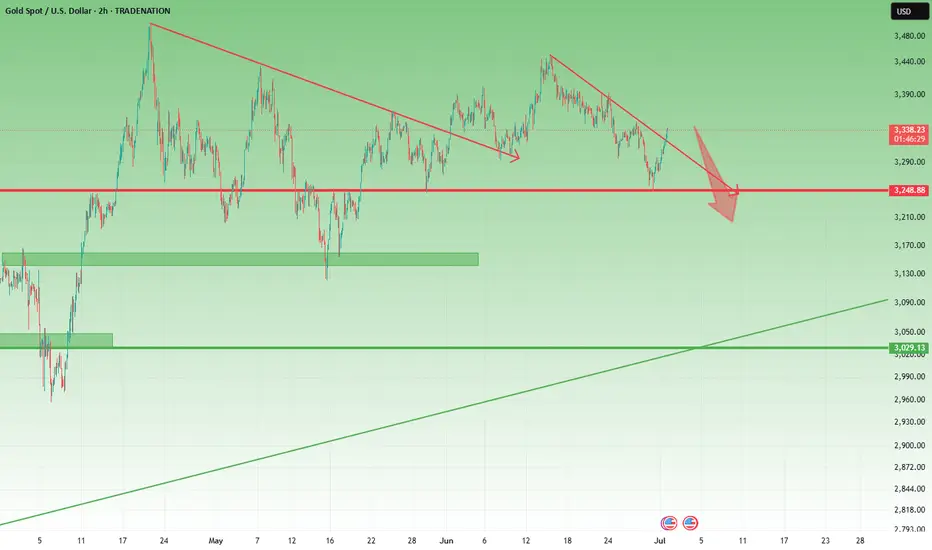
Gold Bulls Ready to Charge: $3,500 Target Could Be Days AwayThe chart shows a strong medium-term uptrend in gold that began in late 2024, carrying the price steadily higher through the first half of 2025. After peaking, price has been consolidating in a clear range bounded by a well-defined resistance and support zone.
The Resistance Zone is marked around $3,438, where price has been repeatedly rejected. Each time the market approached this level, sellers stepped in, causing retracements. This reinforces the area as a significant supply zone.
Below, the Support Region near $3,249–$3,250 has provided a floor for price action. It’s notable that this area was once a resistance, making it a classic breakout-retest structure. Buyers have stepped in multiple times to defend this level, indicating healthy demand that aligns with the broader bullish trend.
The recent candles suggest the market is trying to build momentum for another test of the resistance. Wick rejections near support indicate that buyers are showing interest again. At the same time, the overall structure remains constructive, with higher highs and higher lows visible on the longer timeframe.
The Price-Volume Trend (PVT) indicator along the bottom is gradually climbing, which suggests accumulation is still happening beneath the surface. This can be a signal that a fresh breakout attempt is brewing.
Trade Setup
Here’s how the trade idea is structured visually on your chart:
• Entry Zone: Around $3,348, near the midrange and just above support.
• Stop-Loss: ~99 points below the support area (around $3,249), offering a cushion against volatility.
• Target: Approximately $3,555–$3,560, the next major resistance above the current consolidation.
• Reward Potential: ~207 points (6.19%) upside.
• Risk-Reward Ratio: ~2.09, which is a favorable setup for a trend continuation trade.
Analysis Summary
This is effectively a range-bound bullish continuation setup. The idea is to enter on support retest and ride the next impulse leg higher. Price is consolidating above the former breakout area, with clear evidence of accumulation on the PVT. If gold can close convincingly above $3,438, it will likely trigger breakout buying interest and stop-loss clusters from short sellers, which could drive price rapidly toward your target.
However, keep in mind that failure to hold above $3,249 support would invalidate the setup and could lead to a deeper correction or range breakdown. For this reason, your stop-loss level is well-placed to limit risk.

Double Top Breakdown at Resistance ZoneThe chart reveals a classic Double Top pattern formation near the 3,360–3,480 resistance zone, followed by a clear bearish rejection (highlighted with red arrows). This confirms the presence of strong supply pressure in that region.
🔍 Key Technical Highlights:
🔺 Double Top Pattern
The price formed two swing highs near the resistance zone, failing to break above.
After the second peak, the price started declining, confirming the reversal pattern.
📉 Bearish Channel
The recent downtrend is contained within a descending channel, with consistent lower highs and lower lows.
Price broke below the neckline of the double top pattern around 3,270.
🎯 Target Projection
Based on the height of the double top pattern, the projected downside target is near 3,207.5, aligning perfectly with the support zone marked below.
🟠 Historical Support Areas
The large orange circles indicate key reaction points, confirming that the 3,207–3,220 area has acted as support in the past.
📊 Outlook:
If the current bearish momentum continues, price is likely to head towards the support target zone at 3,207.5. Any pullback toward 3,320–3,350 could provide a shorting opportunity with stops above the recent highs.
🔧 Bias: Bearish
📍 Resistance: 3,360–3,480
📍 Support: 3,207–3,220
📍 Target: 3,207.5

GOLD Support Ahead
HI,Traders !
#GOLD is going down
Now but the pair will soon
Hit a horizontal support
Of 3241.70 from where
We will be expecting a
Local bullish rebound !
Comment and subscribe to help us grow !

The bull market is too fierce. How to solve the short position?📰 News information:
1. Geopolitical situation
2. PMI data
📈 Technical Analysis:
The conflict between Iran and Israel has stopped for a while, but there is a possibility of it breaking out again. There is a possibility of triggering risk aversion in the short term. From a technical perspective, the 4H MACD indicator shows a golden cross, and the moving average and other indicators are also radiating upward, with a strong bullish signal. The 1H chart Bollinger Bands open upward, and the short-term pressure position is at 3340-3345. The short-term data indicators are seriously overbought, and there may be a profit correction in the short term. Therefore, if you want to short in the short term, you can only consider the 3340-3350 range. In the short term, gold will not usher in a large retracement, and the short-term target is only suitable for looking at 3320-3310. As for the long trading point, it is expected to wait for the European and American trading hours.
🎯 Trading Points:
SELL 3340-3350
TP 3320-3310
BUY 3325-3315
TP 3335-3340-3350
In addition to investment, life also includes poetry, distant places, and Allen. Facing the market is actually facing yourself, correcting your shortcomings, confronting your mistakes, and strictly disciplining yourself. I hope my analysis can help you🌐.
TVC:GOLD OANDA:XAUUSD FOREXCOM:XAUUSD PEPPERSTONE:XAUUSD FXOPEN:XAUUSD FX:XAUUSD

XAUUSD – Correction or Reversal? 1. What happened yesterday
As expected, Gold started to rise after finding support at 3250. The move up played out perfectly, reaching the resistance area highlighted in yesterday’s analysis — around 3320–3340.
________________________________________
2. The key question today
Is this just a correction in a bearish trend, or the start of reversal?
________________________________________
3. Why I remain bearish
• On the weekly chart, structure still leans bearish
• On lower time frames, the bounce looks corrective — not impulsive
• No breakout above 3360 yet, which would be needed to shift the bias
• A move back below 3320 would likely trigger renewed selling
• If that happens, 3250 could be tested again quickly
We need to respect the bounce — but not overreact to it.
________________________________________
4. Trading plan
My bias remains bearish as long as price stays under 3360.
However, if we get a daily close above 3360, I’ll pause and re-evaluate the short bias. The market would then be signaling a potential trend shift.
________________________________________
5. Final thoughts 🚀
This is a key moment for gold. We’re at resistance zone but not broken above yet.
Until proven otherwise, the trend remains down — and rallies into 3340 zone should be considered selling opportunities.
Disclosure: I am part of TradeNation's Influencer program and receive a monthly fee for using their TradingView charts in my analyses and educational articles.
Below of last update of reverse head and shoulder post XAU/USD | 30min | by Mohsen Mozafari Nejad
🔸 **Instrument:** Gold / USD (XAU/USD)
🔸 **Timeframe:** 30min
🔸 **Methodology:** Smart Money Concepts (SMC) + Liquidity + OB + Market Structure
🔸 **Focus:** New Monthly Open Setup
🔍 Market Context:
---
## 🧠 Technical Breakdown:
1. **Strong recovery** after clearing deep liquidity sweep (Head zone)
2. **Bullish BOS** structure confirmed on LTF → Multiple HH and HL formed
3. Price now testing **Key Supply/OB zone at 3300–3315**
4. Above this zone lies a **Strong High (SH) around 3,350**, a potential liquidity magnet
5. Overall bias is bullish unless strong rejection appears from upper OB
---
## 📌 Trade Plan:
| Position | Entry Confirmation Zone | Stop Loss (SL) | Take Profit (TP) |
|----------|--------------------------|----------------|------------------|
|
| Short (scalp only) | Bearish reaction from 3,345–3,350 | Above 3,353 | TP1: 3,310 / TP2: 3,290 |
---
## ⚠️ Risk Factors to Watch:
- 🔺 High-impact USD news (July 1st releases: Manufacturing PMI / employment preview)
- 🔺 Overextension above supply zone without support → trap risk
- 🔺 Bull trap risk if price spikes above 3,340 then sharply reverses
---
## ✅ Summary:
> **Start of July** could fuel volatility and directional momentum.
> The structure is clearly bullish short-term, but upper liquidity zones remain **highly reactive**.
> Smart traders will wait for reaction at the 3,340–3,350 SH zone before overcommitting.
**Structure:** 🔴 bearish momentum
**Efficiency:** ✅ Clean
**Liquidity:** 🔺 Above SH & Below recent HL
📊 Prepared by: **Mohsen Mozafari Nejad**
