Gold Short Term OutlookYesterday, we noted that gold was attempting a recovery from the Support Zone but remained below both the 50 and 200 MAs, meaning bearish pressure was still intact.
Since then, price has broken and held above $3,298, and is now trading around $3,330, just beneath the 200MA.
This marks a shift in short-term momentum — gold has reclaimed the 50MA and is now challenging the 200MA.
If bulls manage to break and hold above the $3,327 resistance, it could open the path toward $3,352 - $3,364 and potentially higher resistance zones.
However, if price rejects the 200MA and fails to hold above $3,327, we may see a pullback toward $3,298 or deeper into $3,270, where bulls could look to reload.
📌 Key Levels to Watch:
Resistance:
$3,327 • $3,364 • $3,383 • $3,400
Support:
$3,298 • $3,270 • $3,241
🧠 Fundamental Focus:
📌 Fed Chair Powell speaks today at the ECB Forum in Portugal.
Markets will closely watch for any shift in tone on inflation or rate outlook. His comments may influence USD direction and gold volatility.
📌 ISM Manufacturing PMI – a key gauge of economic activity. A strong print may pressure gold; a weak reading could support it.
📌 JOLTS Job Openings – offers insight into labor market strength. A tighter market could delay rate cuts and weigh on gold.
With multiple risk events packed into today, expect increased volatility across the board.
Xauusdupdates

7/1 Gold Analysis and PMI Data Trading StrategyGood afternoon, everyone!
Gold has now entered a resistance zone, and on the 30-minute chart, a technical correction appears likely. This correction typically takes one of two forms:
A direct pullback from current levels;
A minor upward push before the pullback, intensifying the need for correction.
In most cases, the second scenario doesn’t result in a large move—unless it’s accompanied by strong news. Given this setup, today’s trading idea is to:
Start with a small short position near current resistance;
Add to the position if price pushes slightly higher, and patiently wait for a pullback. This strategy has shown over 80% historical success rate.
Key support levels to watch:
If the price rises before pulling back: 3321–3316
If the price drops directly: 3313–3306
On the 4-hour chart, the rebound is not yet complete, so if the pullback finds solid support, there’s still room for buy-side setups in line with the short-term trend.
⚠️ Important: U.S. PMI data will be released during the New York session. Strategy depends on pre-release price positioning:
If price remains below 3312, and the data is bullish → look for long setups.
If price is above 3323, wait for a post-data rally to sell into.
If the data is bearish → consider selling immediately.
Stay flexible, manage your positions wisely, and trade with discipline ahead of the U.S. session.

The latest analysis and layout of gold in July made a good start📰 News information:
1. Geopolitical situation
2. PMI data
📈 Technical Analysis:
Yesterday, we gave the idea of looking at the upper resistance of 3310-3320. The 4H pressure is still at 3327. As long as this key resistance level is not effectively broken, gold will fall again. On the contrary, if it stabilizes above 3327, the trend may reverse. In the short term, pay attention to the upper resistance of 3327. If it is not broken, you can short with a light position. If it falls below 3300-3290, consider going long.
🎯 Trading Points:
SELL 3310-3320
TP 3305-3300
BUY 3300-3290
TP 3310-3320-3350
In addition to investment, life also includes poetry, distant places, and Allen. Facing the market is actually facing yourself, correcting your shortcomings, confronting your mistakes, and strictly disciplining yourself. I hope my analysis can help you🌐.
TVC:GOLD FXOPEN:XAUUSD PEPPERSTONE:XAUUSD FOREXCOM:XAUUSD OANDA:XAUUSD TVC:GOLD

The limit is 3320. Rebound and still short📰 News information:
1. Gold market liquidity at the end of the month
2. Impact of geopolitical situation
📈 Technical Analysis:
Currently, gold has rebounded to around 3295, reaching our ideal trading area. I have given the short-selling trading idea in the previous post. At present, in the short term, we still maintain the short-selling trading idea before effectively breaking through the upper resistance. Focus on the 3325 line of resistance
🎯 Trading Points:
SELL 3295-3310-3320
TP 3285-3270
In addition to investment, life also includes poetry, distant places, and Allen. Facing the market is actually facing yourself, correcting your shortcomings, confronting your mistakes, and strictly disciplining yourself. I hope my analysis can help you🌐.
OANDA:XAUUSD FOREXCOM:XAUUSD FX:XAUUSD PEPPERSTONE:XAUUSD FXOPEN:XAUUSD TVC:GOLD

Exclusive operation suggestions for future market trends!!!Gold bottomed out and rebounded on Monday, so wait patiently for room for future gains. Technically, from the current hourly chart, the gold entity has always been above 3278, and it only pierced through 3275 and then began to rebound. If the retracement does not break the 618 position, there will inevitably be a high point in the future. So next, we should focus on the vicinity of 3280. If gold always closes above 3280, then the high point of 3297 on Monday is likely to be refreshed. Secondly, from the perspective of 123 seeking 4, if it goes up again, it is very likely to touch around 3310. 3310 is exactly around 618. And it is also the top position of this hourly chart range. Therefore, gold should be shorted above 3280 with caution, and the probability of touching above 3300 is very high. In terms of operation, it is recommended to directly enter the market to go long near 3280, and look at 3310-3320. If you want to short, you must wait at least for 3310-3320 before you can enter the market to short once.

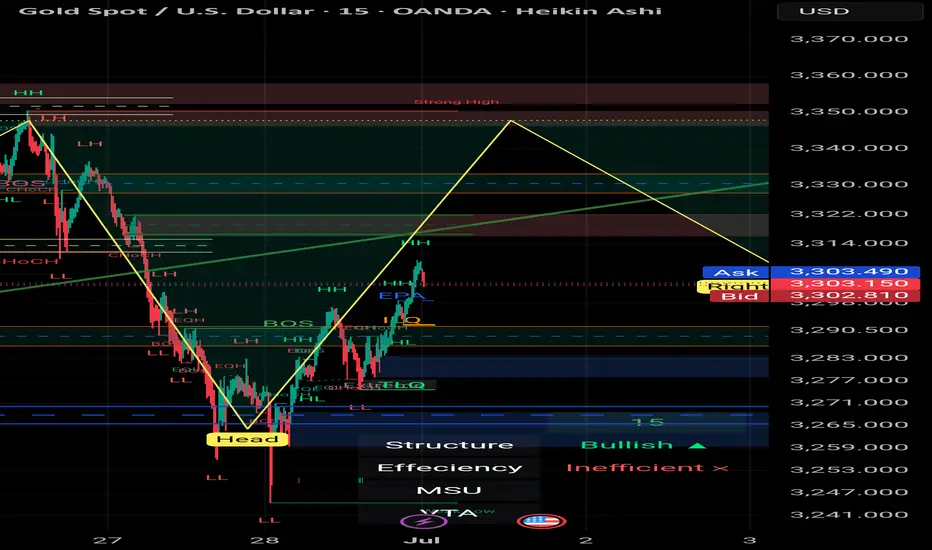
Gold Market Outlook – 1st of July | XAU/USD | 30min | by Mohsen # Gold Market Outlook – 1st of July | XAU/USD | 30min | by Mohsen Mozafari Nejad
🔸 **Instrument:** Gold Spot / USD (XAU/USD)
🔸 **Timeframe:** 30min
🔸 **Methodology:** Smart Money Concepts (SMC) + Liquidity + OB + Market Structure
🔸 **Focus:** New Monthly Open Setup
---
## 🔍 Market Context:
- **Structure:** Bullish on LTF (MSU)
- **Efficiency:** ✅ Clean & Efficient Delivery
- **Recent Activity:** Reverse H&S completed + double BOS + CHoCH confirmed
- **Price Level:** Trading near key Supply zone (3300–3315)
- **Monthly Context:** July begins with bullish momentum & previous session showed aggressive buy-side pressure
---
## 🧠 Technical Breakdown:
1. **Strong recovery** after clearing deep liquidity sweep (Head zone)
2. **Bullish BOS** structure confirmed on LTF → Multiple HH and HL formed
3. Price now testing **Key Supply/OB zone at 3300–3315**
4. Above this zone lies a **Strong High (SH) around 3,350**, a potential liquidity magnet
5. Overall bias is bullish unless strong rejection appears from upper OB
---
## 📌 Trade Plan:
| Position | Entry Confirmation Zone | Stop Loss (SL) | Take Profit (TP) |
|----------|--------------------------|----------------|------------------|
| Long | Above 3,303–3,310 (structure hold) | Below 3,294 | TP1: 3,325 / TP2: 3,340 / TP3: 3,348 |
| Short (scalp only) | Bearish reaction from 3,345–3,350 | Above 3,353 | TP1: 3,310 / TP2: 3,290 |
---
## ⚠️ Risk Factors to Watch:
- 🔺 High-impact USD news (July 1st releases: Manufacturing PMI / employment preview)
- 🔺 Overextension above supply zone without support → trap risk
- 🔺 Bull trap risk if price spikes above 3,340 then sharply reverses
---
## ✅ Summary:
> **Start of July** could fuel volatility and directional momentum.
> The structure is clearly bullish short-term, but upper liquidity zones remain **highly reactive**.
> Smart traders will wait for reaction at the 3,340–3,350 SH zone before overcommitting.
**Structure:** 🟢 Bullish
**Trend:** 📈 MSU
**Efficiency:** ✅ Clean
**Liquidity:** 🔺 Above SH & Below recent HL
---
📊 Prepared by: **Mohsen Mozafari Nejad**
Go long on dips and short on rallies📰 News information:
1. Gold market liquidity at the end of the month
2. Impact of geopolitical situation
📈 Technical Analysis:
Last week we predicted that gold would rebound. Today, after gold rebounded as expected, we gave a short trading strategy. Gold fell precisely at the point we gave, 3295, and successfully hit our TP3280-3270. The result confirmed the correctness of our trading strategy. Next, we will focus on the long trading opportunities below 3270-3260.
🎯 Trading Points:
BUY 3270-3260
TP 3290-3300
SELL 3295-3300-3310
TP 3280-3270
In addition to investment, life also includes poetry, distant places, and Allen. Facing the market is actually facing yourself, correcting your shortcomings, confronting your mistakes, and strictly disciplining yourself. I hope my analysis can help you🌐.
TVC:GOLD FXOPEN:XAUUSD PEPPERSTONE:XAUUSD FX:XAUUSD FOREXCOM:XAUUSD OANDA:XAUUSD

Gold Is Set to Bottom Out and Rebound This WeekGood morning, everyone!
At today’s open, gold once again dipped into the 3258–3248 buy zone, then rebounded toward 3270. From a structural perspective, gold has clearly entered a downward trend, but this decline is unlikely to be one-directional—short-term rebounds and consolidations are expected along the way.
Based on my experience, below 3250 remains a favorable area for initiating long positions. Whether the price rebounds directly or continues lower before building a stronger base to challenge 3300 again, the broader outlook remains bullish as long as the 3200 support holds. A bottoming reversal this week is still the more probable scenario.
As such, the focus early this week should be on buying near the lows, with short opportunities on rebounds as a secondary strategy. Monitor key support levels for signs of strength.
This week is also packed with important data—including PMI, Non-Farm Payrolls (NFP), and the unemployment rate, in addition to regular economic releases. Given the current macroeconomic backdrop, significant market volatility is expected—bringing both risk and opportunity. Manage your exposure carefully and stay adaptable.

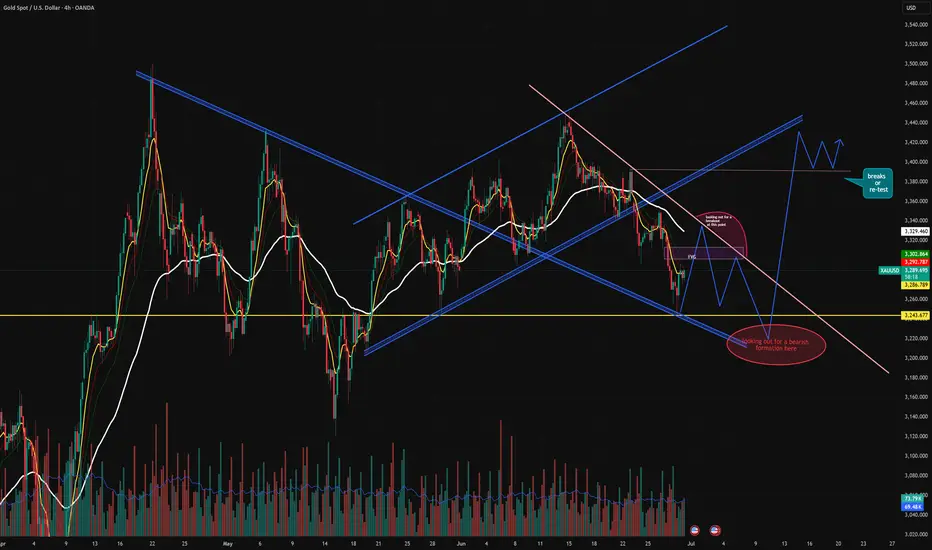
XAUUSD 4H Analysis:= Key Levels, FVG Reaction & Structure projec🔔 XAUUSD 4H Analysis – Key Levels, FVG Reaction & Structure Projections
Gold is currently trading within a complex structure after breaking down from a rising parallel channel and is now testing confluence zones that could dictate the next major move.
📈 Scenarios:
🔺 Bullish Path: Clean breakout and retest above the FVG zone and descending trendline → price could re-enter the previous rising channel targeting 3,400+.
🔻 Bearish Path: Rejection from the FVG & trendline → look for lower highs to form → continuation toward 3,243 key support and possibly beyond.
If support breaks below $3,246, the next level of interest lies near $3,200 psychological round number.
📌 Conclusion:
We’re in a decision zone. The next move depends on how price behaves around the FVG and trendline resistance. Patience and confirmation will be key — breakout traders and mean reversion traders both have defined setups ahead.
#this is not a buy sell advice.
#just a view
#apologies and credit if someone has already seen and posted this.
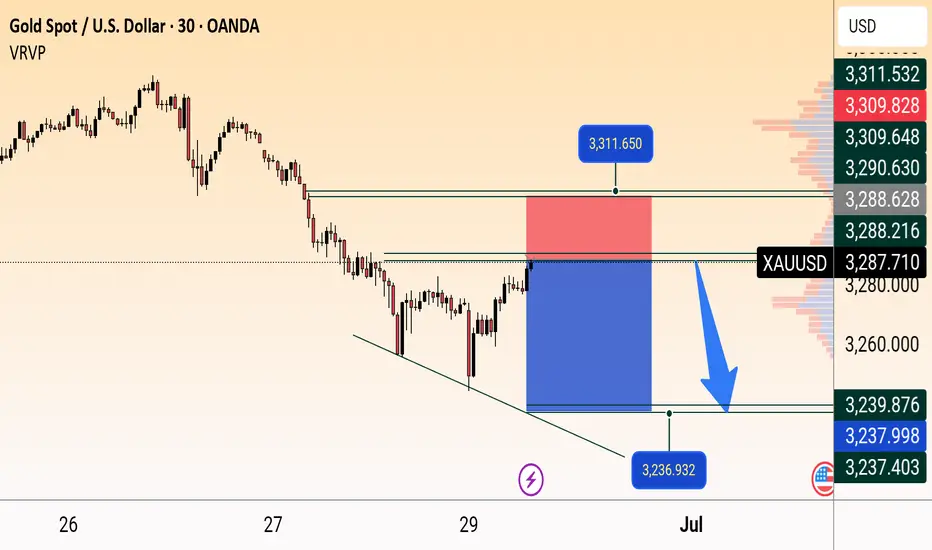
XAU/USD Bearish Rejection Setup Below Resistance ZoneXAU/USD (Gold) is forming a bearish setup on the 30-minute chart. Price is testing a resistance near 3288, with a potential reversal towards the 3236 level. Entry is marked around current price, with a stop loss at 3311 and take profit near 3237, supported by a descending channel.
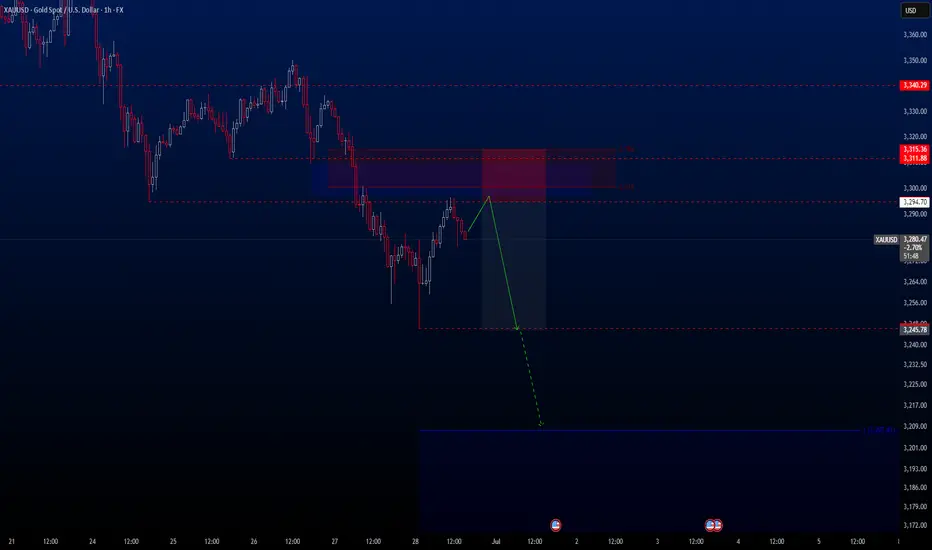
XAUUSD Hello traders. There’s currently a great opportunity for a potential short setup on the XAUUSD pair. We just need a bit of patience. For that reason, this trade will be placed as a Sell Limit.
In the coming days, I expect a moderate pullback in gold. Meanwhile, the S&P 500 has reached a new all-time high, which is quite notable. If the index begins to correct from these levels, we could potentially see a strong rally in gold. Of course, this is just my personal opinion based on current market dynamics.
🔍 Trade Details
✔️ Timeframe: 1-Hour (H1)
✔️ Risk-to-Reward Ratio: 1:3.20
✔️ Trade Direction: Sell Limit
✔️ Entry Price: 3294.70
✔️ Take Profit Targets: 3245.78 / 3207.00 / 3154.00
✔️ Stop Loss: 3315.36
🕒 If momentum weakens or price consolidates in a tight range, I will keep this trade open only until 23:00 (UTC+4). After that, I’ll manually close it—whether in profit or loss—based on how price action evolves.
🔔 Disclaimer: This is not financial advice. I’m simply sharing a trade I’ve taken based on my personal trading system, strictly for educational and illustrative purposes.
📌 Interested in a systematic, data-driven trading approach?
💡 Follow the page and turn on notifications to stay updated on future trade setups and advanced market insights.
XAU/USD Chart Analysis: Price Retreats to Monthly LowXAU/USD Chart Analysis: Price Retreats to Monthly Low
In mid-June 2025, demand for gold surged following reports of exchanged strikes between Israel and Iran, along with US bombings of Iran's nuclear facilities. As a so-called safe-haven asset, gold prices climbed towards $3,430.
However, by the final day of June, the XAU/USD chart shows that gold had retreated to around $3,250, marking the lowest level in a month.
Why Is the Gold Price Falling?
On one hand, this reflects easing tensions in the Middle East, as a ceasefire—albeit fragile—between Israel and Iran remains in place.
On the other hand, the risk of trade wars is also diminishing. According to media reports:
→ President Donald Trump announced last week that the United States had signed a trade agreement with China and hinted that a “very major” deal with India would follow soon.
→ The US is also close to concluding agreements with Mexico and Vietnam, while negotiations with Japan and many other countries are ongoing.
Technical Analysis of the XAU/USD Chart
Looking at the broader picture, it is worth noting that gold prices in 2025 continue to move within a long-term upward channel (shown in blue), with the following key observations:
→ The channel’s median line acted as resistance (indicated by arrow 1);
→ The line dividing the lower half of the channel in half also showed signs of resistance (indicated by arrow 2).
Now, gold is trading near the lower boundary of the channel – a key support level within the multi-month uptrend. Demand may begin to strengthen here, with long lower wicks on candles on the lower timeframes supporting this view.
A rebound from the lower boundary is possible in early July, but how strong might it be? Note that bears have taken control of the $3,345 level (which has now flipped from support to resistance), and there are signs of a triple top pattern (A-B-C) forming near the $3,430 resistance. This raises the risk of a bearish breakout from the ascending channel.
This article represents the opinion of the Companies operating under the FXOpen brand only. It is not to be construed as an offer, solicitation, or recommendation with respect to products and services provided by the Companies operating under the FXOpen brand, nor is it to be considered financial advice.

Market Analysis: Gold Drops — Traders Eye Macro TriggersMarket Analysis: Gold Drops — Traders Eye Macro Triggers
Gold price started a fresh decline below $3,320.
Important Takeaways for Gold Oil Price Analysis Today
- Gold price climbed higher toward the $3,400 zone before there was a sharp decline against the US Dollar.
- A key bearish trend line is forming with resistance near $3,300 on the hourly chart of gold at FXOpen.
Technical Analysis of Gold Price
On the hourly chart of Gold at FXOpen, the price climbed above the $3,320 resistance. The price even spiked above $3,350 before the bears appeared.
A high was formed near $3,395 before there was a fresh decline. There was a move below the $3,350 support level. The bears even pushed the price below the $3,300 support and the 50-hour simple moving average.
It tested the $3,245 zone. A low is formed near $3,247 and the price is now showing bearish signs. There was a minor recovery wave toward the 23.6% Fib retracement level of the downward move from the $3,393 swing high to the $3,247 low.
However, the bears are active below $3,300. Immediate resistance is near $3,280. The next major resistance is near the $3,300 zone. There is also a key bearish trend line forming with resistance near $3,300.
The main resistance could be $3,320 or the 50% Fib retracement level, above which the price could test the $3,350 resistance. The next major resistance is $3,395.
An upside break above the $3,395 resistance could send Gold price toward $3,420. Any more gains may perhaps set the pace for an increase toward the $3,450 level.
Initial support on the downside is near the $3,245 level. The first major support is near the $3,220 level. If there is a downside break below the $3,220 support, the price might decline further. In the stated case, the price might drop toward the $3,200 support.
This article represents the opinion of the Companies operating under the FXOpen brand only. It is not to be construed as an offer, solicitation, or recommendation with respect to products and services provided by the Companies operating under the FXOpen brand, nor is it to be considered financial advice.

Analysis and layout of gold trend at the end of the month📰 News information:
1. Gold market liquidity at the end of the month
2. Impact of geopolitical situation
📈 Technical Analysis:
From the beginning of the decline of gold near 3338 on Friday to today's lowest point near 3244, gold has fallen by nearly $94. At present, gold has rebounded as expected. In the short term, I think we have two key areas to pay attention to. The first is the position of 3290-3295, which is a 50% rebound, and the second is the upper top range limit range of 3300-3320. Of course, if it breaks through 3280 and then retreats, it can also be long twice, but the current price rebounds, considering the position of the temporary low long position, there is not much trading opportunity. First look at the key areas given to find opportunities for shorting, and pay attention to the opportunity of retreating to 3280-3270 below.
🎯 Trading Points:
SELL 3290-3295
TP 3380-3370
SELL 3300-3310-3320
TP 3290-3280-3270
BUY 3270-3260
TP 3290-3300
In addition to investment, life also includes poetry, distant places, and Allen. Facing the market is actually facing yourself, correcting your shortcomings, confronting your mistakes, and strictly disciplining yourself. I hope my analysis can help you🌐.
OANDA:XAUUSD FOREXCOM:XAUUSD FX:XAUUSD PEPPERSTONE:XAUUSD FXOPEN:XAUUSD TVC:GOLD

GOLD H2 Intraday Chart update for 30 June 2025Hello Traders,
As you can see that there are some solid in the market since morning, right now market is sustains below 3300 Psychological Level and move towards 3270-75 key support zone and then at 3350
Monthly candlestick closing also due today
only if market breaks 3305 successfully today then GOLD will move towards 3335
Disclaimer: Forex is Risky

XAUUSD Under Pressure: What the Market Is Telling UsGold (XAUUSD) is currently trading with a clear bearish bias, showing sustained downside momentum on the 4H timeframe 🕒. Price has been gradually stepping lower, and the structure continues to favor the sellers.
As expected for early in the week, there’s been a bit of choppy movement ⚖️, but the overall sentiment remains weak. Unless we see a strong shift or catalyst, I’ll be maintaining a bearish outlook.
🧭 I’m watching for price to revisit key resistance levels, and if we get a clean break and retest 🔄, I’ll be looking for potential short setups from areas of previous demand that flip into resistance.
🌐 Keep an eye on broader risk sentiment — if NASDAQ starts pulling back or DXY strengthens, it could fuel further downside in gold.
As always, this is not financial advice, but the detailed breakdown is available in the latest video 🎥.

XAUUSD is holding falling pattern H4 Timeframe Analysis
Gold is currently holding the falling wedge pattern on H1 & H4 and Market has to lift up at range of 3330-3320 for completion of Leg then drop.
What's possible scanarios we have?
BULLISH SCANARIO:
As we have seen h4 candle closes above 3280-3285 and we have margin towards 3320 but how we achieved it ? If the H1-H4 candle closes above 3305 then our targets we'll be 3330.
BEARISH SCANARIO: (PREFERRED)
On the otherhand if The H4 candle closes below 3280-3275 then buying will be limited and market will join the 3250 then 3230-3320. Most appropriate Sell will be at 3320-3330 zone for implusive move also we have Weekly structural Resistance at 3330-3350 piviot point.

XAU/USD 30 June 2025 Intraday AnalysisH4 Analysis:
-> Swing: Bullish.
-> Internal: Bullish.
You will note that price has targeted weak internal high on two separate occasions forming a double top which is a bearish reversal pattern. This is in-line with HTF bearish pullback phase.
Remainder of analysis and bias remains the same as analysis dated 23 April 2025.
Price has now printed a bearish CHoCH according to my analysis yesterday.
Price is now trading within an established internal range.
Intraday Expectation:
Price to trade down to either discount of internal 50% EQ, or H4 demand zone before targeting weak internal high priced at 3,500.200.
Note:
The Federal Reserve’s sustained dovish stance, coupled with ongoing geopolitical uncertainties, is likely to prolong heightened volatility in the gold market. Given this elevated risk environment, traders should exercise caution and recalibrate risk management strategies to navigate potential price fluctuations effectively.
Additionally, gold pricing remains sensitive to broader macroeconomic developments, including policy decisions under President Trump. Shifts in geopolitical strategy and economic directives could further amplify uncertainty, contributing to market repricing dynamics.
H4 Chart:
M15 Analysis:
-> Swing: Bullish.
-> Internal: Bullish.
On H4 TF price has been failing to target weak internal high, therefore, it would not be unrealistic if price printed a bearish iBOS.
The remainder of my analysis shall remain the same as analysis dated 13 June 2025, apart from target price.
As per my analysis dated 22 May 2025 whereby I mentioned price can be seen to be reacting at discount of 50% EQ on H4 timeframe, therefore, it is a viable alternative that price could potentially print a bullish iBOS on M15 timeframe despite internal structure being bearish.
Price has printed a bullish iBOS followed by a bearish CHoCH, which indicates, but does not confirm, bearish pullback phase initiation. I will however continue to monitor, with respect to depth of pullback.
Intraday Expectation:
Price to continue bearish, react at either M15 supply zone, or discount of 50% internal EQ before targeting weak internal high priced at 3,451.375.
Note:
Gold remains highly volatile amid the Federal Reserve's continued dovish stance, persistent and escalating geopolitical uncertainties. Traders should implement robust risk management strategies and remain vigilant, as price swings may become more pronounced in this elevated volatility environment.
Additionally, President Trump’s recent tariff announcements are expected to further amplify market turbulence, potentially triggering sharp price fluctuations and whipsaws.
M15 Chart:

Gold Short To Medium Term OutlookGold bounced from the lower Support Zone after briefly breaching $3,270. Price is now attempting a recovery, currently trading near $3,290, but remains below both the 50 EMA and 200 EMA — confirming bearish pressure is still intact.
For bulls to gain momentum, we need to see a clean break and hold above $3,298–$3,327which would open the path toward $3,352 and possibly higher resistance levels like $3,364 and $3,383.
Until then, this move may simply be a short-term pullback within a broader downtrend. If price fails to reclaim $3,327, watch for a drop back toward $3,270, with a deeper correction targeting the $3,241–$3,211 zone.
📌 Key Levels to Watch:
Resistance:
$3,298 • $3,327 • $3,352 • $3,364 • $3,383
Support:
$3,270 • $3,241 • $3,211 • $3,179
🧠 Fundamental Focus:
This week is packed with high-impact events — including Non-Farm Payrolls on Thursday. These could trigger sharp moves in gold, so stay cautious and manage risk wisely.

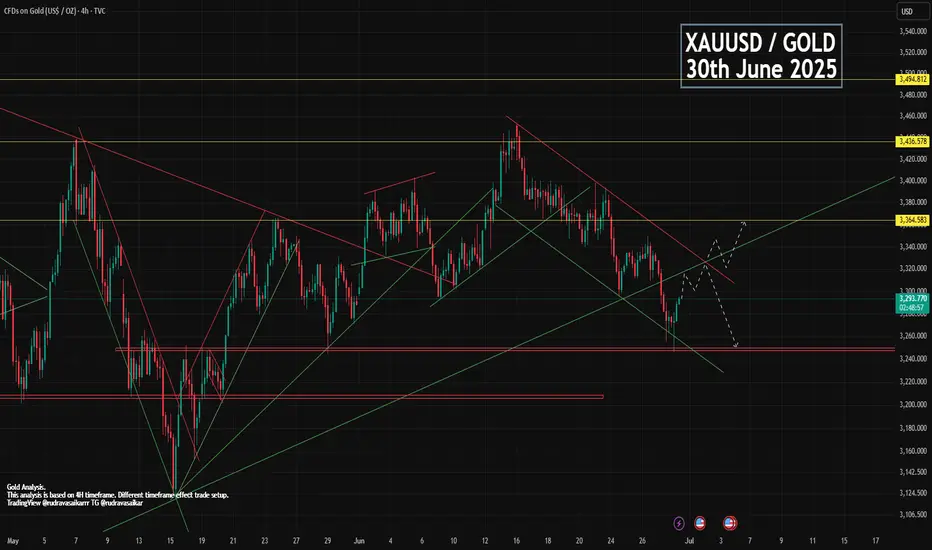
GOLD 30th JUNE - MONTH-END BULLISH OR BEARISHDue to war no update on gold, gold made bolt move downward. Slowly war has been becoming calm but no good news about it has been stopped completely. But you can see some great and correct structure in gold chart where you can find amazing entry and exit points. Gold lower was 1246 since then. Now gold is trading in bullish flag and expecting to breakout. And after breakout we can expect a big move upward.
Key point.
Support - 3248, 3272, 3289
Resistance - 3298, 3313, 3332, 3349
Comment and like for analysis. Love it then follow
Any Query Reach Us or comment down.
Follow for more updates.
Rudra Vasaikar Wishes You A Great And Very Amazing Trading Life. Trade Safe, Trade Right.
RISK WARNING 🔴 🔴 🔴
There is high risk of loss in Trading Forex, Crypto, Indices, CFDs, Features and Stocks. Choose your trade wisely and confidently, please see if such trading is appropriate for you or not. Past performance is not indicative of future results. Highly recommended - Information provided by Rudra Vasaikar/Pro Trading Point are for Educational purpose only. Do your investment according to your own risk. Any type of loss is not our responsibility.
HAPPY TRADING.
Elliott Wave Analysis – XAUUSD Trading Plan for June 30, 2025
🌀 Elliott Wave Structure
On the H1 chart, we observe a double zigzag correction WXY (in red). Currently, Wave Y appears to be developing as a green abc structure.
In this abc structure:
+ Wave a started with a leading diagonal (5-wave triangle).
+ Wave b followed as a typical abc correction (in black).
+ Wave c is currently unfolding as a clear 5-wave impulsive move, characterized by sharp and rapid price action.
The key issue now is to determine whether:
+ The price has completed wave 5 (black), or
+ It has only completed wave 3 (black) within the green wave c.
If the current movement is wave 3 (black), we should expect a wave 4 correction, followed by one more leg down to complete wave 5. In this scenario, wave 5 will be confirmed if the price breaks below 3255. There are two potential target zones for wave 5:
+ Zone 1: 3247
+ Zone 2: 3224
If wave 5 has already completed, the upward move to 3283 could be wave 1 of a new bullish trend. The next pullback would be wave 2, with an expected target between 3266 – 3261.
⚡️ Momentum Analysis
D1 timeframe: Momentum is in the oversold region, suggesting a high probability of a bullish trend in the upcoming week. This supports the view that wave c (green) of wave Y (red) is nearing completion.
H4 timeframe: Momentum is turning bullish, indicating the current upward movement may continue. This adds to the uncertainty about whether wave 3 or wave 5 has ended.
🧭 Trading Plan
📍 BUY ZONE 1
Entry: 3264 – 3261
SL: 3254
TP1: 3283 | TP2: 3297 | TP3: 3315
📍 BUY ZONE 2
Entry: 3247 – 3244
SL: 3237
TP1: 3283 | TP2: 3297 | TP3: 3315
⚠️ Important Note
This trading plan assumes either wave 3 or wave 5 has completed. Therefore, if in the early Asian session, the price does not touch the 3264 – 3261 zone but instead rises above 3283 without closing above 3297, and then drops back below 3283, we should avoid buying at 3264 – 3261.
Instead, we should wait for a potential entry at the 3247 – 3244 zone.

Gold Rebounds from 3250 – But Bears Still in Control1. What happened last week
As you know, I’ve been bearish on Gold all last week long. Even though the geopolitical situation in the Middle East escalated over the weekend, the fact that price couldn’t reclaim the 3400 resistance was a major red flag.
It showed us that the bullish sentiment was fragile, and that downside pressure is just around the corner.
And indeed — Gold sold off. The weekly close below the 3300 level confirmed the weakness.
2. The key question now
Has Gold found a bottom at 3250, or is this just a temporary rebound before another leg down?
3. Why I expect a continuation lower
- The weekly close was under 3300, breaking key support
- 3250 is being tested again — a level touched multiple times since the mid-April ATH
- The current rebound looks corrective, not impulsive
- Resistance levels at 3320 and 3340 are likely to hold as ceilings
- No major catalyst yet to justify a reversal
- This looks like a classic “sell the rally” setup in a weakening trend.
4. Trading plan
The idea is simple: sell the spikes.
If price bounces into 3320–3340, I will look to short again, anticipating a renewed test of the 3250 support zone.
If 3250 breaks — we could see acceleration toward 3200 or lower.
5. Final thoughts 🚀
No need to complicate things. Gold remains vulnerable unless it clears 3340. Until then, the trend is your friend — and that trend points down.
Disclosure: I am part of TradeNation's Influencer program and receive a monthly fee for using their TradingView charts in my analyses and educational articles.

Gold Price Forecast: Bulls Defend Key Support, Eyes on TrendlineTVC:GOLD Gold (XAU/USD) bounced from the $3,261 support zone after briefly dipping to a one-month low around $3,265 in early Asian trade. The rebound came as buyers stepped in at a major demand area, rejecting further downside and suggesting bullish intent.
Macro drivers include reduced safe-haven demand following the US-China trade agreement on rare earths and a temporary ceasefire between Israel and Iran. However, expectations of a Fed rate cut—especially after weaker US consumer spending data—could limit further losses.
Technically, OANDA:XAUUSD gold has formed a double bottom around $3,261, and price action now threatens to break above a descending trendline (TL1). A confirmed breakout above minor resistance at $3,283 may open the door toward $3,311 and potentially the upper trendline near $3,330.
Key Levels to Watch:
Support: $3,261 (defended), $3,250 (monthly low)
Resistance: $3,283 (minor), $3,311 (former support turned resistance), $3,330 (TL2 trendline)
📉 Trendlines: TL1 and TL2 still capping upside; breakout would confirm bullish shift
If bulls can maintain control above $3,283 and push through the trendline, a broader recovery could follow. However, failure to clear this zone may invite renewed selling pressure.
⚠️ Disclaimer: This analysis is for informational purposes only and does not constitute investment advice.
