Can the price of gold continue to rise?Gold trend analysis:
Gold has not fallen in the past two days, and there are signs of bottoming out in the short term. Since the daily line bottomed out and pulled up, the daily line closed positive yesterday, and the bulls began to counterattack, and the low point of the one-hour line was rising. We also said in last night’s blog that the key point below the market outlook is at 3295. If it cannot fall in the short term, it is likely to bottom out and rebound. The upper pressure is at the Bollinger middle track 3355. If it breaks and stabilizes at this price, gold will have a larger upward space, and the upper side will look at 3385.
In the 4-hour chart, the stochastic indicator temporarily forms a golden cross, which is a bullish signal; however, the BOLL track suppression is still there, which is also the pressure position of 3345-3347; the gold 1-hour moving average is still a dead cross downward short arrangement, and the gold shorts still have momentum. The key position of gold in the short term is still at 3340. Although gold seems to have a strong rebound in the early trading, it is still under pressure and began to fall back from 3340. There is no effective breakthrough. Therefore, before gold effectively breaks through 3340, it will continue to maintain a high-altitude thinking. Only after gold breaks through and stands firmly at 3340, will the gold bulls usher in a turnaround. Pay attention to the support near 3312, the low point of yesterday's US market decline. The upper resistance is 3355.
Gold operation strategy: short gold near 3350 when it rebounds, defend 3360, and target 3330-3320; long gold falls back to 3320, stop loss 3312, target 3340-3350;
Xauusdupdates

gold on bearish retest#XAUUSD price have retrace back 3350.2 which is retesting back below day low.
Below 3336 holds short sell which target 3330-3317, but main entry for selling 3330, SL 3346.
Breakout above 3350.2 holds strong buy which will reach 3366 for bearish reversal.

The Fed's rate cut cannot stop the decline in gold pricesThe 4-hour technical pattern is repaired, the short-term moving average diverges upward, and the K-line stands firm on the moving average support and fluctuates upward. In the short term, pay attention to the breakthrough of the 3350 pressure level and the confirmation of the European and American market retracement. The daily price stabilizes at the 3300 support level, and the downward momentum is weakened. The overall pattern of fluctuations is maintained. Be vigilant about the short-term adjustment risk after continuous highs. In terms of operation, it is recommended to arrange short orders in batches in the 3347-3352 area, and strictly stop loss and take profit.


XAU/USD 26 June 2025 Intraday AnalysisH4 Analysis:
-> Swing: Bullish.
-> Internal: Bullish.
Analysis and bias remains the same as analysis dated 23 April 2025
Price has now printed a bearish CHoCH according to my analysis yesterday.
Price is now trading within an established internal range.
Intraday Expectation:
Price to trade down to either discount of internal 50% EQ, or H4 demand zone before targeting weak internal high priced at 3,500.200.
Note:
The Federal Reserve’s sustained dovish stance, coupled with ongoing geopolitical uncertainties, is likely to prolong heightened volatility in the gold market. Given this elevated risk environment, traders should exercise caution and recalibrate risk management strategies to navigate potential price fluctuations effectively.
Additionally, gold pricing remains sensitive to broader macroeconomic developments, including policy decisions under President Trump. Shifts in geopolitical strategy and economic directives could further amplify uncertainty, contributing to market repricing dynamics.
H4 Chart:
M15 Analysis:
-> Swing: Bullish.
-> Internal: Bullish.
Following previous high, and printing of bearish CHoCH, price has pulled back to an M15 supply zone, where we are currently seeing a reaction. Therefore, I shall now confirm internal high.
Price is now trading within an established internal range.
The remainder of my analysis shall remain the same as analysis dated 13 June 2025, apart from target price.
As per my analysis dated 22 May 2025 whereby I mentioned price can be seen to be reacting at discount of 50% EQ on H4 timeframe, therefore, it is a viable alternative that price could potentially print a bullish iBOS on M15 timeframe despite internal structure being bearish.
Price has printed a bullish iBOS followed by a bearish CHoCH, which indicates, but does not confirm, bearish pullback phase initiation. I will however continue to monitor, with respect to depth of pullback.
Intraday Expectation:
Price to continue bearish, react at either M15 supply zone, or discount of 50% internal EQ before targeting weak internal high priced at 3,451.375.
Note:
Gold remains highly volatile amid the Federal Reserve's continued dovish stance, persistent and escalating geopolitical uncertainties. Traders should implement robust risk management strategies and remain vigilant, as price swings may become more pronounced in this elevated volatility environment.
Additionally, President Trump’s recent tariff announcements are expected to further amplify market turbulence, potentially triggering sharp price fluctuations and whipsaws.
M15 Chart:

XAUUSD and GBPJPY Analysis todayHello traders, this is a complete multiple timeframe analysis of this pair. We see could find significant trading opportunities as per analysis upon price action confirmation we may take this trade. Smash the like button if you find value in this analysis and drop a comment if you have any questions or let me know which pair to cover in my next analysis.

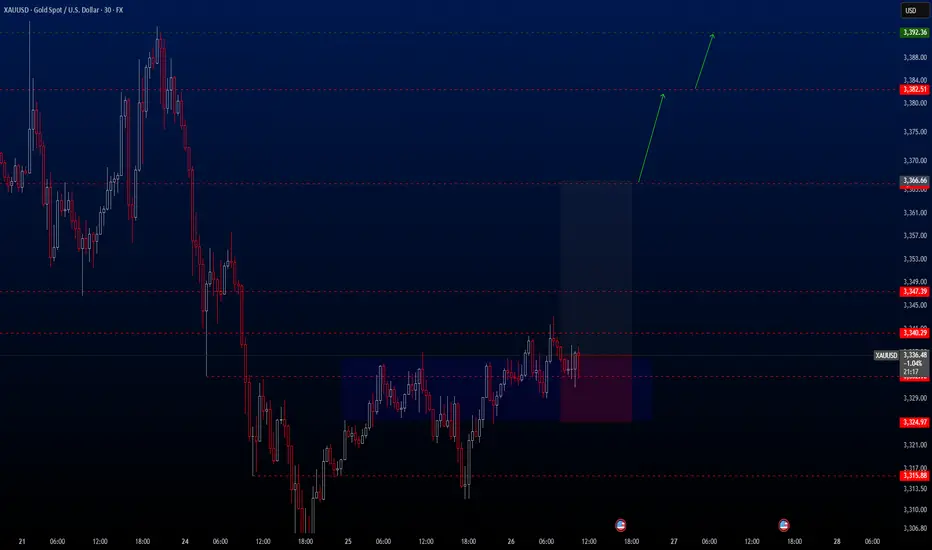
XAUUSD Hello traders.
Today’s first trade setup comes from the XAUUSD pair. The pair is currently positioned in an ideal buy zone, and I’ve spotted a potential long opportunity. There are three different take profit levels, all of which are listed below. Personally, I’ll be closing my position at the first TP level: 3366.66.
However, keep in mind that two major economic events will be released today:
📌 Gross Domestic Product (GDP) (QoQ) – Q1
📌 Initial Jobless Claims
These are highly impactful events, so please manage your risk accordingly.
🔍 Trade Details
✔️ Timeframe: 30-Minute
✔️ Risk-to-Reward Ratio: 1:2.5
✔️ Trade Direction: Buy
✔️ Entry Price: 3336.62
✔️ Take Profit: 3366.67 / 3382.51 / 3392.36
✔️ Stop Loss: 3324.97
🕒 If momentum fades or the price consolidates within a tight range, I’ll keep this trade open only until 23:00 (UTC+4). After that, I’ll close it manually—whether in profit or loss—depending on how the price action evolves.
🔔 Disclaimer: This is not financial advice. I’m simply sharing a trade I’ve taken based on my personal trading system, strictly for educational and illustrative purposes.
📌 Interested in a systematic, data-driven trading approach?
💡 Follow the page and turn on notifications to stay updated on future trade setups and advanced market insights.
XAU/USD – Smart Money Building Toward $3360? |26 June 2025Gold (XAU/USD) is pushing into fresh highs around $3337, and we may be approaching a key inflection point. But beneath the surface of candles and wicks lies the real story — one written by liquidity, displacement, and smart money positioning.
This outlook breaks down gold’s price action using Smart Money Concepts (SMC), price structure, and Fibonacci confluence, to help identify the most probable high-value trade zones for both swing and intraday traders.
4H Outlook – Institutional Flow & Structure
Market Structure
Gold recently broke above the $3310–$3320 resistance, confirming a bullish Break of Structure (BOS). This keeps the market in a sequence of higher highs and higher lows, validating continued bullish pressure.
Smart Money Insights
BOS: Clean break above $3320 signals strength.
CHoCH: None yet — trend remains bullish.
Liquidity Sweep: Sell stops below $3295 have already been taken.
Buy-Side Liquidity: Sits above $3350 — price may gravitate there next.
FVG: Unfilled Fair Value Gap between $3314–$3322 — possible retracement zone.
Bullish OB: Identified between $3300–$3310, aligned with FVG and BOS level.
Equilibrium: Using $3275 (swing low) and $3342 (swing high), the midpoint sits near $3308, acting as fair re-entry value.
Key Zones
Buy Zone (Demand): $3295–$3310 — OB + FVG + Fib confluence.
Sell Zone (Supply): $3350–$3360 — next likely liquidity target.
Bias Summary
As long as price remains above $3295, the bullish structure stays valid. Watch for a retracement into $3308–$3316 for potential continuation toward $3350–$3360. Price may briefly dip below $3310 to trigger liquidity before moving higher.
1H View – Precision Entries
Structure
Following the high at $3342, price has pulled back slightly and is forming what appears to be a bullish flag — often a continuation pattern.
Smart Money Zones (1H)
FVG: $3315–$3322 — potential short-term reaction zone.
Order Block: $3305–$3312 — 1H bullish OB aligned with 4H bias.
Sell-side Liquidity: Swept at $3295 earlier this week — supports continuation.
Trade Setups
Long Setup #1 – Optimal Entry
Entry: $3308–$3315
Stop: Below $3295
TP: $3342 (partial), $3350–$3360 (full)
Why: Strong zone combining FVG, OB, and Fib support.
Long Setup #2 – Aggressive Entry
Entry: $3316–$3320
Stop: $3300
TP: $3340–$3350
Why: Quicker entry inside the imbalance — riskier but valid.
Short Setup – Countertrend (Low Conviction)
Only valid on a clear break below $3310 + CHoCH
Entry: Below $3310 (confirmed)
Target: $3295
Note: Lower confidence unless 1H structure turns bearish.
Final Notes
The bias remains bullish above $3301–$3308. This is a high-probability area to look for long setups on retracement. Avoid shorts unless we see a confirmed structural shift with a CHoCH and OB breakdown.
Expect the market to potentially hunt stops below $3310, then aim for liquidity sitting above $3350–$3360.

Elliott Wave Analysis – XAUUSD Plan for June 26, 2025
🌀 Wave Structure
On the H1 chart, our previous plan anticipated price movement within green wave 3. However, the current price action lacks the sharp, impulsive characteristics typically seen in wave 3. Instead, the overlapping structure of minor waves suggests that we may not be in wave 3. This leads us to consider two primary scenarios:
🔹 Scenario 1 – abc Correction (black):
Price may be forming wave c (black). However, due to the overlapping nature of recent price moves, it is likely that wave c is developing as an ending diagonal (wedge).
➡️ Confirmation signal: A sharp, steep decline that breaks below the 3297 level would signal that wave c has completed.
🎯 Target zone for wave c: 3352 – 3356
🔹 Scenario 2 – Leading Diagonal in Wave 1:
The overlapping price structure could also be forming a leading diagonal (3-3-3-3-3) as wave 1. In this case, price is currently in wave 3 or 4 of this formation.
➡️ Once wave 1 completes, we expect a retracement to the 0.618 Fibonacci level of the entire wave 1 – forming wave 2.
🎯 Target zone for the end of wave 1: 3352 – 3356
📉 Momentum Analysis
Momentum plays a crucial role in determining which wave structure is unfolding.
D1 Timeframe: Momentum is turning upward from the oversold zone – indicating that the downtrend may be ending. This supports the scenario of a leading diagonal wave 1 and suggests we may see a sustained bullish move over the next 5 days.
H4 Timeframe: Momentum is preparing to reverse downward from the overbought zone. This is a key signal to monitor today, especially during tonight’s news events.
If price continues to move sideways within a wedge, it would support the leading diagonal scenario.
If price breaks down sharply, it would favor the abc correction scenario.
🧭 Trade Plan
🔻 Sell Zone: 3352 – 3355
⛔️ Stop Loss: 3362
🎯 Take Profit 1: 3333
🎯 Take Profit 2: 3323
📌 The market’s behavior during the U.S. session tonight will be critical in confirming the wave structure. Stay alert and ready to adjust the trade plan accordingly.

Gold Short Term OutlookYesterday, we noted that gold needed to close and hold above the $3,330 resistance to open the path toward $3,346 and potentially $3,375.
Since then, price rejected the intraday support and is now trending above the $3,330 level.
Currently, the 50MA is acting as dynamic resistance. A clean break above it could trigger a move toward $3,346 and possibly higher resistance zones.
However, if bullish momentum fades, price may drop back toward the key support area, where buyers could look to step in again.
🔑 Key Levels:
Resistance:
$3,330 • $3,346 • $3,361 • $3,375
Support:
$3,306 • $3,287 • $3,271 • $3,242

BTC continues to short at high levels during the day📰 Impact of news:
1. Geopolitical impact
📈 Market analysis:
BTC has reached an intraday high of 108,125, just one step away from the all-time high of 112,000. With the increase in trading volume and institutional sentiment turning bullish, the momentum seems to be in the bulls' favor. In addition to institutional buying, the ceasefire agreement in the Iran-Israel war is also an important factor in Bitcoin's sharp rebound. Trump's announcement of the end of the war almost immediately triggered a surge in the cryptocurrency market. However, the overall pattern has not changed, and the range resistance has not been broken, so we still keep the idea of shorting at high levels.
🏅 Trading strategies:
SELL 108000-107500
TP 104500-103500
If you agree with this view, or have a better idea, please leave a message in the comment area. I look forward to hearing different voices.

Elliott Wave Analysis – XAUUSD Plan for June 25, 2025🌀 Elliott Wave Structure
Looking at the H1 chart, we can see a 5-wave black triangle structure has formed within wave Y. This suggests two possible scenarios:
Scenario 1: Wave Y has completed → the current upward move is wave 1 of a new 5-wave green structure. The ongoing pullback would then be wave 2 of this sequence.
Scenario 2: Wave A of wave Y has completed as a 5-wave move → we are now in wave B of wave Y, which typically forms a 3-wave pattern. In this case, wave a (black) has formed and wave b (black) is currently developing.
✅ In both scenarios, the ongoing decline is a shared element — representing a buying opportunity.
🎯 Key Target Zones
Target 1: 3313 – 3310
Target 2: 3301
⚠️ If price breaks below 3297, the current wave count is invalidated, and we must prepare for a deeper correction. Updates will follow if that happens.
🔁 Momentum Outlook
D1 Timeframe:
Momentum is about to reverse upward. We expect at least 5–6 days of bullish movement for D1 momentum to reach overbought territory ⇒ This supports a potential short-term uptrend and favors both bullish wave counts.
H4 Timeframe:
Momentum is about to reverse downward from the overbought zone → A further decline to our buy zones is likely.
H1 Timeframe:
Momentum is currently declining → The ongoing pullback is expected to continue.
📌 What to wait for: A bullish reversal in H1 momentum aligned with H4 in the oversold region will confirm the bottom is in.
✅ Trade Plan
🔹 BUY ZONE 1: 3313 – 3310
• SL: 3306
• TP1: 3335 | TP2: 3350 | TP3: 3376
🔹 BUY ZONE 2: 3303 – 3301
• SL: 3296
• TP1: 3335 | TP2: 3363 | TP3: 3376

Suppression remains unchanged, the latest layout of gold📰 Impact of news:
1. Powell's testimony
2. Geopolitical impact
📈 Market analysis:
The short-term rebound of gold is the release of energy for the accumulated bulls. From the current market trend, 3340 above is the key point of the short-term watershed between bulls and bears. The short-term resistance above is around 3342-3348, and the short-term support below is around 33220-3315. If it falls below this, it will continue to look towards yesterday's low of 3290-3280. The daily level is under pressure and continues to see a decline and adjustment. If it touches 3340-3350 above, you can try to short. After it retreats to 3320-3315 and obtains effective support, you can consider going long.
🏅 Trading strategies:
SELL 3340-3350
TP 3330-3320-3315
BUY 3320-3315
TP 3330-3340-3350
If you agree with this view, or have a better idea, please leave a message in the comment area. I look forward to hearing different voices.
OANDA:XAUUSD FX:XAUUSD FOREXCOM:XAUUSD FXOPEN:XAUUSD TVC:GOLD

Bulls have made profits, gold layout in the evening📰 Impact of news:
1. Powell's testimony
2. Geopolitical impact
📈 Market analysis:
I have completed the long trade according to the previous trading strategy, and the long order has generated profit. In the short term, the overall trend of gold is still bearish. Only if it breaks through and stabilizes above 3350 can the bulls continue. If it rebounds to the 3330-3335 line and encounters resistance under pressure, you can consider shorting. If it rebounds to 3340-3350 but fails to stabilize, you can increase your short position. Pay attention to the support of 3320-3300 below. If it falls below 3300, it is expected to reach 3280
🏅 Trading strategies:
SELL 3330-3335-3340-3350
TP 3320-3310-3300-3280
If you agree with this view, or have a better idea, please leave a message in the comment area. I look forward to hearing different voices.
OANDA:XAUUSD FX:XAUUSD FOREXCOM:XAUUSD FXOPEN:XAUUSD TVC:GOLD

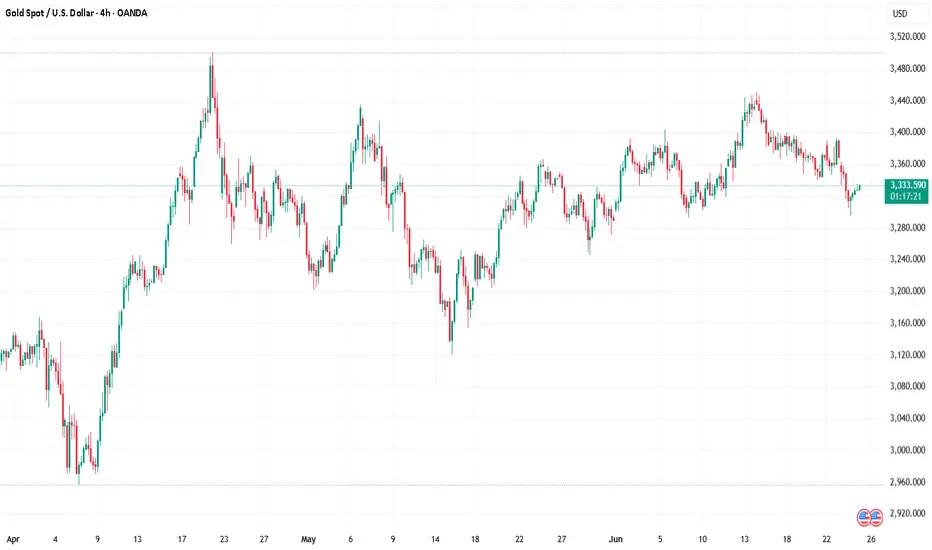
Gold Spot / U.S. Dollar (XAU/USD) 4-Hour Chart Analysis4-hour chart from OANDA shows the recent performance of Gold Spot priced in U.S. Dollars (XAU/USD), with the current price at $3,313.650, reflecting a decrease of $9.800 (-0.29%). The chart highlights a recent upward trend followed by a pullback, with a support zone around $3,301.186 to $3,313.650 and a resistance level near $3,380.030. The inset provides a zoomed-in view of the price action, indicating potential volatility with a lightning bolt symbol and U.S. flags, suggesting significant market movements or news

GOLD/XAUUSD SellGold price is still bearish in the short term. The US dollar is currently being boosted. There are also geopolitical talks and indirect ceasefires. Therefore, the short-term risk aversion sentiment has declined. The gold price is now quoted at: 3323. We can focus on the lower target of 3300-3290.

Gold bullish or bearish?From the technical aspect of gold, yesterday, gold gradually fell to 3295 as low as possible. The three tracks of the Bollinger Bands on the daily chart are shrinking, which means that the range is compressed to 3290-3420. The middle and lower tracks in the daily chart are currently 3290-3355. The short-term moving average is currently entangled near the middle track, which also shows the price fluctuation. However, the MACD indicator crosses and increases in volume, which means that the price fluctuates at a low level. Therefore, the strength of the intraday rebound is relatively small, so 3355 and yesterday's high of 3370 are today's resistance levels.
From the 4-hour chart, three consecutive positives are formed in the low-level rebound, the Bollinger Bands close, the current MACD crosses and shrinks in volume, and the dynamic indicator STO quickly repairs upward, which means that the price is fluctuating and rushing up. At present, the price rebounds and breaks through the 3332-33 line, so today it will continue to rebound and test the 3342-48 and 3355 lines, so there is still room above. At the same time, due to the rebound in the morning, the 4-hour and hourly lines are currently bullish. Therefore, we can only buy in advance near 3324-25, and look at the 3340-3348 line. And the short position is below 3354.
Gold operation strategy: It is recommended to buy once when it falls back to 3322-3324, stop loss at 3316, target 3340-3350; it is recommended to sell once when it touches 3348-3352, stop loss at 3359, target 3330-3320;

gold on short bullish#XAUUSD on bullish reverse till 3340 for sell.
Buy on 2 times breakout above 3330, target 3340, SL 3325 short.
Above 3340 sell, target 3305, SL 3349
Below 3320 have bearish range, we watch the price closely to sell till 3315-3305.

XAU/USD 25 June 2025 Intraday AnalysisH4 Analysis:
-> Swing: Bullish.
-> Internal: Bullish.
Analysis and bias remains the same as analysis dated 23 April 2025
Price has now printed a bearish CHoCH according to my analysis yesterday.
Price is now trading within an established internal range.
Intraday Expectation:
Price to trade down to either discount of internal 50% EQ, or H4 demand zone before targeting weak internal high priced at 3,500.200.
Note:
The Federal Reserve’s sustained dovish stance, coupled with ongoing geopolitical uncertainties, is likely to prolong heightened volatility in the gold market. Given this elevated risk environment, traders should exercise caution and recalibrate risk management strategies to navigate potential price fluctuations effectively.
Additionally, gold pricing remains sensitive to broader macroeconomic developments, including policy decisions under President Trump. Shifts in geopolitical strategy and economic directives could further amplify uncertainty, contributing to market repricing dynamics.
H4 Chart:
M15 Analysis:
-> Swing: Bullish.
-> Internal: Bullish.
Following previous high, and printing of bearish CHoCH, price has pulled back to an M15 supply zone, where we are currently seeing a reaction. Therefore, I shall now confirm internal high.
Price is now trading within an established internal range.
The remainder of my analysis shall remain the same as analysis dated 13 June 2025, apart from target price.
As per my analysis dated 22 May 2025 whereby I mentioned price can be seen to be reacting at discount of 50% EQ on H4 timeframe, therefore, it is a viable alternative that price could potentially print a bullish iBOS on M15 timeframe despite internal structure being bearish.
Price has printed a bullish iBOS followed by a bearish CHoCH, which indicates, but does not confirm, bearish pullback phase initiation. I will however continue to monitor, with respect to depth of pullback.
Intraday Expectation:
Price to continue bearish, react at either M15 supply zone, or discount of 50% internal EQ before targeting weak internal high priced at 3,451.375.
Note:
Gold remains highly volatile amid the Federal Reserve's continued dovish stance, persistent and escalating geopolitical uncertainties. Traders should implement robust risk management strategies and remain vigilant, as price swings may become more pronounced in this elevated volatility environment.
Additionally, President Trump’s recent tariff announcements are expected to further amplify market turbulence, potentially triggering sharp price fluctuations and whipsaws.
M15 Chart:

XAU/USD Bullish Reversal from Key SupportXAU/USD Bullish Reversal from Key Support 📈🟢
📊 Chart Analysis:
Rounded Bottom Structure ⬆️
The price has formed a rounded bottom pattern, indicating potential trend reversal from bearish to bullish.
Multiple bounces (🟠 circles) from the curved support trendline confirm the validity of this structure.
Support Zone Rejection ✅
Price recently rejected from a major horizontal support zone (around 3,303.796 USD) with a strong bullish wick.
This zone has acted as a springboard for prior upward moves.
Falling Wedge Breakout 💥
A falling wedge (bullish pattern) has formed and is breaking to the upside.
Breakout confirmation is underway, indicating momentum shift.
Target Projection 🎯
The projected move from the breakout suggests a potential target at 3,385.820 USD.
This aligns with previous resistance areas.
Key Levels to Watch:
Resistance: 3,385.820 USD (target) and 3,425–3,450 USD (major resistance zone)
Support: 3,303.796 USD (short-term), followed by 3,225–3,250 USD zone
🔔 Conclusion:
Price action suggests a bullish bias with a possible upward continuation if it sustains above the wedge breakout.
Confirmation above 3,330 USD with volume can fuel a rally toward the 3,385–3,400 USD target zone.
📌 Risk Management Tip: Watch for fakeouts near wedge resistance or a re-test of 3,303 USD for better entries.

GOLD H2 Intraday Chart Update For 25 June 25 Hello Traders, as you can see that market just try to broke 3300 psychological level yesterday but unfortunately that was not successful attempt
All eyes on 3337-3348 zone for the day if market successfully breaks that zone it will move towards 3365 Blind Structure Level else we might see 3305 level test soon on Intraday basis
Reminder: This is also FED Chair Powell 2nd of Testifies
Disclaimer: Forex is Risky

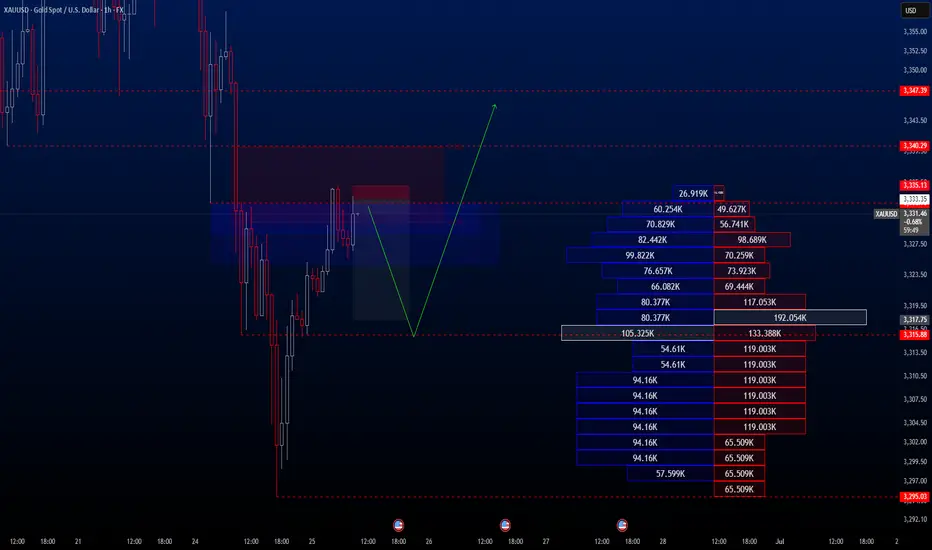
XAUUSDHello traders.
I’ve spotted an exceptional sell opportunity on the XAUUSD pair—one of those setups that come around once in a hundred years! The trade offers a Risk-to-Reward ratio of over 1:8, so I thought it would be valuable to share it with you.
Please adjust your risk parameters accordingly before entering the trade.
🔍 Trade Details
✔️ Timeframe: H1
✔️ Risk-to-Reward Ratio: 1:8.70
✔️ Trade Direction: Sell
✔️ Entry Price: 3333.35
✔️ Take Profit: 3317.75
✔️ Stop Loss: 3335.13
🕒 If momentum fades or the price consolidates in a tight range, I will keep this trade open only until 23:00 (UTC+4). After that, I’ll close it manually—whether in profit or loss—depending on how price action evolves.
🔔 Disclaimer: This is not financial advice. I’m simply sharing a trade I’ve taken based on my personal trading system, strictly for educational and illustrative purposes.
📌 Interested in a systematic, data-driven trading approach?
💡 Follow the page and turn on notifications to stay updated on future trade setups and advanced market insights.
4‑Hour Analysis – Supply & Demand Overview 25 June 20251. Market Structure
XAU/USD currently trades at 3333 and shows clear higher highs and higher lows on the 4‑hour timeframe—reflecting a bullish structure backed by recent swing lows above 3300 and highs nearing 3365
2. Key Demand Zones
DZ1: 3320–3330 – Consolidation region with multiple wicks and price rejections; confirmed buying volume (aligned with ML and 50‑EMA confluence)
DZ2: 3300–3310 – A deeper base with strong reversal history; aligns with psychological round number and 0.382 Fib of recent up-swing
3. Key Supply Zones
SZ1: 3350–3360 – Upper resistance cluster formed by repeated spikes and quick rejections; overlapping 0.5–0.618 Fib from the last retracement
SZ2: 3380–3400 – Broader distribution area with past failed breakouts; significant liquidity shelf noted
4. Why These Zones Matter
Demand zones act as value entry areas where institutional and retail buyers absorb selling pressure, usually followed by swift reversals.
Supply zones represent distribution pockets where buy orders face strong pushback, often leading to corrective moves.
5. Bias
✅ Overall Bias – Bullish (4‑hour) thanks to structural trend (HH/HL), price above key previews like 50‑EMA & 20‑EMA, and consistent demand responses. Only a break below 3320 invalidates bullish tilt.
⚡ 1‑Hour Intraday Setups (Aligned with Bullish 4H Bias)
Buy the Dip (Main Entry)
Zone: 3320–3325
Context: Retest of DZ1, tagging the 4H structure and 1H ascending trendline.
Confirmation: Bullish pin bar or long tail candle + volume surge.
Channel Retest Quick‑Entry
Zone: 3330–3335
Context: Price remediates after a clean breakout above the 1‑hour descending channel.
Confirmation: Trendline bounce or bullish engulfing on the first test.
Supply‑Fade (Aggressive)
Zone: 3350–3355
Context: Approach to SZ1—plays the bearish reaction in a bull market context.
Confirmation: Bearish pin bar, upper wick exhaustion, and slim 1H RSI divergence.
📈 Chart Snapshot & Confluences
DZ1 (3320–3330) aligns with the 0.382 Fib and ascending 1‑hour trendline.
Quick-entry zone (3330–3335) sits close to the 1‑hour 50‑EMA, offering dynamic multi‑timeframe confluence.
SZ1 aligns with higher-term fib and previous supply peaks.
📝 Ready Summary
XAU/USD – 4H Structure: Bullish – higher highs & higher lows.
Major Demand Zones: 3320–3330 (primary), 3300–3310 (secondary).
Major Supply Zones: 3350–3360 (hot zone), 3380–3400 (upper resistance).
Bias: Bullish as long as price holds above 3320.
Intraday Trade Zones:
Buy the Dip: 3320–3325 – look for pin‑bar/volume bounce.
Quick Re‑Entry: 3330–3335 – trendline or 50‑EMA test confirmation.
Supply Fade (Aggressive): 3350–3355 – bearish rejection setup.
Pro Tip: Focus on clean price action signals (wicks, engulfings, volume) within entry zones and confirm with multi‑timeframe confluences (Fib, EMA, trendlines).