Gold Spot / U.S. Dollar (XAUUSD) 4-Hour Chart - OANDA4-hour candlestick chart from OANDA displays the price movement of Gold Spot (XAUUSD) from late June to early July 2025. The current price is $3,332.245, reflecting a +0.26% increase (+$8.795) as of 07:39 AM CEST on June 25, 2025. The chart highlights a recent price range between $3,320.076 and $3,365.226, with a notable support level around $3,329.934 and resistance near $3,355.226. The chart includes a shaded area indicating a consolidation or trading range.
Xauusdupdates

XAUUSD Ready bounce back?XAUUSD 3295.00 is an important weekly and daily key level price has just bounced back from the key level with double bottom formation. It is possible for the price to continue to bounce back to daily resistance level?
While was in down trend price has left significant imbalance in the market showing possible uptrend with the filling of FVG.
A buy trade with strong liquidity grab is high probable.

Geopolitical Spike Fades Fast – Gold Eyes 3300As highlighted in Friday’s analysis, the daily and short-term charts remain messy, but the weekly chart is leaning clearly bearish – with a potential Dark Cloud Cover candlestick formation now confirmed.
🌍 Geopolitical Gap Up... and Quick Rejection
Monday’s Asian open brought a gap up, triggered by renewed tensions in the Middle East. But price failed to break above 3400 and quickly reversed – a textbook sign of weakness, not strength.
🧭 Technical View:
- The weekly candle closed as a Dark Cloud Cover, a strong bearish reversal signal
- The lack of follow-through after the gap up further confirms sellers are still in control
- Price remains below the key 3400 level, showing no bullish momentum behind recent spikes
📌 Trading Plan:
I continue to sell rallies, with an initial target near 3300. If bearish momentum builds, lower levels are in play.
Let the chart lead – don’t get distracted by the noise.
Disclosure: I am part of TradeNation's Influencer program and receive a monthly fee for using their TradingView charts in my analyses and educational articles.

XAU/USD – 5-Minute Scalping Outlook🟢 XAU/USD – 5-Minute Scalping Outlook
🕐 Gold Spot / U.S. Dollar – Heikin Ashi
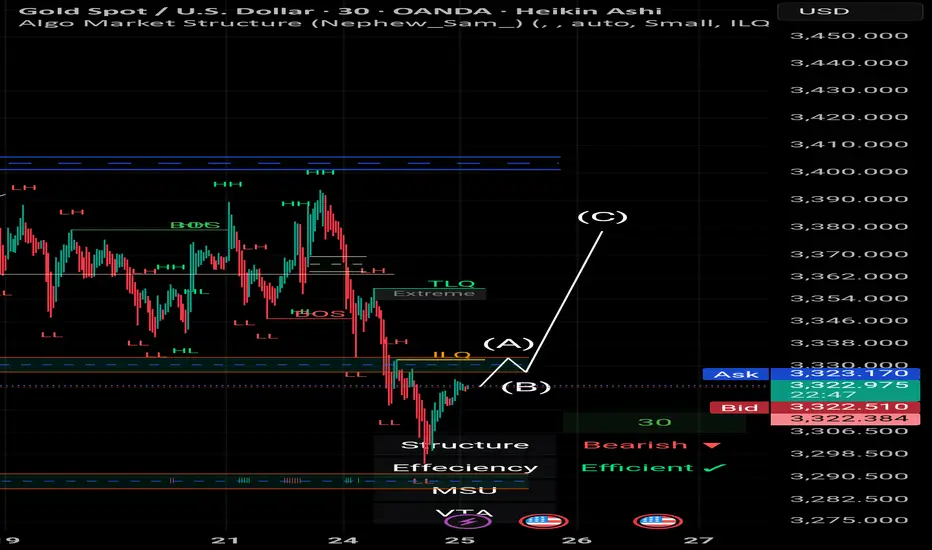
The market structure on the 5-minute chart confirms a bullish bias, supported by multiple structural shifts and a recent Break of Structure (BOS) following a valid trading range.
🔍 Key Highlights:
After a clear BOS and bullish consolidation, price tapped into the TLQ (True Liquidity Zone) and reacted strongly from the Extreme Zone just above $3,316.
The EPA (Entry Point Area) held effectively as a short-term support, fueling a sharp breakout move.
The current price has surged past $3,322, pushing into an area of minor resistance near $3,332 – $3,336.
The recent price action shows the market is inefficient, which often leads to rebalancing — watch for a potential retrace toward EPA or TLQ before continuation.
📈 Scalping Strategy Note:
Traders could look for short-term retracement entries between $3,318 – $3,320, targeting the upper resistance zone while managing risk below $3,316.
📊
Structure: Bullish ✅
Efficiency: Inefficient ❌ (expect potential re-tests)
Momentum: Accelerating
Trend Bias: Intraday Bullish
---
💬 Scalpers should remain cautious around high volatility zones and news-driven sessions.
This chart reflects an excellent model for liquidity-based entries in a trending environment.
📌 Analysis by: Mohsen Mozafari Nejad
Gold Short Term OutlookGold dipped into the Support Zone but failed to sustain the breakdown below it. After briefly breaking below the zone, price has rebounded and is now attempting a short-term recovery.
However, structure remains bearish, with price trading below both the 50MA and 200MA, signalling continued downside pressure unless momentum shifts.
For bullish momentum to continue, we need to see a clean break and hold above $3,330, which may open the path toward $3,346, then $3,361.
If the move up doesn’t hold, the next reaction is expected near key support.
🔑 Key Levels:
Resistance:
$3,330 • $3,346 • $3,361 • $3,375
Support:
$3,306 • $3,287 • $3,271 • $3,242
📌 Stay patient and wait for confirmation before committing to a direction.

Elliott Wave Analysis – XAUUSD June 24, 2025
🌀 Wave Structure
Looking at the H1 chart during the Asian session today:
+ Price broke below the previous low at 3341, invalidating the idea that Friday’s rally marked the beginning of a new uptrend.
+ Instead, the rally appears to be forming a wave X in a larger WXY corrective structure.
+ Given the current complex corrective pattern, it’s challenging to precisely define the exact wave shape and targets.
🔻 Wave Y Structure:
+ The price action suggests the formation of a 5-wave decline, with the market currently in wave 4.
+ Wave 4 target zone: 3357 – 3363 → Sell zone.
+ After completing wave 4, we expect a continuation of the downtrend via wave 5, with a target around 3327 – 3324 → Buy zone.
+ Once wave 5 completes, we anticipate at least a corrective upward retracement, with targets at 3363 – 3376 (these are the TP levels for the buy trade).
⚡️ Momentum Analysis
+ D1 timeframe: Momentum is turning bullish, suggesting a potential rally lasting around 5–8 D1 candles after wave 5 finishes.
+ H4 timeframe: Momentum is declining and may enter oversold territory within 1–2 candles, supporting the completion of wave 5.
+ H1 timeframe: Momentum is rising and approaching overbought levels, indicating a likely end of wave 4 within 1–2 H1 candles.
📌 Trade Plan
🔹 SELL ZONE: 3363 – 3365
+ SL: 3373
+ TP1: 3342
+ TP2: 3330
🔹 BUY ZONE: 3327 – 3324
+ SL: 3317
+ TP1: 3342
+ TP2: 3363
+ TP3: 3376
+ Important Note:❗️
- If price reaches these zones with a Mazuboru candle (long-bodied candle with no wick) and fast volatility, do not enter immediately.
- Wait for the candle to close. If the zone breaks, keep an eye on the next support area around 3313 for potential reactions.

XAUUSD – Selling Pressure Intensifies, the 3,300 USD 1. Overall Technical Context
The XAUUSD daily chart shows that gold is under bearish pressure after failing to break the key confluence resistance at 3,385–3,399 USD, which includes:
- Fibonacci retracement levels 0.5 – 0.618
- A strong supply zone that has been repeatedly rejected
- A minor swing high formed near 3,451 USD
2. Recent Price Behavior
Price has broken below the short-term support at 3,331 USD and is now retesting the Key Lever zone around 3,300 USD, which is a confluence of:
- Previous June swing low
- Fibonacci 0.618 retracement of the latest upward move from 3,221 to 3,451
- A key previous support zone, potentially forming the right shoulder of a head and shoulders structure
If this zone breaks decisively, XAUUSD may continue falling toward the 3,270 – 3,250 USD area, where strong liquidity was previously found.
Key Technical Zones
Resistance:
3,385 – 3,399: Fibo 0.5–0.618 zone and recent swing high
3,435 – 3,451: Major swing high and starting point of the latest correction
Support:
3,300 – 3,320 (Key Lever): Major support currently being tested
3,271 – 3,250: Next support if the current zone fails
Suggested Trading Scenarios
Scenario 1 – Buy on Confirmation at Key Lever
Entry: 3,300 – 3,297 (Key Lever zone)
Stop-loss: Below 3,292
Take-profit: 3,310 – 3,315 – 3,320
Condition: Wait for a clear reversal candlestick pattern or signs of selling absorption on H4/H1
Scenario 2 – Sell if Price Breaks Below Key Lever
Entry: Below 3,290 (after clear break of Key Lever)
Stop-loss: Above 3,298
Take-profit: 3,280 – 3,270
P.S. XAUUSD is currently sitting at a decisive support area around 3,300 USD. The medium-term trend will depend on whether this zone holds. Traders are advised to closely watch price action on the H1–H4 timeframes before executing entries.
Follow for more daily trading strategies and don’t forget to save this analysis if you find it helpful for your trading plan.
Analyst: @Henrybillion

Analysis and layout of the latest gold trend in the evening📰 Impact of news:
1. The ceasefire agreement reached earlier did not take effect, and Trump believed that both sides violated the agreement
2. Federal Reserve Chairman Powell delivered a speech 3 hours later
📈 Market analysis:
After falling below the 3300 mark, gold hit the 3295 line and then rebounded. However, there are too many long orders at the current high level of gold, and the market will not rise easily. The current international situation is so tense, and gold is still slowly declining. It is difficult to rebound sharply in this situation. In the short term, focus on 3290-3280 below. If effective support is obtained, you can go long and look towards 3300-3310. If it falls below the support line of 3290-3280, the downward channel of gold will be opened and it is expected to reach 3265. At the same time, pay attention to the 3328-3338 resistance range on the upside. If the first rebound in the evening encounters pressure and resistance here, you may consider shorting.
🏅 Trading strategies:
SELL 3328-3338-3400
TP 3310-3300-3295
BUY 3290-3280
TP 3300-3310
If you agree with this view, or have a better idea, please leave a message in the comment area. I look forward to hearing different voices.
TVC:GOLD FXOPEN:XAUUSD FOREXCOM:XAUUSD FX:XAUUSD OANDA:XAUUSD

Gold’s Geopolitical Launchpad: Eyes on $3,500+🟡 GOLD - Macro Fuel Meets Technical Momentum Trade Levels Inside
Gold continues to flex its haven status as geopolitical tensions flare once again—this time triggered by reports of a U.S. airstrike on Iranian nuclear facilities. That headline risk has lit the fuse under precious metals, and the reaction in futures markets has been swift.
Friday’s intraday washout—largely driven by hopes that President Trump would opt for diplomacy—was short-lived. The strong recovery into New York close left a long lower shadow, signaling buyers are already pricing in weekend escalation risk.
💡 Macro View:
- Analysts project a move toward $3,500–$3,700, driven by a twin-engine of geopolitical instability and sticky inflation.
- Central banks are staying long; ETF inflows are ticking up—this isn’t just speculative hype.
- Goldman’s base case: $3,700 EOY, $4,000 by mid-2026. Recession/volatility scenarios stretch targets up to $4,500.
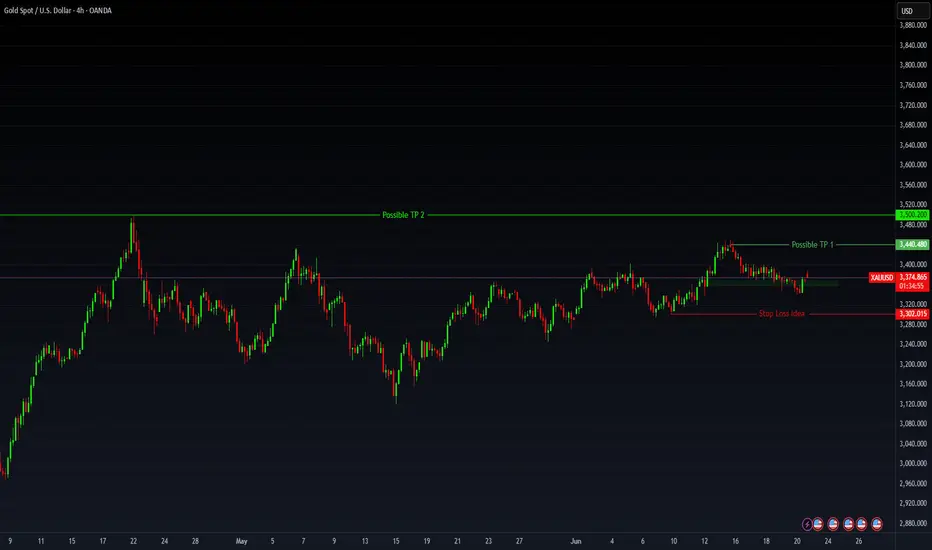
🔧 Technical Setup:
- Bias across all time frames remains bullish. Open float pressure is stacking with long-side conviction.
- Key long trigger zone sits between $3,369–$3,375—I’m watching for confirmation here.
- Profit targets:
- First resistance: $3,440.48
- Second target: $3,500 zone
- Stretch: $3,520+ if volatility expands
Will the 3300 support hold today?Due to the sudden ceasefire agreement between Iran and Israel today, the gold market quickly flipped from bullish to bearish — when gold tested the 3300 support level just now, it rebounded near 3315 📈.
It may challenge the 3290-3300 support range again later: if it effectively breaks below, the next target is the strong support at 3265, and it may eventually dip to 3200 before starting a rebound 🔄.
If the breakout fails, it may consolidate near 3330, waiting for further market guidance 📊
⚡️⚡️⚡️ XAUUSD ⚡️⚡️⚡️
🚀 Sell@3330 - 3320
🚀 TP 3310 - 3305

Gold prices rebound weakly after sharp fallFrom a technical perspective, the gold daily moving average system is intertwined, and the long and short forces are relatively balanced. The current key resistance above is near 3350, which is an important psychological barrier. If an effective breakthrough is achieved, it may open up the upward space; the support below focuses on the 3285-3290 line, which is the lower edge of the May oscillation platform. If it falls below, it may increase the pressure of the correction. The loss of the middle track in the 4-hour chart further confirms the short-term weak structure and provides technical support for the downward trend. It is recommended to go long near the 3285-3290 level. At present, gold continues to fall in line with the trend.
Operation strategy:
1. It is recommended to go long in the 3287-3292 area of gold, with a stop loss at 3280 and a target of 3320-3340.

Gold Spot Price Analysis (4-Hour Chart4-hour candlestick chart for the Gold Spot price in U.S. Dollars (XAU/USD) from June 22 to July 9. The chart shows a downward trend with recent prices around $3,299.48, representing a 2.07% decrease. Technical indicators and annotations suggest potential support and resistance levels, with a highlighted area indicating a possible trading range. The data is sourced from OANDA.

XAUUSD Beginning of a Trend Reversal? Bearish Move IncomingGold is showing signs of potential downside pressure on the 4-hour chart. After a rejection from the upper volatility band and a failure to sustain bullish momentum above the dynamic EMA cloud, price has rolled over and is now trading below the midline support area.
🔻 Bearish Structure Developing:
Price rejected strongly from the upper gray zone (Resistance band).
A new lower high has formed, aligning with bearish market structure.
Candles are trading under the red-to-blue transition EMA ribbon, indicating increasing bearish sentiment.
🎯 Trade Setup:
Entry: Near 3,365
SL: Above the recent high near 3,406
TP: Targeting the lower band support around 3,300 – 3,323

gold on sell#XAUUSD price needs to fall below 3315 on M30 closure below there will target 3300-3290.
Entry on sell 3315, target 3300-3315, stop loss 3330.
Bullish needs to form a new zone to keep buying, breakout above 3334 on H1 cloud will continue buying.

Gold is about to break through 3400! On June 21, 2025 local time, U.S. President Trump announced that the U.S. had launched strikes against three Iranian nuclear facilities—Fordo, Natanz, and Isfahan—using six B-2 stealth bombers 😲. This move marked the formal intervention of the U.S. in the Middle East conflict, prompting the UN Security Council to convene an emergency meeting immediately. This underlies the core logic of our sustained "long gold" strategy last week: the geopolitical situation in the Middle East harbors the risk of escalating at any moment 🤯. If the Security Council fails to roll out direct solutions, gold, as a safe-haven asset, may continue its upward trajectory driven by market panic 📈.
The UN Security Council meeting on June 23, 2025 failed to break the deadlock, and the Middle East situation remains highly fluid. Given that the U.S. is highly unlikely to implement any solutions proposed by the Security Council, the regional crisis may deteriorate further 🚨
Gold is about to break through 3,400! 🌟
Accurate signals are updated every day 📈 If you encounter any problems during trading, these signals can serve as your reliable guide 🧭 Feel free to refer to them! I sincerely hope they'll be of great help to you 🌟 👇

War breaks out again? The latest analysis and layout of gold📰 Impact of news:
1. The ceasefire agreement reached earlier did not take effect, and Trump believed that both sides violated the agreement
2. Federal Reserve Chairman Powell delivered a speech 3 hours later
📈 Market analysis:
At the 4H level: the Bollinger Band opening is enlarged, the MACD indicator double-line death cross is downward, the short-selling force is strengthened, but the RSI indicator rebounds after being oversold. Overall, there are obvious signs of a rebound in gold prices. At the hourly level: the gold price is in a downward channel, the Bollinger Bands are expanding, the MACD indicator is dead cross and the red bars are converging, and the short momentum has weakened. The RSI indicator rebounds from oversold, and the demand for spot gold rebounds is obvious. Therefore, we still hold long orders near 3320 in the short term. Short-term operation suggestion: go long when it stabilizes at 3325-3315, pay attention to the resistance range of 3370-3380 on the upside, and consider shorting when encountering resistance and pressure.
🏅 Trading strategies:
BUY 3325-3315
TP 3335-3345-3365
SELL 3370-3380
TP 3340-3330
If you agree with this view, or have a better idea, please leave a message in the comment area. I look forward to hearing different voices.
OANDA:XAUUSD FX:XAUUSD FOREXCOM:XAUUSD FXOPEN:XAUUSD TVC:GOLD

Gold updateAfter the previous level was broken and structure shifted, we’re now entering a new phase of analysis.
In this fresh setup, we’re looking for buy opportunities — but not blindly!
As always, waiting for a clean pullback to the new zone and a solid entry signal.
Experience teaches us: real profits come from patience and planning.
Here’s my new gold analysis — high probability, low risk.
For detailed entry points, trade management, and high-probability setups, follow the channel:
ForexCSP

Weakness continues, continue to short the bear market📰 Impact of news:
1. Pay attention to Powell's speech in New York
2. Pay attention to geopolitical influence
📈 Market analysis:
Gold opened lower and showed a weak situation. The 1H moving average was arranged downward. In the short term, bears still occupied the main trend. From the 4-hour analysis of gold, the bulls still had repeated resistance before breaking down. Once it breaks down, the market will go further bearish. Pay attention to 3330 below. 3400 is still the key above in the short term. Only by breaking through the bulls can the rebound continue. In terms of operation, high-altitude and low-long are temporarily maintained. Pay attention to the short-term resistance of 3355-3365 above, and the support of 3340-3330 below. Pay attention to the breakthrough! Pay attention to Powell's speech in the New York session.
🏅 Trading strategies:
SELL 3370-3365-3355
TP 3340-3330
BUY 3340-3335-3320
TP 3345-3355-3365
If you agree with this view, or have a better idea, please leave a message in the comment area. I look forward to hearing different voices.
TVC:GOLD FXOPEN:XAUUSD FOREXCOM:XAUUSD FX:XAUUSD OANDA:XAUUSD

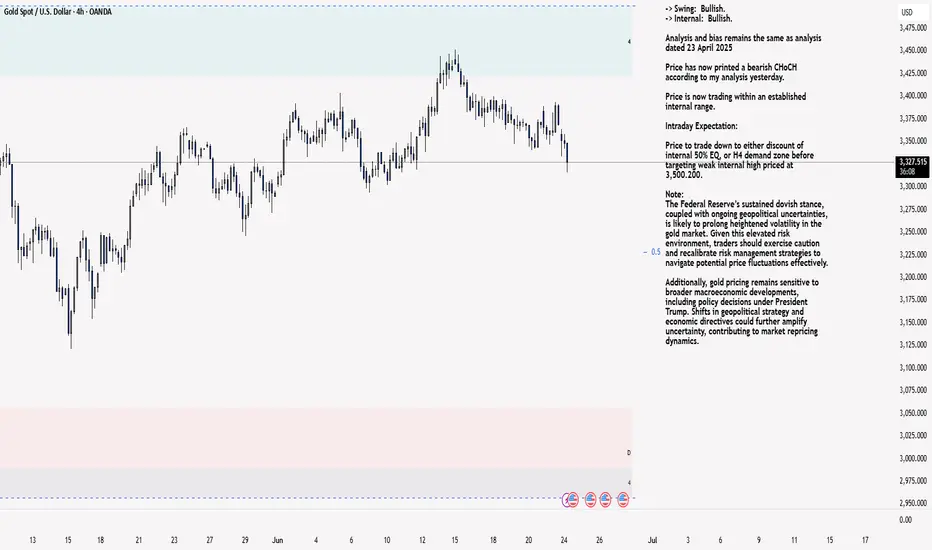
XAU/USD 24 June 2025 Intraday AnalysisH4 Analysis:
-> Swing: Bullish.
-> Internal: Bullish.
Analysis and bias remains the same as analysis dated 23 April 2025
Price has now printed a bearish CHoCH according to my analysis yesterday.
Price is now trading within an established internal range.
Intraday Expectation:
Price to trade down to either discount of internal 50% EQ, or H4 demand zone before targeting weak internal high priced at 3,500.200.
Note:
The Federal Reserve’s sustained dovish stance, coupled with ongoing geopolitical uncertainties, is likely to prolong heightened volatility in the gold market. Given this elevated risk environment, traders should exercise caution and recalibrate risk management strategies to navigate potential price fluctuations effectively.
Additionally, gold pricing remains sensitive to broader macroeconomic developments, including policy decisions under President Trump. Shifts in geopolitical strategy and economic directives could further amplify uncertainty, contributing to market repricing dynamics.
H4 Chart:
M15 Analysis:
-> Swing: Bullish.
-> Internal: Bullish.
Following previous high, and printing of bearish CHoCH, price has pulled back to an M15 supply zone, where we are currently seeing a reaction. Therefore, I shall now confirm internal high.
Price is now trading within an established internal range.
The remainder of my analysis shall remain the same as analysis dated 13 June 2025, apart from target price.
As per my analysis dated 22 May 2025 whereby I mentioned price can be seen to be reacting at discount of 50% EQ on H4 timeframe, therefore, it is a viable alternative that price could potentially print a bullish iBOS on M15 timeframe despite internal structure being bearish.
Price has printed a bullish iBOS followed by a bearish CHoCH, which indicates, but does not confirm, bearish pullback phase initiation. I will however continue to monitor, with respect to depth of pullback.
Intraday Expectation:
Price to continue bearish, react at either M15 supply zone, or discount of 50% internal EQ before targeting weak internal high priced at 3,451.375.
Note:
Gold remains highly volatile amid the Federal Reserve's continued dovish stance, persistent and escalating geopolitical uncertainties. Traders should implement robust risk management strategies and remain vigilant, as price swings may become more pronounced in this elevated volatility environment.
Additionally, President Trump’s recent tariff announcements are expected to further amplify market turbulence, potentially triggering sharp price fluctuations and whipsaws.
M15 Chart:
XAUUSD Breaks Trend – Deeper Correction Ahead?Gold (XAUUSD) has just broken below its rising H4 trendline and the key support zone around 3,340 – a strong signal for a potential short-term downtrend. A sharp bearish candle with high volume confirms sellers are now in control.
The 3,360–3,365 zone has flipped into resistance and may act as a retest area before further declines.
If price fails to hold 3,320,
the next targets are 3,300–3,280,
possibly down to 3,260.
Volume Profile indicates money is leaving the upper range, reducing the chance of a strong rebound.
Preferred strategy: wait for a pullback to 3,355–3,365,
set SL above 3,370,
and aim for TP at 3,300–3,280.
Caution: the Fed’s “higher for longer” stance and USD strength are applying pressure on gold. Long positions are risky at this stage. Monitor the 3,300 level closely for potential buyer reaction.

GOLD Intraday Chart Update For 24 June 2025Hello Traders, As you can see that GOLD fell sharply this morning due to Israel- Iran Cease fire scenario
Further more FED Chair POWELL Testifies Starts from Today and end on Tomorrow make sure to manage you trading accordingly
Right now GOLD is in Strong Bearish Trend only clear Breakout of 3368 level for the day below this market remains Bearish
All eyes on 3300 Psychological Digit for now if market breaks 3300 Successfully then it will move towards 3250 soon
Disclaimer: Forex is Risky

Gold, Will USA-Iran-Israel conflict affect it? The USA-Iran-Israel conflict can significantly impact gold prices. Gold is a safe-haven asset, so demand often rises during geopolitical tensions, pushing prices up
3406 gonna be first target for me, if it breaks this lvl with huge volume and FVG on 1h+ then most likely we will see ATH in near future
bearish scenario(lest likely) - price breaks down 3340 and close with nice volume and fvg on 1h+ which will open move all the way down to MO

Gold (XAU/USD) Analysis - 24 June 2025📊 4-Hour Chart: Supply & Demand Structure
1. 📐 Market Structure & Bias
Gold has bounced off the $3,340–3,350 demand area multiple times—confirming a strong support structure on the 4H timeframe .
Following this bounce, gold made a higher-low, reinforcing a bullish trend.
Overall bias remains bullish, as long as prices hold above the $3,340 region. A break below this zone may bring deeper correction.
2. 🔍 Demand Zones (Buy Areas)
Zone A – $3,340 to $3,350
Comes with trendline support and prior consolidation.
Volume and price action confirm institutional buying interest.
Zone B – $3,300 to $3,310
A more significant base zone for deeper pullbacks or additional liquidity running.
3. ⚠️ Supply Zones (Sell Areas)
Zone C – $3,380 to $3,390
Shallow zone where recent rallies have stalled—ideal for supply fade strategies.
Zone D – $3,400 to $3,410
Major resistance zone—historical retracement area with institutional selling.
🔍 1-Hour Chart: Intraday Entry Zones (Aligned with 4H Bias)
Below are premium-level intraday buy setups made for quick execution within the bullish structure:
Entry Type Zone ($) Description
1. Buy the Dip 3,340 – 3,345 Touches 4H demand + trendline — watch for bullish rejection wicks or volume pickup.
2. Quick Dip Buy 3,350 – 3,355 Opportunistic entry higher in demand zone — quicker reentries with lighter pullback.
3. Deep Bounce 3,300 – 3,310 For deeper intraday swings only—requires strong confirmation from lower timeframes.
(Optional) Sell Supply Fade 3,380 – 3,390 Aggressive fade only if strong price rejection appears—caution advised.
Tips for Entry Confirmation:
Look for bullish pin bars, engulfing candles, volume confirmation, or trendline bounces within these zones. Only trade entries with clear price action confirmation.
