Gold Spot / U.S. Dollar (XAU/USD) 2-Hour Chart2-hour chart from OANDA shows the price movement of Gold Spot (XAU/USD) against the U.S. Dollar. The current price is $3,344.210, reflecting a decrease of $24.965 (-0.74%). The chart highlights a recent upward trend with a shaded area indicating a potential price range between $3,324.354 and $3,380.000, with key support and resistance levels marked. The timeframe spans from June 12 to July 3, 2025.
Xauusdupdates

Gold is in the bullish direction after correcting the supportHello Traders
In This Chart GOLD HOURLY Forex Forecast By FOREX PLANET
today Gold analysis 👆
🟢This Chart includes_ (GOLD market update)
🟢What is The Next Opportunity on GOLD Market
🟢how to Enter to the Valid Entry With Assurance Profit
This CHART is For Trader's that Want to Improve Their Technical Analysis Skills and Their Trading By Understanding How To Analyze The Market Using Multiple Timeframes and Understanding The Bigger Picture on the Charts

Gold bottoms out and tests resistance, long positions at night📰 Impact of news:
1. Bowman hinted at a July rate cut
2. Fed Governor Kugler and FOMC permanent voting member and New York Fed President Williams hosted the "Fed Listening" event.
📈 Market analysis:
Gold will maintain a short-term volatile trend. Although the United States intervenes in the conflict between Iran and Israel, the geopolitical situation will affect the market trend to a certain extent. However, the remarks of Federal Reserve Board member Bowman hinting at a rate cut in July have eased market volatility to a certain extent. Gold maintains a narrow range of fluctuations at the 4H level, and the technical pattern is gradually adjusted. The K-line stands firmly on the short-term moving average. The short-term trend shows that it is necessary to observe the second opportunity for pull-up after the confirmation of the retracement. At the hourly level, the short-term moving average diverges upward, and the short-term volatile and strong pattern is maintained. In the evening, pay attention to the upper resistance area of 3395-3405, focus on the suppression of the 3405 line, pay attention to 3375-3365 below, and further pay attention to the 3345 support line if it breaks through.
🏅 Trading strategies:
SELL 3385-3395-3405
TP 3370-3365-3345
BUY 3375-3365-3355
TP 3390-3400-3405
If you agree with this view, or have a better idea, please leave a message in the comment area. I look forward to hearing different voices.
TVC:GOLD FXOPEN:XAUUSD FOREXCOM:XAUUSD FX:XAUUSD OANDA:XAUUSD

Conflict breaks out, risk aversion rises, can 3400 be broken?Bowman's dovish comments in the afternoon eased the market, by which time risk aversion was deepening as sudden geopolitical conflicts continued to deepen. Will the USA make a corresponding response to this matter? This series of events has once again put gold into a complicated situation. Can gold hit the 3,400 mark today?
Free trading strategies are updated daily🌐. All trading strategies released since this month have been verified and can serve as a good reference📈.👇 I sincerely hope that these strategies can be helpful to you👇.
OANDA:XAUUSD FX:XAUUSD FOREXCOM:XAUUSD FXOPEN:XAUUSD TVC:GOLD

Gold Spot / U.S. Dollar (XAUUSD) 2-Hour Chart2-hour candlestick chart displays the price movement of Gold Spot (XAUUSD) against the U.S. Dollar, with the current price at 3,373.97, reflecting a +5.99 (+0.18%) change. The chart highlights recent price trends, including a notable upward movement, with key support and resistance levels marked around 3,366.81 and 3,410.25, respectively. The time frame spans from approximately 6:00 AM to 3:35 PM CEST on June 23, 2025.

Gold opens high and moves lower, focus on 3340 support📰 Impact of news:
1. Federal Reserve Board member Bowman speaks on monetary policy and the banking industry
2. The United States intervenes in the Iran-Israel conflict and pays attention to the geopolitical situation
📈 Market analysis:
In the early Asian session, gold prices surged but failed to break through the key watershed of 3405. The current risk aversion conflict failed to break through the key resistance level, so the short-term trend is still weak and bearish. On the hourly chart, gold continues to retreat. As the current short-selling momentum continues to gain momentum, we will first look at whether the double bottom support of 3340 is effective. If it fails to break through while retreating, we can consider a short-term upward rebound in the support and consider going long. Looking at the second decline point at 3370-3375, unless the news stimulates the gold trend, you can still consider placing short orders if it touches the 3370-3380 line! On the whole, pay attention to the resistance line of 3370-3380 above and the support line of 3345-3335 below.
🏅 Trading strategies:
BUY 3350-3345-3335
TP 3360-3370-3380
SELL 3370-3380
TP 3360-3350-3345
If you agree with this view, or have a better idea, please leave a message in the comment area. I look forward to hearing different voices.
OANDA:XAUUSD FX:XAUUSD FOREXCOM:XAUUSD FXOPEN:XAUUSD TVC:GOLD

Gold Spot Price Trend Analysispresents a detailed analysis of the gold spot price trend against the U.S. dollar, captured over a four-hour interval. The chart displays a fluctuating pattern, with prices ranging from approximately $3,320 to $3,383.74 USD. A notable decline is observed, marked by a red box indicating a support level at $3,332.53, while a green box suggests a resistance level at $3,383.74. The current price stands at $3,353.94, with a slight decrease of 0.42%. The chart provides valuable insights for investors and traders seeking to understand the dynamics of the gold market.

XAUUSD and USOILHesitation Geopolitical factors have led to the escalation of relations between several countries. The Middle East is in chaos. Although this is a trading market, the relationship between the two is too close. This is why the Asian market XAUUSD reached a high of 3400.
But it is not stable. Because after the news that stimulated the rise in gold prices over the weekend, there were some negative news. For example, peace talks, time differences, negotiations and other factors have eased the tense atmosphere. Then the gold price fell with the trend, reaching a low of 3347.
From the overall situation, the market still has the momentum to rise in the short term. But this depends on Iran's response. Including the impact of the Strait of Hormuz. This is the key factor in the rise or fall of oil prices. Investors with larger funds can arrange long orders in advance.
The view on XAUUSD is to buy at low levels. The impact of geopolitics is too huge. On the basis of interest rate cuts, buying is the key to profit. But everyone's financial situation is different, so when trading, remember to control the position ratio. Prevent trading errors from leading to account liquidation.

Gold Short Term OutlookGold is currently trading around $3,368, caught between dynamic moving average resistance and an intraday resistance zone.
Price must break and hold above the $3,378 resistance to open the path toward $3,395. A confirmed break above the key $3,395 level could signal the start of the next bullish leg.
However, repeated failure to break above $3,395 — or even $3,378 — may drag gold lower into key support zones.
📌 Key Levels to Watch:
Resistance:
$3,375 • $3,395 • $3,418 • $3,439
Support:
$3,361 • $3,346 • $3,330 / $3,306
$3,287 – Critical demand zone
🧠 Fundamental Insight:
Gold remains supported amid rising geopolitical tensions. Over the weekend, U.S. airstrikes targeted Iranian nuclear sites, escalating concerns over a broader conflict in the Middle East. This has reignited safe-haven demand, with gold catching a bid despite recent technical pullbacks.
Meanwhile, traders are weighing softer U.S. inflation signals against the Fed’s cautious stance. If tensions persist and economic data weakens, gold could benefit from both risk-off flows and increased speculation around potential rate cuts.

Gold Medium Term OutlookGold is currently trending within a rising channel after rejecting the $3,439 resistance zone, which marked a new Higher High (HH). Price is respecting the ascending channel support and is now testing the 50MA. The uptrend remains intact, with a sequence of Higher Lows (HL) and Higher Highs (HH) forming within the channel.
A break and hold above $3,378 could open the path for a re-test of $3,439 and potentially $3,501. However, failure to hold the rising channel support may shift momentum bearish, with $3,303 and $3,226 as the next major downside targets.
📌 Key Levels to Watch This Week:
Resistance: $3,378 • $3,439 • $3,501
Support: $3,303 • $3,226 • $3,171
🧠 Fundamental Insight:
Gold remains supported amid rising geopolitical tensions. Over the weekend, U.S. airstrikes targeted Iranian nuclear sites, escalating concerns over a broader conflict in the Middle East. This has reignited safe-haven demand, with gold catching a bid despite recent technical pullbacks.
Meanwhile, traders are weighing softer U.S. inflation signals against the Fed’s cautious stance. If tensions persist and economic data weakens, gold could benefit from both risk-off flows and increased speculation around potential rate cuts.

GOLD Intraday H1 Chart Update For 23 June 25 GOLD Intraday Chart show mid term Bearish move for now
For Today keep an eyes on 3368 level Breakout for Buy Scalping for long trade we may wait for dip around 3330-3340 zone SL remains possibly 100 pips
As long as market sustains below 3400 Psychological Level it will remains Bearish and will try to move towards 3200-30 Psychological

Gold (XAU/USD) 4H Analysis-23 June 2025Gold (spot XAU/USD) is currently trading around $3,358. On the 4-hour chart, price has been range-bound between $3,356 and $3,400. Recently, gold attempted to break higher (up to around $3,394) but quickly reversed — a sign that the breakout may have been a smart money trap. Technically, the structure saw a break below $3,380 in mid-June, leading to a push toward the $3,323 region. This reflects a short-term bearish wave followed by stabilization near the lows.
Bias: The market is currently neutral-to-bullish, depending on key supports. As long as price holds above the $3,322–$3,330 swing-lows, dips are considered buying opportunities. Notably, an order block/demand zone around $3,357–$3,360 appears to be holding well and attracting buyers. On the upside, $3,400 acts as a strong resistance level. A break above $3,400 would shift the bias firmly bullish, while a break below $3,338 would suggest bearish momentum returning.
🔑 Key 4H Support & Resistance Levels
Resistance:
• $3,400 – Major round number and recent high
• $3,434–$3,435 – Next resistance above $3,400
• $3,451–$3,452 – Recent swing top
• $3,500 – All-time-high level
Supply Zone:
• $3,388–$3,394 – Minor resistance and previous support turned supply
Demand Zone (Order Block):
• $3,357–$3,360 – Major 4H demand area showing strong buyer interest
Support:
• $3,338 – Critical support level below the order block
• $3,322–$3,323 – Multi-source key swing support
• $3,280–$3,300 – Lower targets if support fails
• $3,260 or below – Worst-case downside projection if breakdown accelerates
📈 1-Hour Intraday Trade Setups
Buy the Dip
• Entry: $3,357–$3,360
• Confirmation: Bullish reversal candle on 1H
• Stop Loss: Below $3,336
• Targets: $3,380 → $3,400
Sell a Rejected Rally
• Entry: Near $3,400 (only if clear rejection is seen)
• Confirmation: Bearish reversal candle or price stalling
• Stop Loss: Above $3,400
• Targets: $3,360 → $3,330
Breakdown Short
• Entry: If price breaks below $3,338 with strong 1H close
• Stop Loss: Above $3,345
• Targets: $3,323 → $3,300
Bullish Breakout Trade
• Entry: Break and retest above $3,400
• Confirmation: Clean 1H close above $3,400
• Stop Loss: Just below $3,400
• Targets: $3,434 → $3,452
✅ Final Takeaway
Gold is currently trading inside a $3,330–$3,400 range. The best intraday opportunity is to buy dips into the $3,357–$3,360 demand zone with a stop below $3,330, targeting $3,400+. If support breaks, flip to short toward $3,320–$3,300.

Gold Spot / U.S. Dollar (XAU/USD) 4-Hour Forex Chart4-hour forex chart displays the price movement of Gold Spot (XAU) against the U.S. Dollar (USD) from late June to early July 2025. The chart shows a recent price of 3,377.73 USD, with a slight increase of +9.76 (+0.29%). The candlestick pattern indicates a downward trend following a peak, with a highlighted resistance zone around 3,400 USD. The chart includes a 4-hour timeframe and key price levels ranging from 3,330.00 to 3,400.00 USD.

XAUUSD Golden LEVELSMarket Overview
📈 TCL (Trend Change Level): 3330
📊 WIMP (Weekly Important Mid-Price): 3403.2
Update: Prices have closed above 3368.60. This shifts the bias for order blocks: those entirely above this level are now considered bearish, and those entirely below are bullish.
📌 Market Outlook for Monday
Our observation from Friday's New York session is crucial: the high was not even close to Thursday’s high. This implies that price failed to go above the **3276–3278** range.
**Expectation:** We anticipate that Friday’s low will be broken during Monday's NY session, signaling potential further downside.
🔍 Key Support Zone
We expect prices may find strong support around the **3312 – 3320 – 3324** range.
If this support holds, the market may head towards the key weekly level of **3403.2**.
⚠️ Price Behavior at 3403.2 – A Critical Juncture
If **3403.2** is reached during the Asian session or London session, it could present a good shorting opportunity on Monday.
If the price doesn't break **3403.2** during early sessions, then we expect this level to be taken out by Wednesday's NY session.
📊 Order Blocks – Zones to Watch
Understanding these institutional areas of interest can provide valuable insights into potential reversals or continuations.
Timeframe Order Block Zones Bias
H1 3352–3340 Bullish
H1 3330–3319 Bullish
H1 3308–3294 Bullish
H1 3452–3432 Bearish
H1 3395–3389 Bearish
H1 3368–3379 Neutral
H4 3452–3430 Bearish
H4 3320–3293 Bullish
H4 3342–3318 Bullish
H4 3375–3338 Neutral
D1 3424–3500 Bearish
D1 3240–3121 Bullish
D1 3019–2953 Bullish
📝 Important Notes for Your Trading Plan:
Always pay close attention to session-wise reactions, especially around the 3403.2 level.
Remember that bearish or bullish biases for order blocks are clearly indicated for each specific timeframe.
These identified zones are critical turning points that can significantly aid your trade planning.

XAU/USD Bearish Pattern Analysis XAU/USD Bearish Pattern Analysis 📉
The chart presents a potential bearish continuation setup in the XAU/USD pair, highlighted by technical structures and key price levels:
📊 Technical Breakdown:
🔸 Bearish Rejection from Resistance
Price rejected strongly from the 3,440.000 resistance zone, marked with a red arrow.
This area has acted as a historical supply zone, triggering repeated reversals.
🔸 Descending Channel Formation 📉
A clear bearish flag/channel structure is visible post-rejection.
Price action broke down from the channel, signaling potential trend continuation.
🔸 Target Level 🎯
The expected target is around 3,304.374, aligning with previous support zones and structure lows.
This level coincides with a measured move from the channel breakdown.
🔸 Higher Lows Pattern Before Reversal ⭕
Prior to the current decline, the market formed a series of higher lows, highlighted with orange circles — suggesting a buildup before reversal.
🧭 Key Levels to Watch:
Resistance: 3,440.000 – 3,420.000 🔼
Current Price: 3,368.750
Short-Term Target: 3,304.374 🎯
Major Support: 3,140.000 – 3,160.000 🛡️
📌 Outlook:
The rejection from resistance coupled with the descending channel breakdown indicates bearish momentum. If the market maintains below the recent high, further downside towards 3,304 is expected. Break below this may expose deeper support zones.
📉 Bias: Bearish
⏳ Short-term Action: Watch for breakdown confirmation and momentum continuation.

GOLD[XAUUSD]: Breakthrough the bearish pressure, What next?Evening Everyone,
Hope you are doing great, price recently breakthrough the current price inducement, showing a strong bullish volume emerging in the market. Long term approach remain bullish ultimately taking the price towards the new high.
Good luck
Team Setupsfx_

XAUUSD Trading Signals: Buy Dips at 3335-3345 Amid Bear Trap💡 Trading Framework In-Depth Analysis:
The Fed's policy statement failed to stir volatility (markets had fully priced in dovish expectations 💨);
Weekly market pattern: Asian sessions consistently saw rallies 📈, followed by profit-taking pullbacks in subsequent sessions 📉;
Tactical entry logic: Use intraday highs in Asian trading as resistance references for long positions 🎯.
📊 Technical Validation & Risk Anchors
⚠️ Key Warning: Geopolitical bullish signals ignored → classic "bear trap" characteristics (bear trap 🚫);
⏳ Timing Strategy: Asian session highs form ideal resistance levels—recommend entering on pullbacks to the 38.2% Fibonacci support level 🎯.
⚡️⚡️⚡️ XAUUSD Precision Trading Signals ⚡️⚡️⚡️
🚀 Long Entry Range: 3335-3345 (stop loss can be set below 3325)
🚀 Take-Profit Target Range: 3360-3370 (partial profit-taking at first target 3360 recommended)
📢 Service Value-Added Notes
✅ Core trading signals updated daily in the morning (validated across 4-hour/daily double-timeframes);
✅ Refer to signal logic at any time during trading for sudden situations 🧭 (with historical win-rate statistics attached);
🌟 Wishing you smooth trading Next week — seize pullback opportunities to position 👇
GOLD H4 Chart Weekly Update For 23 - 27 June 25Hello Traders,
welcome to the weekly update, as you can see that market was in range last week
as for now 3400 Psychological remains in focus if market breaks 3400 successfully the GOLD will rise towards 3440
only breaks below 3330 GOLD will leads towards 3250 possibly
FED Chair Powell Testifies due in the upcoming week
USPCE PRICE INDEX due on Friday
Disclaimer: Forex is Risky

The rebound is weak, is it expected to continue to decline? 📰 Impact of news:
1. Geopolitical situation
2. Pay attention to the impact of short-term trends of the US dollar and silver on gold
📈 Market analysis:
The weekly level large range sweep is still going on, with a focus on the space defense dividing line area of the 10-day moving average and the 3315-3310 area. After falling back to the lifeline in four hours, it continued to bend downward under pressure. During the sweeping decline, the suppression became more obvious. Whether there will be a wave of large-volume market, the pattern is expected to further open and guide the direction. In this process, note that the lifeline 3375 is also the resistance point determined by the last rebound last night. Use this as suppression to sweep the range below. On the whole, for the future gold, if it can maintain the rhythm of defending highs and breaking lows, and successfully closes at a low level today, then next week it is expected to further switch downwards to sweep space. Therefore, we will continue to focus on two support areas, one is 3345-3335, and the other is 3315-3310 after breaking
🏅 Trading strategies:
BUY 3345-3335
TP 3355-3365
SELL 3365-3375
TP 3345-3335-3315
If you agree with this view, or have a better idea, please leave a message in the comment area. I look forward to hearing different voices.
TVC:GOLD FXOPEN:XAUUSD FOREXCOM:XAUUSD FX:XAUUSD OANDA:XAUUSD

Elliott Wave Analysis – XAUUSD Trade Plan for June 19, 2025🌀 Wave Structure
On the H4 timeframe, following a strong selloff, price is now consolidating within a narrow price channel — suggesting that we are currently in wave b (black) of an abc correction.
This structure implies that one more leg down is likely to complete wave c (black). However, due to the overlapping and sideways nature of the move, it's difficult to clearly identify the end points of waves a and b, making traditional Fibonacci targeting less effective.
➡️ To improve accuracy, we’re combining Volume Profile data with price action and have identified four key support zones:
3349, 3335, 3313, and 3297
Among these, we’re giving special attention to:
🎯 Target 1: 3335
🎯 Target 2: 3297
We'll wait for bullish momentum signals near these levels to increase the probability of catching the end of wave c.
🔋 Momentum Outlook
Daily (D1): Momentum is about to enter oversold territory. By the end of today or tomorrow, the daily candle is expected to confirm this — suggesting a weakening bearish trend.
H4: Also approaching oversold. If price is hovering around one of the key support levels (3349 | 3335 | 3313 | 3297) when this happens, and the D1 is already oversold, then we may be looking at a high-probability reversal zone.
H1: Nearly oversold as well — expect a short-term bounce soon. The best timing for a BUY will be when the H1 starts turning bullish while both the D1 and H4 are oversold.
✅ Trade Setup
🔹 Scenario 1
BUY ZONE: 3336 – 3333
SL: 3326
TP1 | TP2 | TP3: 3345 | 3378 | 3402
🔹 Scenario 2
BUY ZONE: 3300 – 3297
SL: 3290
TP1 | TP2 | TP3: 3313 | 3345 | 3402
⏳ Patience is key — wait for confluence between support zones and momentum reversals. That’s where the high-probability BUY setups emerge.

XAUUSD: Is Bullish Trend Ended? Or It is just beginning big moveAs we previously stated that price can reverse between 3340 to 3350 region, which was a pivotal point for bulls. Price smoothly moved currently trading at 3376 and possibly bullish move continuing towards 3400,3450 and ultimately reaching 3600.
Following the price’s all-time high at $3500, it experienced a sharp decline and failed to maintain that level. A substantial 2400 pips would have resulted in significant losses for many accounts. Initially, it was perceived as a minor correction, with the expectation of further price appreciation. However, this assumption proved incorrect. After reaching an even higher peak, the price invariably undergoes a more substantial correction.
At 3260, substantial bullish volume surged into the market, necessitated by the presence of a fair value gap. Subsequently, the price experienced a decline, reflecting the prevailing bearish trend, which favoured the bears. However, at 3200, a pivotal level representing a discounted price point, bull volume surged. This powerful bullish impulse propelled the price to 3432, ultimately confirming the bullish trend. AB=CD there recurring pattern emerged weekly. When the price reached the 3432 level as a fair value gap, the CD pattern commenced.
AB=CD we have identified a recurring pattern. It appears to be an equal move in any direction, and it has manifested precisely as anticipated. We were aware that the price would reject at 3120, and it did so accordingly. Currently, the market is in our favour. Upon market opening, it exhibited a positive gap, propelling the price to 3450. However, it subsequently declined, reaching 3384.
Presently, we find ourselves in the accumulation phase, poised for distribution. This distribution is anticipated to be substantial, potentially leading to another record high, potentially reaching 3650.
Moving forward, the price could continue towards our target from its current position. Alternatively, there exists a possibility that it may drain the sell-side liquidity and reverse from 3360-3370.
Our take-profit levels are set at 3450, 3490, 3520, and finally, 3600. When entering the market, it is advisable to employ a short time frame. It is important to note that this analysis is merely our opinion, and market conditions may deviate from expectations.
We extend our best wishes for success and safe trading. If you wish to demonstrate your support, you may consider liking, commenting, or sharing this analysis with others.
Sincerely,
Team Setupsfx_

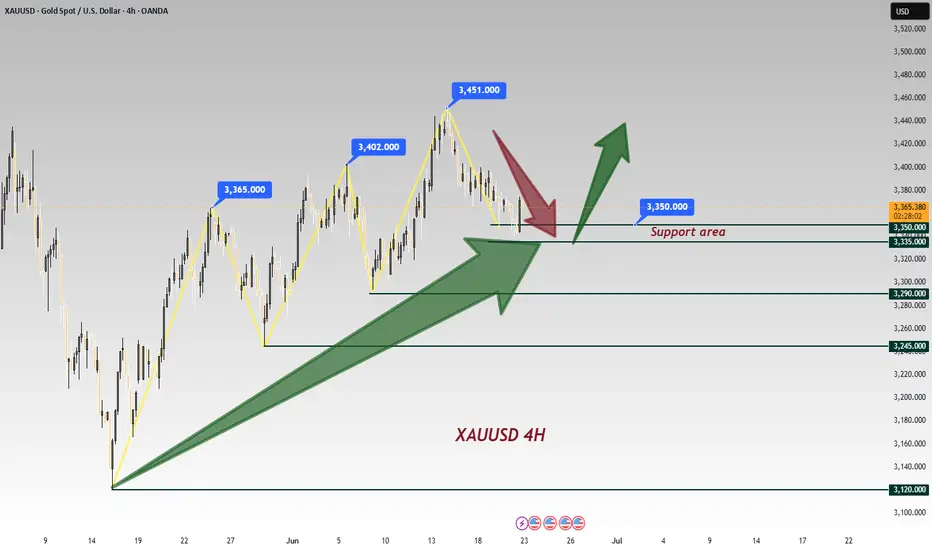
Gold Pullback: Bear Trap or Buy Dip?📊 Chart Analysis: A clear pullback within the established uptrend is visible, testing key support at —a healthy correction that reinforces the bullish structure.
🔍 News Contradiction🌍: Despite escalating Middle East tensions (typically a gold-positive catalyst), prices are trending lower—a classic bear trap scenario 🚫📉. This divergence underscores the importance of buying dips amid emotional sell-offs.
💡 Trading Framework:
Fed policy statement yesterday failed to spark volatility, as markets had already priced in dovish expectations 💨;
Weekly pattern: Asian sessions have consistently seen rallies 📈, followed by profit-taking pullbacks in later sessions 📉;
Tactical entry: Use intraday highs from Asian trading as resistance references for long positions 🎯.
Technical Confirmations:
Risk Warning: Geopolitical bullish signals being ignored suggests deliberate bearish manipulation (bear trap 🚫);
Timing Strategy: Asian session highs serve as ideal resistance markers—look to enter on retracements to 38.2% Fib levels 🎯
⚡️⚡️⚡️ XAUUSD ⚡️⚡️⚡️
🚀 Buy@ 3335 - 3345
🚀 TP 3360 - 3370
Accurate signals are updated every day 📈 If you encounter any problems during trading, these signals can serve as your reliable guide 🧭 Feel free to refer to them! I sincerely hope they'll be of great help to you 🌟 👇

Trade Idea: Long on XAUUSD (15min)Trade Idea: Long on XAUUSD (15min) OANDA:XAUUSD
I'm going long on gold after spotting a liquidity sweep below the previous low. Price aggressively grabbed liquidity from the downside and showed a bullish reaction — a clear sign of smart money accumulation.
The market structure remains bullish on higher timeframes, and this entry aligns with a potential trend continuation after a stop-hunt move. The entry is placed just after the liquidity grab, aiming for a clean upside move toward the imbalance and minor resistance zone.
🟢 Entry: 3353.30
🔴 Stop Loss: 3350.67 (Below liquidity sweep)
🎯 Take Profit Zone: 3362–3366
🧠 RR Ratio: Favorable
#XAUUSD #Gold #SmartMoneyConcepts #LiquiditySweep #TrendFollowing #PriceAction #ForexTrader #GoldTrading #OrderBlock #SupplyAndDemand #SwingTrade #DayTrading #MarketStructure #ForexAnalysis #TradingView #RiskReward
