Gold Spot / U.S. Dollar (XAU/USD) 4-Hour Chart4-hour candlestick chart displays the price movement of Gold Spot (XAU) against the U.S. Dollar (USD) from late June to mid-July 2025. The current price is $3,385.30, with a slight increase of $0.66 (+0.02%). The chart highlights a recent upward trend, with a resistance level around $3,420.58 and a support level near $3,370.10, as indicated by the shaded zones.
Xauusdupdates

GOLD Intraday Chart for 17 June 25Hello Traders,
as you can see that market was going down very badly and it's actually stuck below 3400 Psychological Level
Definitely we are sellers now as long as market sustain below 3400 Psychological Level
below 3380 level GOLD will move towards 3360 or even 3350
Disclaimer: Forex is Risky

XAU/USD 17 June 2025 Intraday AnalysisH4 Analysis:
-> Swing: Bullish.
-> Internal: Bullish.
Analysis and bias remains the same as analysis dated 23 April 2025
Price has now printed a bearish CHoCH according to my analysis yesterday.
Price is now trading within an established internal range.
Intraday Expectation:
Price to trade down to either discount of internal 50% EQ, or H4 demand zone before targeting weak internal high priced at 3,500.200.
Note:
The Federal Reserve’s sustained dovish stance, coupled with ongoing geopolitical uncertainties, is likely to prolong heightened volatility in the gold market. Given this elevated risk environment, traders should exercise caution and recalibrate risk management strategies to navigate potential price fluctuations effectively.
Additionally, gold pricing remains sensitive to broader macroeconomic developments, including policy decisions under President Trump. Shifts in geopolitical strategy and economic directives could further amplify uncertainty, contributing to market repricing dynamics.
H4 Chart:
M15 Analysis:
-> Swing: Bullish.
-> Internal: Bullish.
Following previous high, and printing of bearish CHoCH, price has pulled back to an M15 supply zone, where we are currently seeing a reaction. Therefore, I shall now confirm internal high.
Price is now trading within an established internal range.
The remainder of my analysis shall remain the same as analysis dated 13 June 2025, apart from target price.
As per my analysis dated 22 May 2025 whereby I mentioned price can be seen to be reacting at discount of 50% EQ on H4 timeframe, therefore, it is a viable alternative that price could potentially print a bullish iBOS on M15 timeframe despite internal structure being bearish.
Price has printed a bullish iBOS followed by a bearish CHoCH, which indicates, but does not confirm, bearish pullback phase initiation. I will however continue to monitor, with respect to depth of pullback.
Intraday Expectation:
Price to continue bearish, react at either M15 supply zone, or discount of 50% internal EQ before targeting weak internal high priced at 3,451.375.
Note:
Gold remains highly volatile amid the Federal Reserve's continued dovish stance, persistent and escalating geopolitical uncertainties. Traders should implement robust risk management strategies and remain vigilant, as price swings may become more pronounced in this elevated volatility environment.
Additionally, President Trump’s recent tariff announcements are expected to further amplify market turbulence, potentially triggering sharp price fluctuations and whipsaws.
M15 Chart:

XAUUSD: The beginning of range trading.Last week, I perfectly predicted the sharp rise in the market. At the beginning of this week, XAUUSD reached a high of 3451, which is the front pressure position. Due to the cooling of risk aversion in the international market, the New York market fell back to 3373 on Monday.
XAUUSD did experience a typical "news-driven callback", and the analysis of technical and fundamental aspects is very critical. The following is a professional analysis and operation suggestions for the current market:
Key points and technical structure
1. Pressure level: 3450 area
- The previous high pressure is effective. This is the resonance resistance area of the upper track of the daily level channel + Fibonacci 61.8% retracement level, and the demand for long profit-taking is concentrated.
2. Support level: 3370-3380 area
- Currently falling back to 3373, here is:
- 50-day moving average dynamic support
- 4-hour chart previous low level support platform
- Fibonacci 38.2% retracement level
- If the daily closing is above 3380, the technical structure is still a healthy correction.
News-driven logic
- Negative factors:
Geopolitical situation and peace talks ➜ Risk aversion cools down ➜ Gold's attractiveness as a safe-haven asset decreases.
- Potential risks:
The progress of peace talks may be repeated (such as the situation between Israel and Hamas and Russia and Ukraine). If the negotiations fail, safe-haven buying will return quickly. Need to keep an eye on news sources.
Key signals for long-short game
Long signal: long lower shadow candlestick appears in 3370 area, US dollar index (DXY) falls below 105.0
Short signal: rebound fails to break through 3400 integer mark, US bond yield rises above 4.3%
Trading strategy suggestion
- *Long order opportunity*: 3370-3380 light position to try long, stop loss 3355 (below the previous low), target 3400/3420.
- *Short order opportunity*: 3415-3425 to arrange short orders in batches, stop loss 3440, target 3390.
2: Break down
- Trigger condition: daily closing price <3365
The callback is upgraded to a deep correction
- Target: 3340→ 3300 (psychological barrier + trend line support)
- Operation: Chasing short needs to wait for a rebound to around 3400, stop loss 3420.
3: Restart the rise (probability 10%)
- Trigger condition: Break through 3440 and stand firm for 1 hour
- Possible driving force: Geopolitical conflict escalates/Fed rate cut expectations rise
- Target: 3480 (historical high psychological resistance) → 3500
- Operation: After breaking through 3440, step back to 3425 to chase longs, stop loss 3405.
Key event risks this week
1. Wednesday: US May CPI data (core CPI expected to be 3.5%)
- If data > expectations: expectations of rate hikes rise → bearish for gold
- If data < expectations: expectations of rate cuts come earlier → bullish for gold
2. Thursday: Fed interest rate decision + Powell press conference
- Pay attention to the dot plot's hints on the number of rate cuts in 2024 (current market pricing is about 2 times)
3. Geopolitical headlines: progress in the Iran nuclear agreement, black swan risks in the French election
Position management principles
1. Total risk exposure ≤ 5% of account net value
2. Reduce positions by 50% 3 hours before key events (avoid instantaneous fluctuations in CPI/FOMC)
3. Breakout strategy stop loss setting: 15 points outside the previous high/low to prevent burrs
Conclusion: The effectiveness of the current 3373 support needs to be verified by Wednesday's CPI data. It is recommended that the London market operate in the 3370-3420 range and reduce positions before the US market to wait for data guidance. If you hold long positions, 3380 is the last line of defense; if you hold short positions, consider taking profits in batches above 3400. The medium-term bullish trend of gold has not been broken, but the risk aversion premium needs to be digested in the short term.
If you need a more detailed entry point analysis or position management to solve your long-term loss problem, please feel free to tell me your trading cycle and risk preference, and I will provide you with a customized strategy.

Gold (XAU/USD) 4H Technical Outlook-17 June 2025Gold’s 4-hour chart shows a clear uptrend: price is making higher highs and higher lows, trading above key moving averages and an upward trendline
Analyst ManiMarkets notes “a remarkably robust and sustained uptrend… printing higher highs and higher lows” since late 2024. The nearest major hurdle is around the $3,500 all-time high.
The current structure remains bullish: we have not seen a sustained break of the uptrend, so the overall bias is bullish. In Smart-Money terms, recent price action shows no bearish break of structure on 4H (no BOS), and price is simply consolidating near highs – a bullish sign.
Key zones to watch:
Demand/Order Block (~$3,374–3,380): Around $3,375 is a swing-low and past demand area. It lines up with the 4H EMA50 and 1H EMA200, a classical support confluence.
A strong bullish “order block” (heavy buying zone) sits here – a typical smart-money support area.
Pivot Point (~$3,389): Using the classic pivot formula
On the recent 4H range gives Pivot ≈ 3,389. This acts as a short-term balance point.
Resistance (≈$3,400–3,405): Gold has multiple prior highs around $3,400–3,405 (e.g. the overnight high ~$3,405 and the last swing high ~$3,405) which have been repeatedly tested. Traders are watching a break above ~$3,405 for follow-through. (A recent idea noted gold “bounced off support” near $3,390 and is “looking for a clean sweep of the highs at 3405”.)
Major Resistance ($3,500): The all-time peak around $3,500 is a big psychological barrier.
We expect stiff supply if price approaches 3,500.
Using these levels, the pivot-based support and resistance on the 4H chart are:
Pivot Point: ~$3,389
R1: ~$3,406 (Pivot + 1×range)
R2: ~$3,421 (Pivot + 2×range)
R3: ~$3,437 (Pivot + 3×range)
S1: ~$3,374 (Pivot – 1×range)
S2: ~$3,357 (Pivot – 2×range)
S3: ~$3,342 (Pivot – 3×range)
(These are rough levels using the standard formula on the last 4H high/low.)
Beyond numbers, price-action is key: we look for bullish patterns at support (e.g. bull-engulfing or pin-bar at ~$3,375–3,380) and cautious action near resistance. A brief “liquidity grab” happened at the $3,375 area recently (price wiggled below and then shot back up), which in Smart-Money jargon sweeps stops.
That suggests larger players may have been absorbing buying interest. In short, the tape looks healthy for bulls unless $3,375 breaks decisively. A break of the $3,400–3,405 highs would be a bullish BOS (break of structure), targeting the next supply zone.
Trade Setups (1H, Aligned with Bullish Bias)
Below are three high-probability long setups on the 1-hour chart (in line with the 4H uptrend).
Each is sized for a ~$10 stop from the entry zone.
Buy near $3,374–3,380 (Demand Zone):
Entry: $3,374–3,380 area (around Pivot S1 and the recent swing low).
Direction: Buy.
Stop: ~$3,364 (just below this zone, ~$10 lower).
Targets: ~$3,402 (near Pivot R1/previous high), and then ~$3,420 (around next resistance).
Reason: This zone is a confluence of support – it was a recent 4H low and aligns with EMAs (1H EMA200/4H EMA50)
It acts like a “bull order block” where buyers stepped in
A strong bounce from here keeps the bullish structure intact.
Trigger: Look for a bullish reversal candle on 1H (e.g. an engulfing or pin-bar) forming near $3,375. This confirms rejection of lower prices and signals a buy setup.
Chart: Example 1H gold chart. Blue shaded area marks the ~$3,374–3,380 buy zone (Pivot S1/EMA support). A bullish reversal candle here would trigger a long entry, targeting $3,402 then $3,420.
Buy break-&-retest at ~$3,402–3,408:
Entry: After a close above ~$3,405, look to buy on a pullback into $3,402–3,408 (just above the old high).
Direction: Buy.
Stop: ~$3,392 (about $10 below the entry zone).
Targets: ~$3,430 (next swing high) and ~$3,450 (round level/upper channel).
Reason: A decisive move above ~$3,405 would mark a BOS (break of the prior high), shifting structure higher. That resistance then becomes support on a retest. This is a classic “breakout retest” entry. (As noted, highs around 3,405 have been tested repeatedly, so breaking them signals strength.)
Trigger: Wait for a 1H candlestick to close firmly above 3,405, then buy on the next pullback into the $3,402–3,408 range with a bullish candle or dip-buy signal.
Buy on pullback to ~$3,385–3,390 (minor higher low):
Entry: $3,385–3,390 if price dips but holds above the 4H pivot (~3,389).
Direction: Buy.
Stop: ~$3,375 (below the entry zone, about $10 down).
Targets: ~$3,420 and ~$3,450 (same as above levels).
Reason: If the market skips Setup 1 and 2, any 1H pullback that still holds above the pivot (creating a higher-low) is another opportunity. Buying this higher-low keeps us aligned with the 4H uptrend. Essentially, we allow price to re-test the pivot area as new demand.
Trigger: A bullish reversal pattern on 1H in the $3,385–3,390 area (for example, a hammer or bullish engulfing) would mark a higher-low and signal a long entry.
Each setup has a tight stop (~$10) just beyond the support zone, and logical profit targets at nearby resistance levels. All assume the 4H trend stays intact. If support fails (e.g. a clean break under $3,374), be ready to reassess.
Takeaway: Gold’s 4H trend is bullish, so focus on buying dips into identified support zones (not shorting). Use tight stops beyond those zones and aim for the next resistance. In practice, that means looking to go long around ~$3,375–3,380 and ~$3,405 (on a clean breakout), riding any bullish continuation toward $3,430–$3,450, while managing risk at each step.

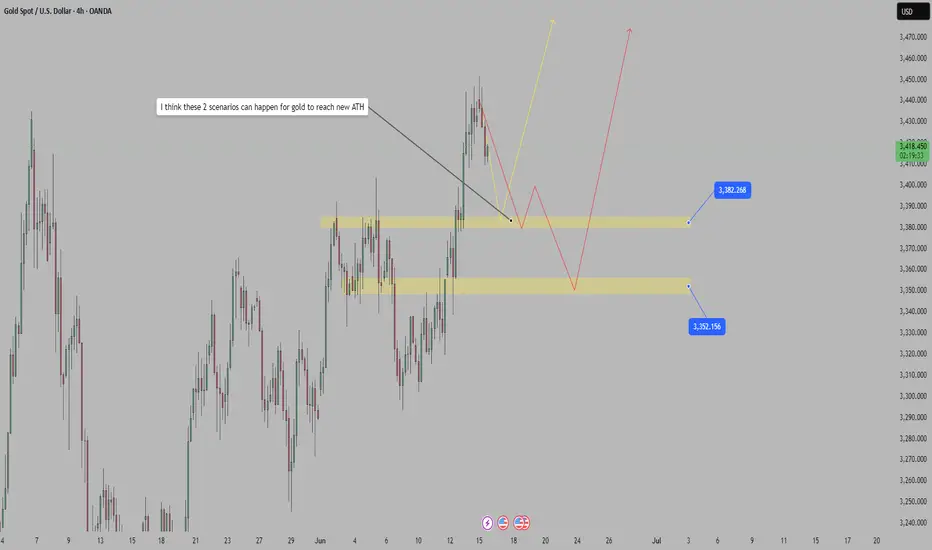
I think these 2 scenarios can happen for gold to reach new ATHGold supported by Israel-Iran conflict, US intervention in focus
Gold's sharp rise came late last week after Israel struck multiple targets in Iran, including Tehran's nuclear facilities.
The attack sparked fierce retaliation from Iran, which launched a barrage of missiles at key Israeli targets, including the financial capital Tel Aviv. Some of the Iranian missiles were also seen penetrating Israel's "Iron Dome" defense system.
What do you think?
Best regards, StarrOne !!!
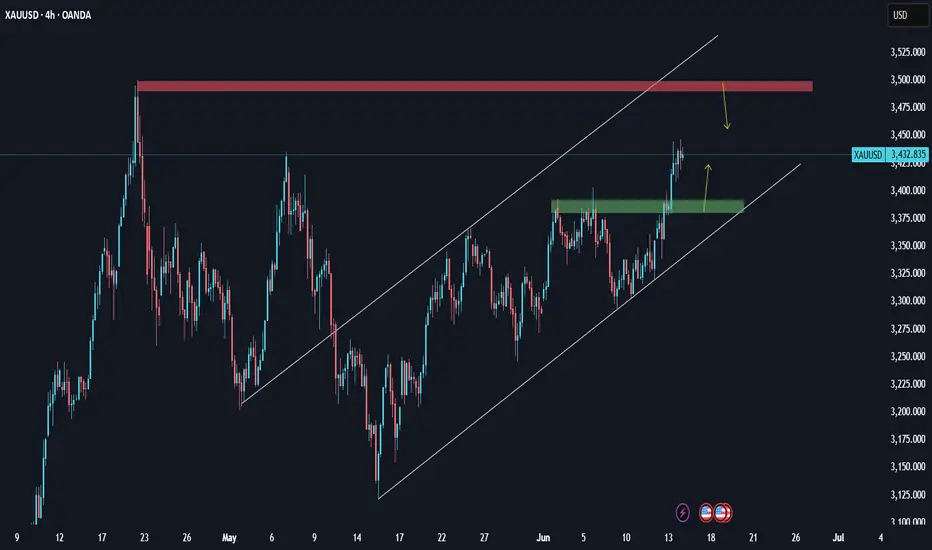
XAUUSD: Analysis H4 next weekThe continued tension in the Middle East (Israel–Iran) has led to a flight to safe havens, a key driver for gold.
Reduced pressure from the USD due to expectations that the Fed will slow down its rate cut (~September), coupled with inflationary pressures, could support gold prices
If tensions in the Middle East do not ease next week, gold's rally could extend and we could see 3500. But be careful, as if tensions ease and some good news from the USD comes, the rally could be halted.
After breaking KEY DAY yesterday, it is very likely ATH in weekGold prices are being directly affected by the Israel-Iran tensions, the risk of trade conflicts due to the new US tariff policy, and concerns about slowing global economic growth. However, gold prices suddenly fell in the context of improving risk appetite of investors as they get used to the "new normal".
Daniel Pavilonis, senior commodities broker at RJO Futures, commented that if this rally starts to lose momentum, it could be a double top pattern for gold. Giving advice to investors, according to Mr. Pavilonis, they should start considering reducing their gold position at this time if they missed the opportunity to take profits at $3,509. When gold is peaking, investors see other markets moving higher, such as silver, platinum and palladium.
Best regards, StarrOne !!!

XAUUSD Bouncing back to 3450?3380.27, 3383.94 and 3386.08 three daily consecutively candlestick patter with continuted series of higher low formed the daily support. Previous daily candle just closed at support with an ATR of 1.1ATR, which is quite large in the opposite direction of the major trend while the price is trading above 10ema in the daily.
In 4h there is also 3 ATR ( overall) bearish move is spotted giving a high probability for this market to bounce back to the daily resistance to the major direction of the trend.
We have a buy position at this level and will keep you posted for more updates!

Fed Rate Decision May Trigger a Decline in Gold PricesDespite heightened tensions in the Middle East providing safe-haven support, gold failed to break through the 3450–3455 resistance zone today and instead pulled back to the 3400–3386 support area.
This decline was mainly driven by two factors:
Iran expressed willingness to resume nuclear talks, easing geopolitical tensions and weakening safe-haven demand.
Growing expectations that the Fed will keep rates unchanged this week strengthened the DXY, reducing gold's appeal.
That said, inflation concerns persist, offering medium-term support to gold. On the technical front, the 3378–3340 consolidation zone may serve as secondary support, while stronger trend support lies in the 3310–3289 range—a level that may only be tested under extreme bearish conditions.
For now, the primary support to watch is 3386–3373, with short-term rebound resistance around 3400–3420.
Trading Suggestion:
Ahead of the Fed’s rate decision tomorrow, consider buying on dips, as today’s decline may lead to a technical rebound. Then reassess the market’s response to key support and resistance levels to determine further action.

3400 3380 are the two points that determine the trend of gold📰 Impact of news:
1. Geopolitical risks
2. Expected Fed policy
📈 Market analysis:
This week, the Federal Reserve's policy meeting, retail sales data, initial jobless claims and geopolitical situation will be the core factors affecting global markets. In the short term, gold rebounded after hitting the 3383 line. This round of decline was relatively rapid. At the same time, there is a certain resistance at the 3405-3410 line above in the short term, which is also the main reason for our long orders to leave the market. In the short term, it is recommended to first look at the support situation at the 3380 line below, and then enter the long order after obtaining effective support above this position. On the contrary, if it falls below this short-term support, the gold price is expected to fall to the 3350 mark! For the evening layout, it is recommended to focus on the 3400 long-short watershed, pay attention to the 3410 line of resistance, and pay attention to the 3380 line of support below.
🏅 Trading strategies:
BUY 3390-3380
TP 3400-3410-3420
SELL 3400-3390
TP 3380-3360-3350
If you agree with this view, or have a better idea, please leave a message in the comment area. I look forward to hearing different voices.
TVC:GOLD FXOPEN:XAUUSD FOREXCOM:XAUUSD FX:XAUUSD OANDA:XAUUSD

Iran seeks peace, Israel strikes – Gold dip, buy opportunity🌍 Iran's peace overtures sent gold prices plummeting to 3382, but Israel is unlikely to accept the olive branch lightly. With no clear signs of de-escalation in the Middle East situation, it's advisable to continue going long at lower levels 📉→📈
Israeli PM Benjamin Netanyahu vows military strikes will continue until Iran's nuclear program and ballistic missile capabilities are fully dismantled—showing no signs of halting ⚡. While he claims regime change is not the objective, he notes that given the weakness of Iran's leadership, political upheaval could emerge as a collateral outcome of the operations 🌪️
🌍 Currently, only Iran is seeking peace, but Israel won't simply end the war🌍 Currently, only Iran is seeking peace, but Israel won't simply end the war
⚡️⚡️⚡️ XAUUSD ⚡️⚡️⚡️
🚀 Buy@ 3385 - 3390
🚀 TP 3410 - 3420
Accurate signals are updated every day 📈 If you encounter any problems during trading, these signals can serve as your reliable guide 🧭 Feel free to refer to them! I sincerely hope they'll be of great help to you 🌟 👇
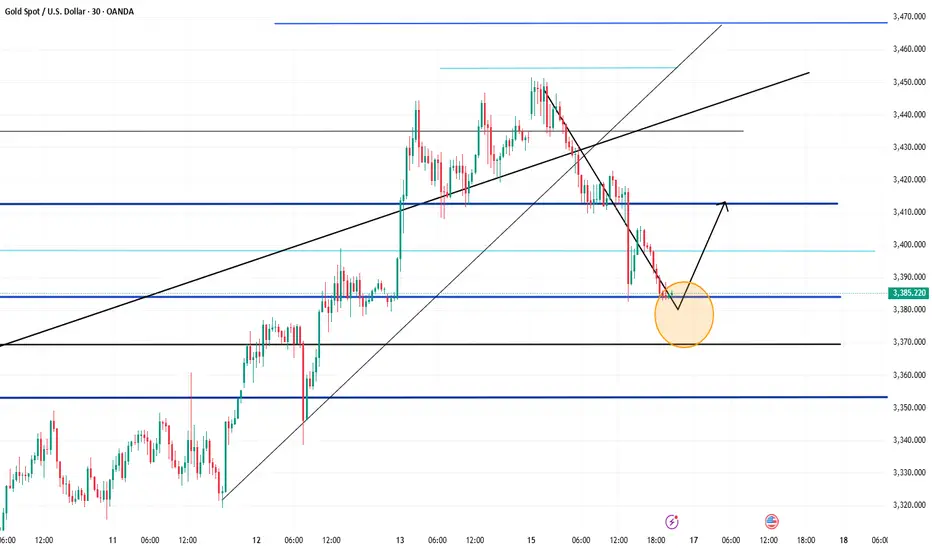
Gold Spot / U.S. Dollar - 30m FX ChartA 30-minute candlestick chart showing the price movement of Gold Spot against the U.S. Dollar, with a current price of $3,390.81, down 1.25% ($43.07). The chart highlights recent price levels ranging from $3,363.99 to $3,440.11.

gold on sell reverse#XAUUSD multiple 2 times breakout below 3408 will drop the price till 3400-3376.
Price holds bearish reversal below 3408, target 3400-3376. SL 3419.
Bullish range and reverse is at 3403.6 price can reverse from here but if drop happens first below 3399 its invalid.
H1 closure above 3425 holds longer bullish.

Buy on dips and seize rising opportunities📰 Impact of news:
1. Geopolitical risks
2. Expected Fed policy
📈 Market analysis:
The market opened higher in the morning and then continued to fall. From a medium-term perspective, the market is still in a medium-term bullish position. The price will only be under further pressure if it breaks below the weekly support. Observing from the daily level, the price broke through the daily resistance again last Wednesday and continued to soar after the breakthrough. The current price is testing the monthly high, and the subsequent gains and losses of the previous high are the key. Judging from the 1H chart, the short-term death cross continues to fall. At the same time, according to the 4H level, as time goes by, we need to pay attention to the support of 3413-3403. This support is the key watershed of the short-term trend. As long as it does not fall below this support, the bulls still have a chance.
🏅 Trading strategies:
BUY 3413-3403
TP 3430-3440
If you agree with this view, or have a better idea, please leave a message in the comment area. I look forward to hearing different voices.
OANDA:XAUUSD FX:XAUUSD FOREXCOM:XAUUSD FXOPEN:XAUUSD TVC:GOLD

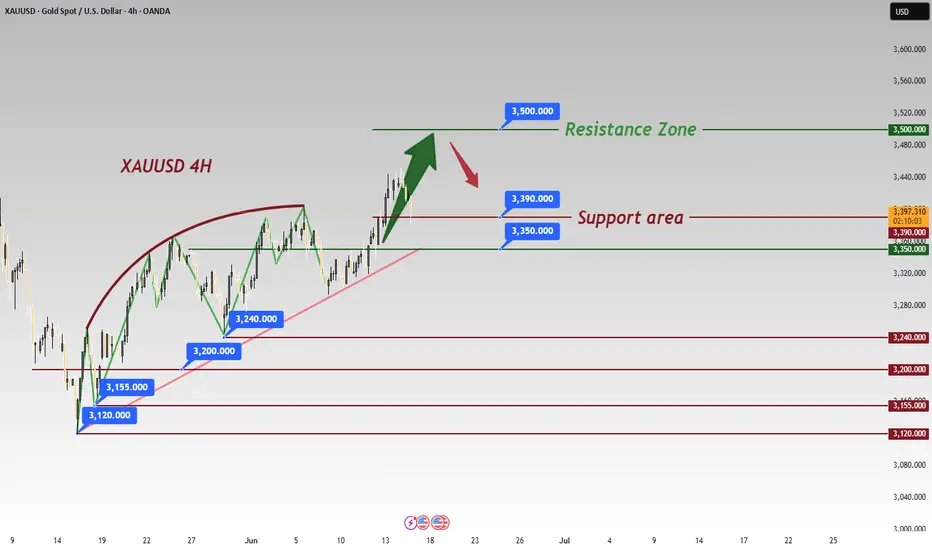
Safe-Haven Demand Drives Gold Higher – 3500 Within ReachWishing everyone a peaceful weekend—despite turbulent times.
This weekend has been anything but calm. The escalating conflict in the Middle East continues to widen, with rising casualties. As always, war is often a pursuit of power by those at the top, while the real cost is borne by innocent civilians. Though we are mere observers from afar, it’s hard not to feel the weight of the situation.
From a geopolitical perspective, this conflict coincides with U.S.–Iran nuclear negotiations. Could this be a calculated move by certain powers to shift the balance in their favor? While it remains speculative, what’s certain is that the intensifying conflict is already shaking global financial markets.
In such a climate, safe-haven assets are clearly benefiting. Gold’s upward momentum appears firmly established, and oil’s direction hinges on the situation at the Strait of Hormuz. If the strait is closed, a surge in USOIL prices toward $100 would no longer seem unlikely.
Under the influence of such impactful news, traditional technical analysis plays a lesser role. The market direction is largely determined by sentiment, and chart patterns now serve more as entry point references rather than decisive indicators.
My trading outlook for Monday:
If gold opens with a bullish gap and rallies toward the 3480–3500 zone, this area could present a short-term selling opportunity—ideally executed with a quick in-and-out strategy;
If a pullback follows, look to build intraday long positions: aggressive traders may consider entries near 3430, while conservative ones can wait for a potential retest of the 3418 level.
One crucial reminder: News-driven markets are highly uncertain. Eventually, every war comes to an end, and when the demand for safe havens fades, so too will prices. Stay rational in your decisions, and always manage your risk appropriately.

XAUUSD Long Position Gold is currently in a retracement with the potential for a further to the upside from the $3400 break-and-retest level. Last week we saw a massive rally to the upside for Gold after 2 days of indecision, during this rally, Gold broke above the $3400 resistance zone and now has the potential to use this level and platform to bounce further to the upside. On the 4 hour timeframe, Gold is comfortable trading above the 50 SMA and the $3400 potentially lays in the 45-55 zone of the RSI which is the sweet spot region indicating the need of a retracement and continuation of the the primary trend which is bullish. Will be looking to trade from $3400 with Stop loss below structure towards the $3445 resistance level.

Middle East Tensions Soar, Bulls Remain DominantBrief Update on Escalating Israel-Iran Conflict:
On June 14, Israeli forces airstruck Iran's Defense Ministry, nuclear facilities, and oil installations—causing a Tehran residential building to collapse and killing 60 civilians. 💥
Iran fired 50 ballistic missiles into Israel, damaging structures in Tel Aviv. A senior advisor to Iran's Supreme Leader died from injuries; Israel released a hit list of 9 Iranian nuclear scientists. ⚠️
Iran Nuclear Talks Developments:
Iran announced new nuclear safeguards without IAEA notice, warning NPT withdrawal if sanctioned. 🛑
June 15th U.S.-Iran talks canceled. ⏳
The Middle East situation is currently heating up 🌍💥. With the intensifying of geopolitical tensions in the Middle East over the weekend, gold is likely to continue to benefit from the boost of risk-averse sentiment next week and may break through the $3,500 mark 📈. The price of gold will also be affected by the Federal Reserve's decision and Powell's speech during the week 🏛️. In addition, US President Trump will visit Canada to attend the G7 Leaders' Summit from June 15th to 17th, and his speech at that time may also affect the fluctuation of gold prices, which is worthy of attention 🇺🇸🇨🇦
⚡️⚡️⚡️ XAUUSD ⚡️⚡️⚡️
🚀 Buy@ 3410 - 3415
🚀 TP 3480 - 3490
Accurate signals are updated every day 📈 If you encounter any problems during trading, these signals can serve as your reliable guide 🧭 Feel free to refer to them! I sincerely hope they'll be of great help to you 🌟 👇

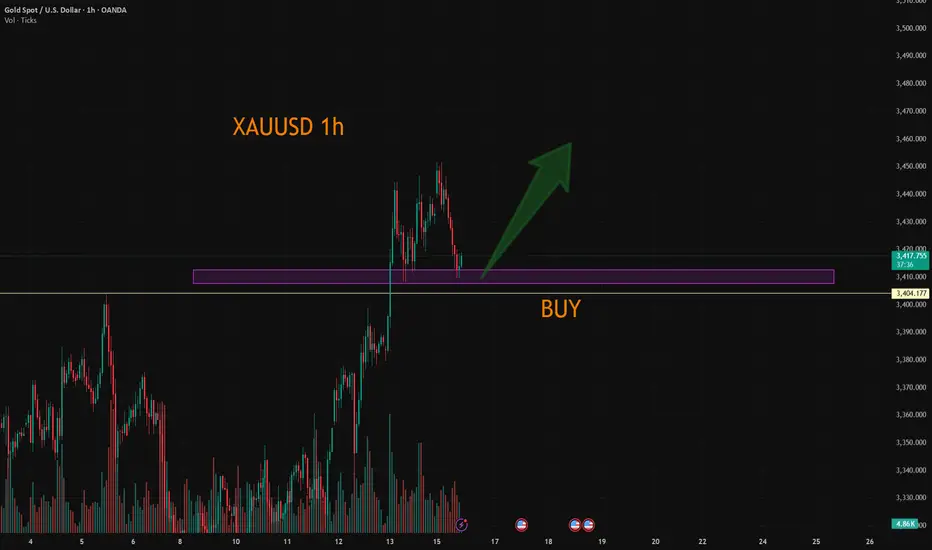
XAUUSD:Waiting to go long
For gold I am still bullish, do long, rather than blindly chase long.
Today's lowest reretreat to around 3408, from the short-term level or long willingness is stronger, the hourly level is a little pressure, trading can wait for the pullback before buying long, the important support below 3404. Short-term support looks at 3407-12
Trading Strategy:
BUY@3407-12
TP:3427-30
↓↓↓ More detailed strategies and trading will be notified here ↗↗↗
↓↓↓ Keep updated, come to "get" ↗↗↗
Gold price falls back and continues to go longFrom the 4-hour market analysis, the support below is around 3408-10. The short-term bullish strong dividing line moves up to the 3388-93 level. The daily level stabilizes above this position and continues to maintain the same low-long rhythm. The short position against the trend needs to be cautious. There is a high probability that the short-term will continue to rush up to test the previous high.
Gold falls back to 3408-10 and goes long. Fall back to 3388-95 and add to long position. Stop loss at 3384. Target at 3445-3450. Continue to hold if it breaks.

The latest gold operation strategyTechnically, the daily level reminds us to focus on the key resistance range of 3455-3460: if this area fails to break through effectively, the price may face a technical correction; if it breaks through, it may open up further upward space. The 4-hour period chart analysis shows that the gold price maintains a unilateral upward trend, the Bollinger Band channel continues to expand, and the moving average system maintains a complete long arrangement. Two major support levels need to be monitored this week: 3420 constitutes a short-term long-short watershed, and if this position is maintained, the price will maintain its strong characteristics; 3410-3405 is a key trend support level. If it is not effectively broken, the long structure will continue.
Operation strategy:
1. It is recommended to buy gold near 3420-3415, stop loss at 3407, and target 3440-3460

Gold Regains Bullish MomentumGold Regains Bullish Momentum
Gold price started a fresh surge above the $3,375 resistance level.
Important Takeaways for Gold Price Analysis Today
- Gold price started a fresh surge and traded above $3,420 against the US Dollar.
- A key bullish trend line is forming with support at $3,415 on the hourly chart of gold at FXOpen.
Gold Price Technical Analysis
On the hourly chart of Gold at FXOpen, the price formed a base near the $3,300 zone. The price started a steady increase above the $3,350 and $3,375 resistance levels.
There was a decent move above the 50-hour simple moving average and $3,400. The bulls pushed the price above the $3,420 resistance zone. A high was formed near $3,450 and the price is now consolidating gains.
On the downside, immediate support is near the $3,415 level and the 23.6% Fib retracement level of the upward move from the $3,301 swing low to the $3,451 high.
Besides, there is a key bullish trend line forming with support at $3,415. The next major support sits at $3,375 and the 50% Fib retracement level of the upward move from the $3,301 swing low to the $3,451 high.
A downside break below the $3,375 support might send the price toward the $3,335 support. Any more losses might send the price toward the $3,300 support zone.
Immediate resistance is near the $3,450 level. The next major resistance is near the $3,460 level. An upside break above the $3,460 resistance could send Gold price toward $3,480. Any more gains may perhaps set the pace for an increase toward the $3,500 level.
This article represents the opinion of the Companies operating under the FXOpen brand only. It is not to be construed as an offer, solicitation, or recommendation with respect to products and services provided by the Companies operating under the FXOpen brand, nor is it to be considered financial advice.
