XAU/USD Chart Analysis Following Israel-Iran StrikesXAU/USD Chart Analysis Following Israel-Iran Strikes
In 2025, the price of gold continues to form a long-term upward trend, highlighted by the black line. The red line previously acted as resistance, resulting in the formation of a contracting triangle on the XAU/USD chart – a typical sign of market equilibrium.
However, this red line was breached (as indicated by the arrow) amid news of the exchange of strikes between Israel and Iran. In response, gold price movements have more clearly outlined the rising blue channel, which began to take shape in the second half of May.
Over the weekend, the strikes continued, and on Monday morning, trading opened with a modest bullish gap. This indicates that geopolitical risk concerns are helping to keep gold prices anchored above the red line.
What could happen to the price of gold next?
Much will depend on how the situation in the Middle East develops. Should the exchange of strikes between Iran and Israel subside and official statements offer hope for de-escalation, a pullback from the upper boundary of the blue channel is likely.
If such a scenario plays out, technical analysts may focus on the support zone around $3,390–3,400 on the XAU/USD chart, formed by:
→ the psychological level of $3,400;
→ the red line, which previously acted as resistance;
→ the median of the blue channel.
This article represents the opinion of the Companies operating under the FXOpen brand only. It is not to be construed as an offer, solicitation, or recommendation with respect to products and services provided by the Companies operating under the FXOpen brand, nor is it to be considered financial advice.
Xauusdupdates

XAUUSD: Analysis June 16Gold has a lot of momentum to increase and could head towards testing the all-time high around 3500 as there are too many risks emerging, from geopolitical developments to interest rate outlook, and tariffs. Major conflicts in the Middle East, Russia - Ukraine, trade war between the US and the rest of the world, ... are all sudden risk support that makes gold likely to surge in the short term.
Gold, after increasing around 3450 this morning, is currently correcting down. But overall, the uptrend with gold is still solid after breaking the downtrend channel. However, we should avoid buying in strong corrections.
The support area around 3400 will be the ideal place for us to BUY today.
And the resistance area 3440 - 3445 will be where we SELL.

Gold Spot / U.S. Dollar - 1 Hour FX Chartthe 1-hour price movement of Gold Spot (XAUUSD) against the U.S. Dollar, with the current price at 3,418.02, reflecting a decrease of 15.96 (-0.46%). The chart includes a candlestick pattern showing recent trends, with a highlighted upward movement and key price levels marked at 3,405.38, 3,392.15, 3,360.00, and 3,320.00. The time frame spans from 6 AM to 1 PM on June 16, 2025.

elliot wave 15 min chartOANDA:XAUUSD
According to the Elliott Wave analysis on the 15-minute chart, Wave 4 is still in progress. The ideal buying zone is between 3405 and 3395.

Gold (XAU/USD) Analysis - 16 June 20254H Chart: Market Structure & Bias
Gold’s 4-hour chart shows a bullish structure: price has been making higher highs and higher lows (a valid Break of Structure/BOS)
No bearish Change of Character (CHoCH) signal is present to suggest a reversal, so the overall bias remains bullish. In other words, the trend is intact and buyers still dominate. Key moving averages (not shown) also slope upward, reinforcing a “buy the dip” bias. We note that price recently stalled near 3427–3435, forming a small consolidation. This clustered area around the recent high acts as a near-term supply (resistance) zone (a possible order block where big players sold).
On the downside, prior support is visible around 3380–3400, where buyers stepped in on earlier pullbacks. In summary, the 4H bias is bullish, with dips into demand areas likely to attract buying interest.
Support/Demand Zones: At ~3380–3400 there is significant buying interest (a demand zone), as well as a minor support band around 3330–3350. These areas coincide with key Fibonacci retracements (around 50–62% of the last rally), making them high-probability bounce zones.
Resistance/Supply Zones: On the upside, the 3420–3435 range is resistance (recent swing high and a bearish order-block area).
Farther above, 3470–3485 is a major resistance cluster (around prior highs and a 61.8% extension), where supply may re-emerge.
Key Zones (4H Chart)
Buy Zone 1 (Demand): 3380–3400. This zone acted as support on prior pullbacks and aligns with ~50%–62% Fibonacci retracement levels. It represents a demand area (many buy orders), so bounces are likely here.
Buy Zone 2 (Support): 3330–3350. A deeper support area where buyers piled in previously. It coincides with the 61.8% Fib retrace of the last leg, making it a strong multi-purpose support/demand zone.
Sell Zone 1 (Supply): 3420–3435. This marks the recent 4H swing high and a potential bearish order block.
It has already capped rallies, so price may stall or reverse here on a retest.
Sell Zone 2 (Resistance): 3470–3485. A higher cluster of resistance (major psychological level and Fib extension) where selling could appear if gold extends its rally. This is a logical profit-taking area.
Each of these zones is a range (not just a line) to allow for some trade flexibility. We watch for price action (like pin bars or breakouts) within these ranges to signal entries.
1H Chart: Trade Setups
Buy at 3385–3395 (Long).
Entry Zone: 3385–3395 (just above the lower demand zone).
Stop-Loss: ~10 USD below the zone (around 3375).
Take-Profit: 3420 (minor resistance) and 3460 (next supply cluster).
Reason: This zone combines the 4H demand area and ~50% Fib support.
We expect bulls to defend this zone.
Trigger: Wait for a bullish reversal candle on 1H (e.g. a strong bullish pin bar or engulfing candle with a long lower wick). Such a candle (long-tail wick) at support indicates a liquidity grab by buyers. Alternatively, a clear 1H BOS above the last minor swing high would confirm strength and serve as a breakout entry.
Buy on 3425–3430 breakout (Long).
Entry Zone: Break above 3425–3430 (just above the recent 4H high).
Stop-Loss: ~10 USD below entry (around 3415).
Take-Profit: 3480–3490 (next resistance zone).
Reason: A push through the 3420–3435 supply zone would show buyers overcoming sellers. This would keep the uptrend running. The breakout opens room toward the 3470–3485 resistance area.
Trigger: Enter on a 1H bullish breakout/close above 3430 (a new higher high) – i.e. a bullish BOS confirming continued uptrend. Optionally look for a pullback to 3425 as a retest entry if the breakout is swift.
Buy at 3330–3340 (Long).
Entry Zone: 3330–3340 (deeper support zone on 4H).
Stop-Loss: ~10 USD below the zone (around 3320).
Take-Profit: 3380 (first target), then 3420.
Reason: This is a strong support/demand area (4H 61.8% Fib support). A drop here would be a deeper pullback – a higher-risk entry with a bigger reward if buyers step in.
Trigger: Look for a clear bullish reversal on 1H (e.g. hammer/engulfing candle) or a shift in structure (price fails to make a new low and instead forms a higher low). A bullish candlestick in this zone implies demand is defending it.
Each setup is aligned with the 4H bullish bias (we’re looking for long opportunities at support zones or breakouts). The ~$10 stops are set just beyond the defined entry zone, giving each trade a favorable risk/reward.
Takeaway: Gold’s 4-hour trend is up. We favor buying near the identified demand/support zones (or on a confirmed breakout above recent highs) and targeting the next resistance levels. Use tight stops (~$10 beyond each zone) and aim for 2:1+ reward on these high-probability setups.
Trade with the trend and respect the key zones above.

Safe-Haven Demand Expected to Push Gold Prices Toward 3500Last week, intensifying conflict between Israel and Iran triggered a strong wave of risk-off sentiment in the markets.
As a result, we saw sharp rallies across major safe-haven assets and crude oil.
Over the weekend, tensions continued to escalate and even showed signs of further expansion.
Under such circumstances, it's clear that heightened geopolitical risk will continue to support gold prices.
However, 📍$3500 remains a major resistance zone at the moment.
If gold spikes to this level intraday, it’s very likely we’ll see a short-term pullback —
Whether due to profit-taking, cautious positioning by sideline capital, or selling pressure from trapped shorts above 3490,
⚠️ this kind of correction is a natural market reaction — driven by human nature.
Even with strong risk-off demand in place, after a $200 rally,
the market is still subject to volatility from profit-taking behaviors.
🔑 Trading Strategy for This Week
As long as tensions in the Middle East persist,
🎯 the primary bias remains bullish.
However, the entry point is crucial.
💡 Important notes:
Avoid chasing price after sudden spikes caused by breaking news.
Those spikes are not ideal buy zones — instead, look for short-term selling opportunities at those highs.
Once the price pulls back, assess the retracement level and key supports before looking to buy the dip.
We are now within a historically high price range,
which means any rally could trigger profit-taking from earlier longs.
While the overall trend may still head higher,
⚠️ you need to carefully evaluate the size of potential pullbacks and whether your account can withstand the associated risks.
📊 Technical Levels to Watch:
Resistance: 3450-3455 (minor), 3468-3474 (previous high), and 3487-3499 (major historical high)
Support: 3420–3410 zone, and the deeper 3400–3386 range
Stay alert, trade wisely, and remember — in volatile geopolitical environments,
timing and discipline are more important than ever.

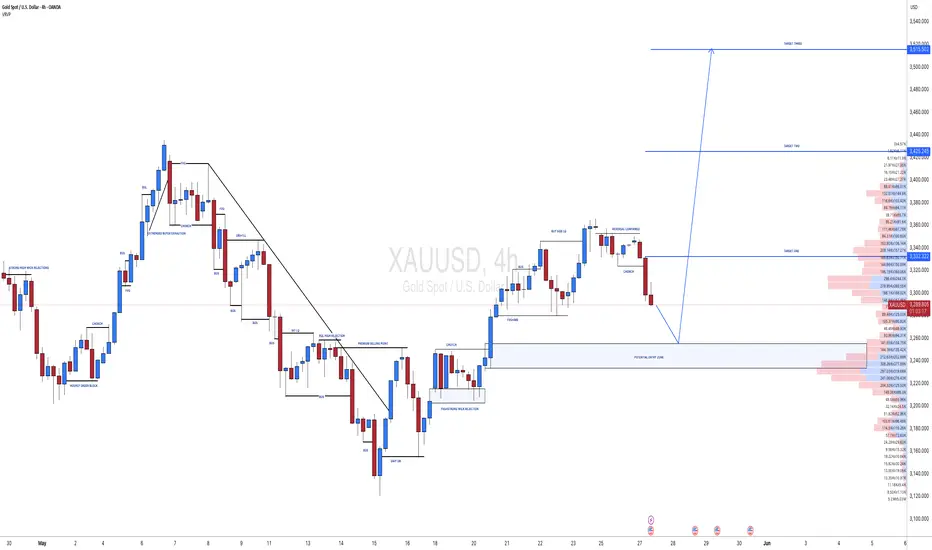
XAU/USD 16-20 June 2025 Weekly AnalysisWeekly Analysis:
Swing Structure -> Bullish.
Internal Structure -> Bullish.
Analysis and bias remains the same as analysis dated 16 March 2025.
In my analysis dated 27 October 2024 I mentioned (below) that price could potentially print higher-highs in order to reposition CHoCH. This is exactly how price printed. CHoCH positioning has been brought significantly closer to current price action. CHoCH positioning is denoted with a shortened blue dotted horizontal line.
The remainder of my analysis and bias remains the same as analysis dated 09 February 2025.
Price has printed a further bullish iBOS.
Price is currently trading within an internal low and fractal high. CHoCH positioning is denoted with a blue dashed line.
Price Action Analysis:
In my analysis dated 27 October 2024, it was noted that the first sign of a pullback would be a bearish Change of Character (CHoCH), indicated by a blue dotted line. Price's consistent upward momentum had repositioned previous CHoCH much closer to recent price levels as expected for weeks. Current CHoCH positioning is quite a distance away from price, therefore, it would be viable if price continued bullish to reposition ChOCH.
Note:
It is highly unlikely price will "crash" as many analysts are predicting. My view is this is merely a corrective wave of the primary trend.
Given the Federal Reserve's dovish policy stance alongside heightened geopolitical risks, market volatility is likely to remain elevated, influencing intraday price swings.
Price could also be driven by President Trump's policies, geopolitical moves and economic decisions which are sparking uncertainty and potential repricing of Gold.
Weekly Chart:
Daily Analysis:
Swing -> Bullish.
Internal -> Bullish.
Analysis and Bias remains the same as Analysis dated 11 May 2025.
Since my last weekly analysis price has finally printed a bearish CHoCH.
This is the first indication, but not confirmation of bearish pullback phase initiation.
Price is now trading within an established internal range.
Price should now technically trade down to either discount of 50% internal EQ, or Daily demand zone before targeting weak internal high, priced at 3,500.200.
Note:
The Federal Reserve’s continued dovish stance, coupled with escalating geopolitical uncertainties, is expected to sustain elevated market volatility, influencing both intraday and broader trend developments.
Additionally, price action may be further shaped by U.S. policy decisions, including measures enacted under President Trump. Shifts in geopolitical strategy and economic policymaking could introduce further uncertainty, contributing to the ongoing repricing dynamics within the gold market.
Daily Chart:
H4 Analysis:
-> Swing: Bullish.
-> Internal: Bullish.
Analysis and bias remains the same as analysis dated 23 April 2025
Price has now printed a bearish CHoCH according to my analysis yesterday.
Price is now trading within an established internal range.
Intraday Expectation:
Price to trade down to either discount of internal 50% EQ, or H4 demand zone before targeting weak internal high priced at 3,500.200.
Note:
The Federal Reserve’s sustained dovish stance, coupled with ongoing geopolitical uncertainties, is likely to prolong heightened volatility in the gold market. Given this elevated risk environment, traders should exercise caution and recalibrate risk management strategies to navigate potential price fluctuations effectively.
Additionally, gold pricing remains sensitive to broader macroeconomic developments, including policy decisions under President Trump. Shifts in geopolitical strategy and economic directives could further amplify uncertainty, contributing to market repricing dynamics.
H4 Chart:

Gold (XAUUSD) Weekly Forecast - 16 to 20 June 2025🔥 Gold (XAU/USD) Weekly Outlook | June 16–20, 2025
🧭 Macro & Geopolitical Context
Israel–Iran war (Operation Rising Lion) has escalated: Israeli strikes on Iran’s nuclear and missile infrastructure on June 13, followed by Iranian missile/drone retaliation, have sharply intensified regional conflict .
The safe‑haven bid is in full swing: spot gold surged toward $3,500, breaking $3,400 last week, driven by risk‑off flows and a weaker US dollar .
🧩 Fundamental Catalysts
1. Fed dovish tilt: May CPI/PPI prints came in soft, lifting expectations for rate cuts. No change is expected at the June 18 meeting, but the Fed’s dot‑plot and Powell’s tone offer upside triggers .
2. Technical breakout: Gold has reclaimed key levels—23.6% Fibonacci (~ $3,377) now acts as support, with the next resistance zones at $3,450 → $3,500 .
3. Bank & analyst sentiment: Goldman Sachs sees potential for $3,700 by year-end; Bank of America projects a path toward $4,000/oz .
📊 Technical Setup & Levels
Support: $3,400; next down at $3,377 (23.6% Fibo) and $3,325 (21‑day SMA) .
Resistance: $3,450 → major barrier $3,500 (all‑time high).
Momentum: RSI around 62—leaves room for further upside .
Catalysts to Monitor
June 18 Fed meeting: Dot‑plot, Powell’s press conference.
Any Iran retaliation or widening of the conflict.
Short‑term US data: June CPI, PPI, Retail Sales (especially mid‑week).
USD strength or weakness—dollar reversal could clip gold gains.
Follow for more updates
#XAUUSD #GOLD #Goldanalysis #WeeklyAnalysis #trade

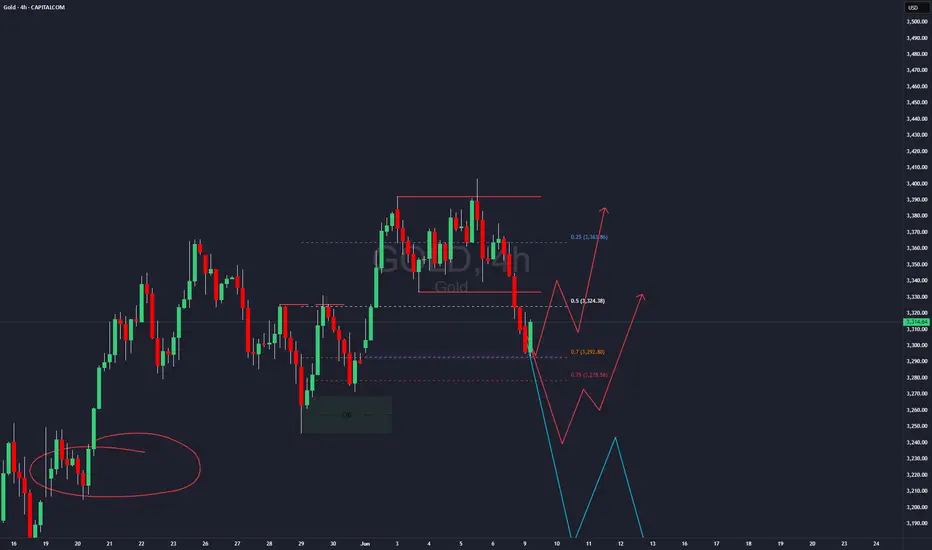
Gold's Wild Ride: Must-Know Price Predictions for Next Week!I can write a lot of smart words but lets make it short, like and sub from you for that)
3 options that i can see:
1- dump to Gap at 3292 then bounce target PWH or higher
2 - move a bit lower till PWL and then all the way up till PWH or ATH
3 - cancel all longs, move down below , break 3250 lvl with fvg and second shift on 4h time frame and then gold will keep going lower all the way down to 3k (Low-probability)
XAUUSD Analysis todayHello traders, this is a complete multiple timeframe analysis of this pair. We see could find significant trading opportunities as per analysis upon price action confirmation we may take this trade. Smash the like button if you find value in this analysis and drop a comment if you have any questions or let me know which pair to cover in my next analysis.

Unlock Gold's Secrets: A Daily Tape Reading Analysis for XAUUSDHey everyone! Today,
we're diving deep into XAUUSD (Gold) using a daily candle tape reading approach that aims to uncover critical turning points and price levels. If you're looking for an edge in understanding Gold's movements, this analysis could be a game-changer.
On the accompanying chart, you'll see yellow horizontal lines that highlight key bullish and bearish price levels. These aren't just arbitrary lines; they represent significant battlegrounds where buyers and sellers have historically shown their hand.
In addition, the vertical lines on the chart pinpoint specific days where we've observed a change in trade direction or a potential reversal. It's important to note that these shifts can sometimes occur within one or two candles before or after the marked day, so keep an eye on the immediate vicinity.
We're interpreting these price levels with a 3% to 5% tolerance, allowing for the natural ebb and flow of the market around these crucial points.
Key Price Levels to Watch:
Bullish Price Levels:
3477.67: A critical zone where bullish momentum has historically taken hold.
3522.40: Another strong support level that could propel Gold higher.
3562.30: Watch this level for signs of continued upward pressure.
3631.31: A significant resistance-turned-support level that could signal a strong bullish continuation.
Bearish Price Levels:
3323.72: A key level where bearish pressure has often intensified.
3245.09: If this level breaks, it could indicate further downside for Gold.
3165.42: A crucial support level; a breach here could accelerate a downtrend.
3077.23: The ultimate test for the bears; a break below could signal a more substantial correction.
__________________________________________________________________________________
What are your thoughts on these levels? Have you noticed similar patterns in your own XAUUSD analysis? Share your insights in the comments below!
⚠️ Disclaimer: This post is educational content and does not constitute investment advice, financial advice, or trading recommendations. The views expressed here are based on technical analysis and are shared solely for informational purposes. The stock market is subject to risks, including capital loss, and readers should exercise due diligence before investing. We do not take responsibility for decisions made based on this content. Consult a certified financial advisor for personalized guidance

Gold (XAUUSD) Trading Setup – Mid-June 2025 Analysis🔰 Gold (XAUUSD) Trading Setup – Mid-June 2025 Analysis
This chart represents a strategic price action-based setup on Gold (CFDs on Gold – US$/Oz) using a 15-minute timeframe. It includes clearly defined entry zone, support/resistance levels, and profit-taking targets (TP1, TP2) for both bullish and bearish scenarios.
🔍 Current Market Context
Current Price: ~$3431.77
Structure: The price has been in an upward trend with a consolidation phase forming near the key mid-zone.
Highlighted Zone: A decision zone is marked in red (between ~$3422 and ~$3418), acting as the key liquidity zone or breakout area.
📈 Bullish Bias
If price breaks and holds above the red zone:
✅ TP1: $3480
✅ TP2: $3580
These levels act as short- to mid-term bullish targets based on projected extensions of recent upward momentum.
📉 Bearish Bias
If price breaks and holds below the red zone:
✅ TP1: $3320
✅ TP2: $3260
This indicates a possible reversal or correction phase, with targets derived from recent swing lows and support areas.
📌 Trading Notes
The blue shaded areas represent target zones for partial or full exits.
Red zone is the critical breakout decision point.
Ideal for breakout or pullback traders.
Can be combined with volume/confirmation indicators (e.g., RSI, MACD, or price action candles) for entry timing.

Elliott Wave Analysis – XAUUSD June 16, 2025
🌀 Elliott Wave Structure
On the H1 timeframe, price is forming a 5-wave structure (1) (2) (3) (4) (5) in green, with the market currently in wave 4.
Last Friday, after breaking above the 3444 high, price failed to continue toward 3482 and instead reversed lower. This behavior suggests that wave 4 is developing as a Flat correction in black abc structure.
👉 Based on this outlook, wave c is expected to complete around 3314, marking the end of wave 4 in green. From there, a bullish impulse is anticipated to complete wave 5.
🔎 Momentum Overview
D1 timeframe: Momentum is rising → indicating the dominant trend for early this week is likely bullish.
H4 timeframe: Momentum is declining → supporting the scenario that wave c of wave 4 may still have one more leg down.
H1 timeframe: Momentum is about to turn downward → suggesting a potential drop during the Asian session on Monday.
🚨 However, ongoing geopolitical tensions in the Middle East could trigger unexpected price spikes, especially during the Asian session.
📈 Trade Plan
Buy Zone: 3415 – 3412
Stop Loss: 3405
Take Profit 1: 3444
Take Profit 2: 3482

XAUUSD:Touching $3500 One More Time Gold is currently extremely bullish and we expect price to touch 3500$ region one more time before it may reverse. you can set your own target based on your risk. Gold will remain volatile in coming weeks and we want all of you to trade safe.
Good luck and trade safe.
Team Setupsfx_

XAUUSD:[GOLD]: First Drop And Then Reverse! Comment Your Views! Gold touched $3350 but was rejected at that level, dropping around 3288. The price shows some minor support at this region, which we’re currently monitoring. If it breaks through, it could touch our buying zone, reversing the trend. You can set three targets based on your own analysis and bias. Please use accurate risk management while trading.
If you’d like to contribute, here are a few ways you can assist us:
- Like our ideas
- Comment on our ideas
- Share our ideas
Team Setupsfx_🚀❤️
#XAUUSD[GOLD]: Massive Boost For Buyers, Incoming More Volume! Gold has been moving as expected in our previous chart. We anticipate a smooth bull market in the coming days, with a target price region of 3400$. There are three specific targets you can aim for.
If you’d like to contribute, here are a few ways you can help us:
- Like our ideas
- Comment on our ideas
- Share our ideas
Team Setupsfx_🚀❤️

#XAUUSD[GOLD]:At Critical Level, Bullish Swing Is Very LikelyHey There Everyone,
So, gold prices took a bit of a dip, hitting 3250 gold. But guess what? They bounced back like a rubber ball and reached 3332! And here’s the exciting part: they broke through that pesky bearish trend line. This means they’re probably going to retest that line to confirm the trend.
Right now, it looks like they’re at a potential retest point, and that’s where things could get really interesting. If strong bullish volume comes in, the price could skyrocket! There are three possible targets here: 3332, 3362, and 3420.
Now, here’s something important to keep in mind: next week, there are some big news and events coming up that could totally shake things up in the gold market. And let’s not forget about price manipulation. If someone tries to mess with the price, it could drop back to 3250 and then reverse course. So, it’s crucial to have backup plans in case of any unexpected twists.
The US dollar is also going to be all over the place due to upcoming news, which could disrupt the gold market and other currencies. So, it’s best to trade cautiously today and next week. The price can be a bit unpredictable, so take your time to do your own analysis and assess your risk before making any moves.
Good luck and trade safely! We wish you all the best in your trading journey!
Cheers,
Team Setupsfx_

XAUUSD: Still Bullish with improved entry zones! Gold experienced a sudden drop today, falling to 3335 after briefly reaching 3391. This unexpected decline was not anticipated given the bullish price momentum. However, it has provided clarity for buyers, particularly swing traders. The price could drop to 3340 once more before reversing and hitting our first target, followed by a second target later.
Another possible scenario arises if the price continues to drop further. In this case, the second entry scenario becomes more secure, as Asian session volatility could cause the price to go sideways.
Please use accurate risk management and consider liking and commenting on this idea.
Good luck and trade safely.
Team Setupsfx_

XAUUSD:06/06/2025 Update! Gold experienced a decline to 3314 following the release of unexpectedly strong NFP data. However, this decline is unlikely to lead to further price drops below 3314. This is primarily due to the ongoing turmoil within the president’s own political party, which is only just beginning to unfold and will likely intensify in the coming weeks.
Before making any trading decisions, it is advisable to conduct your own analysis. Additionally, the current price action has established an AB=CD pattern, where the price has successfully reversed from point ‘d’. This pattern suggests that waiting for the price to break out could be a prudent strategy for a safe entry.
Three targets have been reasonably set, with the potential to reach target two. However, the target three remains uncertain. The total potential profit from this idea is approximately 1300 pips.
It is also important to monitor the DXY closely. We recommend waiting for the price to complete its bullish correction before taking an entry on gold.
We sincerely hope that this analysis proves beneficial. Please consider liking, commenting, and sharing this post to encourage us to provide more such insights.
Best regards,
Team Setupsfx_

XAUUSD: Another Important Update On Gold Prices! We recently posted an idea analysis on Gold, but our first entry was invalidated due to the heavy sell-off. We expect a smooth move from the current price point. However, please remember that the market conditions will remain volatile and uncertain due to important economic data being published tomorrow.
Good luck, trade safely!
Team Setupsfx_

#XAUUSD[GOLD]:+2200 Pips Big Move! | Setupsfx_|Gold is currently accumulating in smaller timeframes, which suggests it’s in the early stages of a significant move. It’s possible that the price will reverse from either of the entry zones. There are three take-profit areas you can target, but only if they align with your view. This is an educational post, so please don’t blindly follow it – do your own analysis.
Like and comment for more!
Team Setupsfx_

Gold trading strategy june 13Yesterday's D1 candle was bullish, confirming the continuation of the uptrend. Following that uptrend, the Asian session saw a strong price increase to a high of 3443. If there is still confirmation from the h4 candle above 3397, today will still be a bullish candle with a large amplitude at the end of the day.
After reaching a monthly high, Gold is in a bearish correction at the end of the Asian session. This correction will last until it touches the support level of 3397, which is a good BUY signal.
The target for BUY signals will be 3364 and this area will have a profit-taking reaction from Buyers, causing the price to fall. Gold may touch the pre-ATH level of 3394 and there will be a reaction.
On the other hand, there is a sweep to 3376, which is considered a daily support zone and you can buy in this area.
Support: 3398- 3376
Resistance 3464-3495

Gold: Monitor Middle East Developments Over the WeekendAmid escalating tensions in the Middle East, risk-off sentiment surged,
sending gold soaring past the 3414 resistance and peaking near 3450,
before retracing and rebounding off the 3414 support zone.
⚠️ While this was a high-volume breakout, it was news-driven,
so keep in mind:
📌 If tensions ease over the weekend, a pullback on Monday is highly likely
📌 If tensions escalate, another bullish run would be expected
—
🔍 Technical Outlook:
🧭 4H chart: 9-count nearing completion — overbought signals building
🧭 2H chart: MACD showing early signs of a bearish crossover; potential divergence forming
🧭 1D chart: Breakout with volume confirms bullish trend, but risk of short-term correction remains
—
📌 Key Price Zones:
🔺 Resistance: 3468 – 3487 – 3500
🔻 Support: 3414 (critical) – 3400 – 3392
⚠️ If broken, next downside targets: 3378 – 3367
—
📈 Strategy Suggestions:
As we head into Monday:
✅ Consider selling on rallies if geopolitical tensions ease
✅ If tensions worsen, follow the momentum — but watch for reversal signs
