Short-term bearish correction, within a potential bullish setupHere is a more detailed explanation of the chart analysis for XAU/USD (Gold Spot vs. U.S. Dollar) on the 30-minute timeframe:
📊 Chart Summary:
Instrument: XAU/USD (Gold Spot vs. U.S. Dollar)
Timeframe: 30-minute
Current Price: Around 3,359.945 USD
Trend: Short-term bearish correction, within a potential bullish setup
📌 Key Technical Levels:
1. Support Zone 🟩
Level: 3,342.605 USD
This is the zone where buyers are likely to step in. It's a previous demand area where price may reverse or consolidate before moving higher.
2. Resistance Level 🟥
Level: 3,391.323 USD
A key level to watch. If price breaks above this, it signals bullish strength and continuation.
3. Demand Zone 🟦
Level: 3,409.880 – 3,410.342 USD
Target area where strong buying activity previously occurred. Price may gravitate toward this if bullish momentum builds.
🔄 Price Projection Path (Expected Movement):
Price may test the support at 3,342.605, forming a potential reversal base.
A bullish move is expected toward the resistance at 3,391.323.
If broken, price could continue its upward trajectory toward the demand zone around 3,410.342.
🧠 Trading Implication:
Bullish Setup: Look for confirmation near the support zone for a long entry.
Breakout Traders: Watch for breakout above resistance for continuation trades.
Risk Management: Use tight stops below support; consider scaling out near resistance.
Let me know if you'd like a trading strategy or signals based on this analysis.
Xauusdupdates

Gold Approaches Historical Highs Once AgainOver the last three trading sessions, gold has gained just over 3%, and is once again approaching the $3,400 zone, where historical highs are currently holding. For now, the bullish bias behind the precious metal has remained intact, as market uncertainty continues to rise steadily due to developments related to the trade war and the ongoing conflict in Ukraine.
Risk aversion has started to increase following recent comments from Donald Trump regarding a potential new escalation with China if negotiations fail to reach an agreement. Additionally, the proposed peace deal for the Ukraine conflict appears to be more delayed than expected, which has caused CNN’s Fear and Greed Index to shift from the “greed” zone into “neutral,” reflecting a decline in short-term investor confidence.
It is important to note that in this type of scenario, gold stands out due to its safe-haven status, and these types of events have acted as important catalysts to sustain the current buying momentum over the past few sessions.
Uptrend Remains Intact
Since the first days of January this year, gold has maintained a steady uptrend. So far, bearish corrections have been insufficient to break the formation seen in recent weeks. At present, the price is once again testing the resistance area marked by historical highs, and if it manages to break through this level, it could signal a stabilization of the upward trend in the sessions ahead.
RSI
The RSI line continues to rise above the 50 level, indicating bullish momentum in the short term. If the line continues to climb, buying pressure could become more significant in the near term.
TRIX
Although the TRIX line remains above the neutral 0 level, its current downward slope suggests that buying momentum has entered a period of consolidation. Unless the line recovers, it will continue to reflect that the strength of the exponential moving averages is entering a short-term neutral phase.
Key Levels to Watch:
$3,400: Resistance located at recent historical highs. A breakout above this level could activate a stronger bullish bias and reinforce the ongoing trend.
$3,300: A nearby support level aligned with the midpoint of a potential short-term horizontal channel. It may act as a barrier to further downside corrections.
$3,200: A critical support level aligned with the ascending trendline. Selling activity below this level could put the current uptrend at risk.
Written by Julian Pineda, CFA – Market Analyst

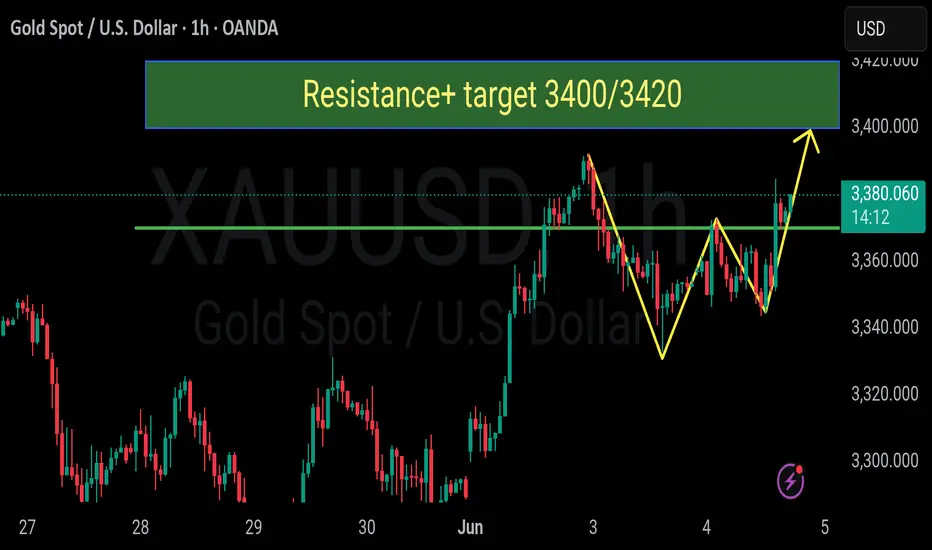
XAU/USD H1 CHART OUTLOOKGold is Now moving in the range of 3375/3380 and it is making strong bullish scenario which indicates us to put BUY trades.
1st Target ::: 3400
2nd Target ::: 3410
Final target : 3420
Stop loss just below 3365
BULLS VS BEARS WILL GOLD MATCH ATH?Glossary:
Ged = Bearish scenario
Green = Bullish scenario
POI = Point of interest
ATH = All time high
LQ = Liquidity zone
Gold since the beginning has been moving in a range and break fashion you'll see this across the board, always. A 4hr range is in the process of being formed ideally what wed like to see is for the high to be matched first. That simply would give more confidence for the bears to get in and short the market however now we sit with the though of where will it go first?
preferred bias
Buys to sell, ideally and the most logical outcome is the highs do get matched forming a strong liquidity zone that can be targeted at a future date, as price begins to fall new points of interest can then be formed (since there isn't a lot to target above right now), this will allow the market to have areas it can market when we see the bullish side of this range play out when ever that may be.
Structure
Current structure allows you to get in trades, previous structure allows you to get out of trades use it to your advantage, think. where does the money want to move next where will the banks get the best bang for their buck and most importantly where can we cause traders to LOSE, a trade you win is a trade someone else lost. so long you stick with where the big guys want to go you'll be on the right side
Bullish bias (green)
Key points get broken, imbalance fill, ATH matched (this is where short orders get stacked, future sweep target.
Bearish bias (red)
Area 1 , this is the first key low im looking to break if we see a candle close below continue to area 2, there are traders who WILL get stopped out at zone 1
Area 2 , this is our next key point in structure there will still be traders with open positions here also, again if we see a candle close below this zone continue to monitor for Area 3
Area 3, this may be a final target, however there's still POI's sat below if price shows strong signs of bearish momentum target Areas 4 and below can be open for discussion
Conclusion
personally i would like to see POI's built on the buy side as of right now before we move down simply because the market NEEDS somewhere to move from and to without that it would be erratic.
If you found this helpful be sure to boost this idea, give a like and a follow, consistent charts will be posted on a weekly basis and let me know what you think down in the comment section too :)

Gold intraday trading strategyFrom the 4-hour line analysis, today's lower support continues to focus on around 3170-75, strong support is at the 3150 mark, and upper pressure is around 3253-60. Relying on this range as a whole, the main tone of high-altitude and low-multiple cycles remains unchanged. In the middle position, watch more and do less, be cautious in chasing orders, and wait patiently for key points to enter the market.
Gold operation strategy:
1. If gold falls back to 3170-75 and does not break, hold a light long position; if it falls back to 3150-55, add a long position; stop loss at 3144; target at 3226-3230; continue to hold if it breaks;
2. If gold rebounds to 3240-45 and does not break, hold a light short position; if it rebounds to 3253-60, add a short position; stop loss at 3266; target at 3275-80; continue to hold if it breaks;

Geopolitical conflicts dominate gold price fluctuationsFrom a technical perspective, gold closed with a long lower shadow last week, indicating strong support from below. It opened higher on Monday to around $3,252 before falling back, entering a short-term consolidation phase, but the $3,200 integer mark was lost and regained. The daily level stood firmly on the 60-day moving average, and the Bollinger Bands closed, indicating that the market is accumulating upward momentum. Gold is generally bullish this week, with an upper target of $3,280; if it breaks through this resistance level, it may fill the previous gap and further test $3,350 or even $3,400.
Gold's 1-hour K-line shows that gold has bottomed out and rebounded, recovering the losses of last Friday, and is currently close to the upper track of the Bollinger Band. Technical indicators show that there is an obvious bottoming signal below, and there is still room for growth. However, before effectively breaking through $3,280, it is difficult for gold to form a unilateral upward trend. Therefore, this week's operation is considered to be divided into two stages: below $3,280, it is treated as a volatile upward trend, and after breaking through, it will turn into a unilateral upward trend. For gold's short-term operation strategy today, it is recommended to focus on low-level longs and rebound high-level shorts. The short-term focus on the upper resistance of 3250-3260 is 3250-3260, and the short-term focus on the lower support of 3115-3105 is 3115-3105.
Operation strategy:
1. Gold is recommended to go long in the 3220-3215 area, with a stop loss at 3207 and a target of 3230-3240
2. Gold is recommended to go short in the 3250-3255 area, with a stop loss at 3263 and a target of 3235-3225

Market situation unclear? Check out this analysis📰 Impact of news:
1. ADP data is significantly positive
2. Trump: "Mr. Too Late" Fed Chairman Powell must cut interest rates now
📈 Market analysis:
The ADP data is significantly bullish, but we cannot rule out that this is an illusion created by the market, because although the daily line has formed a golden cross, it has not fully released the bullish momentum, and has not been able to exert force in the bullish upward trend. Therefore, I prefer to go long at a low position in the US market rather than chasing it immediately. At the same time, the upper 3365 may become a short-term strong pressure level. If the gold price encounters resistance here, the US market will usher in a retracement, and then it will be our time to go long.
🏅 Trading strategies:
SELL 3360-3365
TP 3340-3330
BUY 3330-3317
TP 3360-3370-3400
If you agree with this view, or have a better idea, please leave a message in the comment area. I look forward to hearing different voices.
TVC:GOLD FXOPEN:XAUUSD FOREXCOM:XAUUSD FX:XAUUSD OANDA:XAUUSD

Is it a pullback or a reversal?Recently, the price of gold has repeatedly broken through the 3400 level, but has failed to stabilize after multiple attempts to break through. Simply put, the 3400 level is like a door that the bulls are desperately trying to push open, but if they can't, gold may pull back to the 3340-3396 level to take a breath. There are currently two key signals in the market: one is that the hourly chart shows that the price of gold has risen too fast in the short term and may need to pull back; the other is that before the release of non-agricultural data, the market tends to be cautious, and the possibility of shorting at high levels is increasing.

Gold trend analysis and layout before ADP data release📰 Impact of news:
1. May ADP data
2. The geopolitical situation worsens
📈 Market analysis:
Today, the gold price in the Asian session hit the 3370 line and then began to fall. Before the release of the ADP data, the gold price is likely to fall into a volatile pattern. The upper short-term resistance is 3370-3380. Pay attention to whether it can break through 3392, which will determine whether the short-term gold price can reach 3400. Pay attention to the support below 3350-3345, and focus on the 3330 line support. Once it falls below 3330, the gold price may reach 3317. If the ADP data is released and stabilizes near 3317, and then quickly closes the long lower shadow. Then you can rely on the 3317 to enter the market and do more. As long as it rebounds to above 3330 again, then the high point near 3390 above will definitely not be maintained. On the contrary, if gold falls below the 3330 and 3317 levels during the US trading session, don't go long easily. Participate in the high-altitude and low-multiple cycle during the European session. If it retreats to 3355-3345, consider going long with a light position and look at 3360-3370. If it touches 3375-3390 and is under pressure, consider shorting. Focus on ADP data!!
🏅 Trading strategies:
BUY 3355-3345
TP 3360-3370
SELL 3375-3390
TP 3350-3340
If you agree with this view, or have a better idea, please leave a message in the comment area. I look forward to hearing different voices.
OANDA:XAUUSD FX:XAUUSD FOREXCOM:XAUUSD FXOPEN:XAUUSD TVC:GOLD

Gold Faces Strong Headwinds – Beware of Bull Traps!After rebounding to 3368 yesterday, gold dropped below 3340, and recovered slightly above 3350 late in the session.
Today, it briefly touched the 3372 resistance, only to pull back again — showing just how difficult it is for bulls to push higher.
🔍 Technical Overview:
30M chart has broken below key moving averages
1H chart is facing heavy overhead pressure
⚠️ If prices rise on low volume, it’s likely a bull trap.
Only a volume-backed breakout can confirm a real bullish trend.
⚠️ Important Note:
There’s still an unfilled gap below 3300
If bears take control, filling that gap is highly likely
Today’s ADP jobs data will be critical:
If bearish for gold → sub-3300 is likely
If bullish for gold → 3400 becomes a top-tier short zone

Gold- Short-Term Bull, Medium-Term BearIn my previous analysis, I pointed out the possibility of Gold correcting back to retest the broken descending trendline.
That zone is now acting as a key confluence area, and as long as the price holds above it, bulls maintain the advantage.
However, beyond the technicals, I also shared my personal view: while we could see some upside in the short term (next few days), I believe that Gold is setting up for another leg down in the medium term.
From a strictly technical perspective, the current price action reinforces the likelihood of a short-term bounce. We're seeing a clean retest of previous resistance turned support, which often leads to continuation moves.
📉 But if you're aiming for 1,000+ pip swings (like me), it's wiser to wait for clear bearish confirmation. The real opportunity may come after this short-term rise, at least in my opinion.
In conclusion:
- Short term is bullish as long as it stays above 3340-3350 in terms of daily close
- In the medium term, my opinion is unchanged, drop to 3200
Disclosure: I am part of TradeNation's Influencer program and receive a monthly fee for using their TradingView charts in my analyses and educational articles.

Gold's high-level shock pattern continuesAccording to the current 4-hour K-line chart, the market as a whole maintains a high-level oscillation pattern. There is a short-term pressure of correction after the high. It is recommended to sell short at highs, supplemented by short-term long orders. It is recommended to wait for a clear stabilization signal to implement a high-altitude trading strategy. Pay attention to the resistance of 3380-3400 on the top and the support of 3330-3310 on the bottom. In terms of specific operation suggestions, it is recommended to consider establishing short orders when the price rebounds to the two ranges of 3370-3375 and 3400-3405.
Gold is recommended to short when it rebounds to around 3370-3375, with a stop loss at 3383. In the short term, it is expected to be around 3350-3330, with a target of 3300. If it breaks, short at around 3400-3405, with a loss of 3413 and the target as above.

6/4 Gold Analysis and Trading SignalsGood morning, everyone!
Gold experienced a strong intraday reversal yesterday, pulling back sharply after an initial rally. The price rebounded after entering our 3338–3321 buy zone, and is now approaching the 3362 resistance level. Technically, the short-term structure remains within an ascending rebound channel.
Key resistance levels to watch today:
First resistance near 3378
Psychological level at 3400
Extended resistance zone at 3416–3438
If price stalls near 3362 and pulls back, support is expected around 3345–3336, which could form a secondary bottom. If the rejection happens closer to 3380, then 3358–3352 is the support zone to watch. Should gold rally into the 3400–3416 area, keep a close eye on 3385, 3372, and 3365 as potential pullback supports.
📉 Technical Outlook:
4H chart: Price remains in a mild uptrend channel, with key structural support at 3323–3307. However, volume is not confirming the rally, and a potential double top formation cannot be ruled out.
1H chart: Strong support lies at 3343. The MACD is at a decision point, with bulls slightly favored. If volume increases, gold may retest the 3390 high or even push higher.
🗞 Fundamental Factors:
Today, focus on the ADP Employment Report and key Fed-related news during the U.S. session, which may create sharp intraday volatility or alter the trend trajectory. Be especially alert during the New York session.
📌 Today’s Trade Plan:
Sell between 3418–3438
Buy between 3318–3306
Key levels for tactical trades:
3413 / 3392 / 3381 /3365 / 3358 / 3343 / 3328
Strategy Outlook:
Maintain a “sell high, buy low” intraday approach, focus on volume-driven breakouts, and avoid chasing extreme moves blindly.

XAU/USD Bearish Rejection at Resistance – Potential Drop Ahead!XAU/USD Bearish Rejection at Resistance – Potential Drop Ahead! 💥
🔍 Technical Analysis:
Instrument: Gold vs US Dollar (XAU/USD)
Timeframe: Daily
Current Price: $3,363.26
Resistance Zone: $3,380 – $3,470
Support Zone: $2,970 – $3,100
🧠 Market Context:
Gold has recently approached a well-defined resistance zone near the $3,380–$3,470 range. Price action shows multiple rejection wicks and failed attempts to break above this level, indicating strong selling pressure from bears. 🐻
The current candlestick structure suggests the market is printing lower highs, which may indicate a transition from a consolidation phase into a potential bearish trend.
📉 Projection:
The chart projects a move down toward the support zone, around $2,970–$3,100, possibly due to:
Repeated rejections at the resistance zone 🔄
Lack of bullish momentum near highs ⚠️
Bearish engulfing or reversal candlestick formations 🔻
✅ Key Levels to Watch:
Level Type Price Zone Action
🔴 Resistance $3,380 – $3,470 Strong rejection expected
🟢 Support $2,970 – $3,100 Major demand zone; potential bounce
🧭 Trading Outlook:
⚠️ If price fails to break above the resistance zone, short opportunities may develop with a target near the support zone. A confirmed break and close below $3,300 would strengthen bearish sentiment.
📌 Bearish Bias Maintained Until Resistance Breaks

XAU/USD selling below 3364 or Buy next impulseI believe this is a corrective move ,since 5th wave leg rejected from 0.707.
so, planning to sell below 3364 and holding till 3340.
if 5th wave extends then it won't break 3364 and sustains.
Im on sell side

Long orders have made profits, gold layout in the evening📰 Impact of news:
1. Economist: The Federal Reserve may cut interest rates sharply in December
2. Lee Jae-myung, candidate of the Democratic Party of Korea, was elected president of South Korea
📈 Market analysis:
Currently, the gold price is in a consolidation pattern, showing an overall volatile pattern during the day. The hourly Bollinger Bands are opening downward, and the MACD indicator is running in a dead cross. In the short term, the bears have a certain advantage. However, observing the 4H level, it can be found that the RSI indicator crosses when entering the overbought area, suggesting that the risk of a correction in the short term has increased. For evening operations, it is recommended to wait for the gold price to stabilize before entering the market, focusing on the important support of 3335-3325. If it obtains effective support and stabilizes in this range, the gold price may resume its upward trend. If it falls below 3325, the bullish momentum will be weakened. Therefore, it is recommended to wait for a pullback to 3335-3325 to go long in the US market, and look to 3350-3370 in the short term.
🏅 Trading strategies:
BUY 3335-3325
TP 3350-3370-3400
If you agree with this view, or have a better idea, please leave a message in the comment area. I look forward to hearing different voices.
TVC:GOLD FXOPEN:XAUUSD FOREXCOM:XAUUSD FX:XAUUSD OANDA:XAUUSD

6/3 Gold Analysis and Trading SignalsGood morning, everyone!
Gold climbed to the 3370 area yesterday without showing any significant pullback, indicating that bullish momentum remains intact. After this morning’s opening, the price continued to rise, and from a technical perspective, there’s still room for further upside. The 3400 level is likely to be tested today, and if accompanied by increased volume, gold may extend gains towards the 3416–3438 resistance zone.
From a tactical standpoint, a technical retracement after today’s rally is the base case scenario, and intraday trades can be structured within the broader 3440–3320 range. On the downside, the 3368 level is the first key support to watch, followed by 3352, which could serve as a pivot area if a pullback occurs.
On the macro front, two economic data releases are scheduled during the US session, along with a Q&A session involving Fed’s Goolsbee, which could inject short-term volatility into the market.
📌 Trade Plan for Today:
Sell within the 3416–3438 zone, with controlled position sizing; short-term strategy preferred.
Buy near the 3338–3321 support area, with a defensive setup and tight risk control.
Flexible trading levels to monitor: 3421 / 3413 / 3397 / 3386 / 3367 / 3358 / 3343
Strategy outlook: Adopt a “sell high, buy dips” short-term strategy today. Avoid chasing breakouts blindly; focus on rhythm and structure.

The latest trend analysis and operation layout of Europeanmarket📰 Impact of news:
1. Speech by the Federal Reserve during the US trading session
2. Geopolitical and tariff issues
📈 Market analysis:
Recently, the escalation of the Russia-Ukraine conflict and global trade tensions has pushed international gold prices to rise strongly. Although Russia and Ukraine reached a consensus on prisoner exchange in the second round of negotiations on Monday, the ceasefire agreement remained deadlocked. Coupled with the US announcement of additional steel tariffs, geopolitical risks and economic uncertainties stimulated risk aversion sentiment.
From a technical perspective, the upward trend of gold since 3120 is clear. After breaking through 3340 on Monday, it accelerated to test the 61.8% Fibonacci resistance level of 3396, but the pressure at the 3400 integer mark is significant. At the same time, 3330 below is still the current key support level. The current decline in gold prices is more like a technical correction to yesterday's rise. Yesterday, we reminded everyone to pay attention to the 3355 level. The intraday operation suggestion for the European session is 3355-3345. You can try to go long and look at the 3370-3380 line. If it breaks through effectively, it will test the 3396 or even 3400 line; if it fails to break through the upper resistance, it will fall into a range of fluctuations.
🏅 Trading strategies:
BUY 3355-3345
TP 3370-3380-3390
SELL 3370-3380
TP 3350-3340-3330
If you agree with this view, or have a better idea, please leave a message in the comment area. I look forward to hearing different voices.
OANDA:XAUUSD FX:XAUUSD FOREXCOM:XAUUSD FXOPEN:XAUUSD TVC:GOLD

Long XAUUSD 15m – Long Trade Plan After Liquidity Grab📊 XAUUSD 15m – Long Trade Plan After Liquidity Grab
OANDA:XAUUSD
Hello Traders! 👋
Spotted a clean setup on Gold (XAUUSD) on the 15-minute chart, and I wanted to break it down for everyone looking to learn and grow with smart money concepts and liquidity-driven trading.
---
🔍 Trade Breakdown:
After a sharp bearish move, price aggressively broke below the Old High structure and formed a New Breakdown Low. This move likely triggered stop-losses and induced sellers — a classic liquidity grab scenario.
What followed is key:
Price tapped into a demand zone and showed clear rejection wicks.
It then consolidated just below the old structure — potentially accumulating orders for a reversal.
This gave me confidence to look for a long opportunity as part of my "Smart Money Reversal Strategy".
---
📌 Trade Plan Details:
Entry Zone: Around 3,358 – 3,360
Stop Loss: Below the recent low (~3,350)
Target 1: Previous structure resistance near 3,366 – 3,370
Target 2: Full range fill toward 3,389 – 3,390+
If price breaks and holds above the red supply zone, I’ll look for additional confirmation for scaling in or trailing.
---
🧠 Why This Matters:
This setup highlights the importance of:
Trading after liquidity sweeps, not during.
Recognizing how market makers trap early sellers before reversing.
Using structure and zones — not just indicators — to guide entries.
---
📘 Note for Members:
This trade is shared for educational purposes only. Always manage your risk and never blindly follow — plan your trades, then trade your plan!
Let me know your thoughts or how you'd approach this differently.
— Happy Trading! 💰
#XAUUSD #SmartMoney #LiquidityGrab #Forex #GoldAnalysis #TradingView

gold bearish await#XAUUSD price have retest below the third pattern, now main expectation is about to come.
Below the 3350 shows a strong bearish continuation which will reform below 3341, main possible target is below 3326, SL 3365.
Above 3368 on breakout will continue bullish movement till 3388

XAUUSD Analysis todayHello traders, this is a complete multiple timeframe analysis of this pair. We see could find significant trading opportunities as per analysis upon price action confirmation we may take this trade. Smash the like button if you find value in this analysis and drop a comment if you have any questions or let me know which pair to cover in my next analysis.

Buy or Sell XAUUSD Gold? How the Stock Market Could Decide!🚨 Market Breakdown: Gold (XAUUSD) 🪙📉📊
At the moment, I’m closely monitoring XAUUSD (Gold) 🔍. Before diving in, it's crucial to zoom out and gain a macro perspective 🌍. This means analyzing key support and resistance levels on the weekly and daily timeframes 📅 using price action as our primary guide.
📈 Gold has seen a strong rally — it’s overextended at this point. A deeper pullback could be on the cards. If we get that retracement alongside a bullish break of structure, I’ll be eyeing a potential long setup 🛒.
However, this bias is conditional 🔄. If the stock market pulls back, that could strengthen the case for a gold buy. On the flip side, if equities continue to rally, I’d likely shift toward a bearish stance on gold 🐻.
🎥 Everything is broken down clearly in the video.
❗️Disclaimer: This is not financial advice. The analysis shared is for educational and informational purposes only. Always do your own research and manage your risk accordingly.

Evening gold analysis and trading point layout📰 Impact of news:
1. Fed's Goolsbee: Despite the unresolved tariff issue, it is still believed that interest rates are expected to fall in the next 12 to 18 months
2. May PMI data is positive
3. Russian media: Russia lists the full withdrawal of Ukrainian troops from Russian territory as one of the ceasefire options
📈 Market analysis:
Judging from the 4H chart, gold is currently fluctuating around the 3370 line, and the bulls are still relatively strong. We should pay attention to the short-term support at 3365-3355 below, and the short-term suppression at 3385-3395 above. If it breaks through the upper suppression, we will pay attention to the 3400 line suppression position. The recent market fluctuations have been relatively large, so bros must set take-profit and stop-loss when trading independently!
🏅 Trading strategies:
BUY 3365-3355
TP 3370-3380-3400
If you agree with this view, or have a better idea, please leave a message in the comment area. I look forward to hearing different voices.
TVC:GOLD FXOPEN:XAUUSD FOREXCOM:XAUUSD FX:XAUUSD OANDA:XAUUSD
