Gold Reclaims 3300, Faces Heavy Resistance AheadGold surged after Monday’s market open, reclaiming the 3300 level, and has already made an initial attempt at the 3306–3312 resistance area, where the 2H MA60 lies. Short-term indicators have started to turn bullish, but several resistance levels lie ahead:
3306–3312: First major resistance
3326–3332: Next target resistance area
Around 3357: Previous gap zone, strong pressure
The upside is full of obstacles, and bulls will need strong momentum to push through.
Also, keep in mind:
Rapid upward moves are often followed by pullbacks. If the price retraces, pay attention to:
Support at 3288–3276
If this zone holds, further upside is likely
Watch for support/resistance role reversals:
A resistance level becomes support once broken
A support level becomes resistance once it breaks
Valid breakouts are confirmed when price stays above/below without immediate reversal
This is one of the most reliable and practical trading principles.
📉 Medium-Term Trend Still Bearish
The broader trend is still in a downward correction. Stay cautious and disciplined with short-term bullish moves.
📅 This week is loaded with key macroeconomic events, including:
PMI Manufacturing
ADP Employment
Non-Farm Payrolls (NFP)
Unemployment Rate
Fed-related speeches and economic commentary
Expect high volatility — great for profits if executed well, but dangerous if misjudged. Opportunities come with risks, so manage them wisely.
Xauusdupdates

XAUUSD – After the Surge, Is the Down Correction Really Over?🟡 What Happened Yesterday
Gold surged strongly yesterday due to escalating geopolitical tensions and a new chapter in the global tariff saga. From top to bottom, the range counted over 1200 pips, marking one of the most volatile sessions in recent weeks.
❓ Is the Down Correction Finished or Will It Continue?
Technically, the chart looks bullish at this moment. The descending trendline has been broken, and the 3350 horizontal zone is now forming a confluence support area.
However, I remain cautious.
Despite the bullish signal, this yo-yo price action could continue. The idea that Gold has not yet finished correcting the broader uptrend still persists in my mind and the 3200 level remains a strong candidate for retesting in the appropriate future.
📊 Why I Expect Further Down Correction
The recent spike might be reactionary, not structural
3340–3350 could provide short-term support, but it may not hold long-term
The overall macro structure still leaves room for another leg down
📉 Trading Plan
While the market holds 3340–3350 support, we might see a bounce toward 3400.
But I prefer to stay out for now and I would buy in that zone only with low volume and clear confirmation
If the 3340 zone fails, I’ll start watching for a new drop to 3280 zone and eventually 3200.
🚀 Wait for Confirmation In both cases, bullish or bearish
The key right now is confirmation. Volatility is high, and the narrative shifts fast.
Disclosure: I am part of TradeNation's Influencer program and receive a monthly fee for using their TradingView charts in my analyses and educational articles.

XAUUSD TechnicalsThe chart presents a pivotal moment in Gold (XAU/USD) on the 1-hour timeframe, as price reacts to a key structural zone. After a strong impulsive bullish move earlier in the session, price rallied sharply toward the $3,370–$3,385 range. But now, a visible retracement has pulled it back into a well-defined support zone that previously acted as resistance.
At this moment, the market is at an inflection point — visually represented by the orange confluence circle, where the current price intersects a previous consolidation breakout level and sits right above a deeper support band.
What's happening technically?
Price is now retesting the purple support box, which overlaps closely with the base of the bullish breakout that occurred earlier. This is significant because it could function either as:
Support confirmation: where the market "respects" the previous breakout zone, establishing it as a new demand area and thus signaling the continuation of the uptrend.
Fakeout zone: where the price loses this level, indicating that the prior bullish impulse was unsustainable, setting up for a deeper correction — possibly down toward the $3,335 or even $3,310 regions.
The small candle forming at the support zone shows slowing bearish momentum, which could be interpreted as the first signs of stabilization. But the volume tells us more — earlier bullish momentum came with strong volume spikes, while the recent pullback seems to be on declining volume, which can often indicate profit-taking rather than full-blown reversal pressure.
Interpreting the two potential paths:
If price holds above the purple zone and shows bullish candle confirmation (like a bullish engulfing or a strong pin bar), there's a good probability that gold will resume its bullish leg, potentially retesting $3,385 and stretching further to $3,400+.
However, if price decisively breaks below the orange confluence zone (especially below $3,350 with a large bearish candle and volume spike), then bears could regain control and drive it toward $3,320 or even lower. In this case, the earlier rally would appear as an exhaustion move or news-driven spike.

GOLD H1 Intraday Chart For 3 June 2025Hello Traders,
GOLD is in mid term Bullish Trend for now as we already captured nice pips yesterday with directional sequence
but now all eyes on 3400 Psychological Level Breakout once it will break market will move towards 3430
for market in is consolidation zone between 3340-60 and expected to move back towards 3380 or even 90
if market breaks 3330 successfully today then it will move towards 3330 Psychological Level
Disclaimer: Forex is Risky

XAU/USD Price Action Analysis – Bullish Breakout Setup XAU/USD Price Action Analysis – Bullish Breakout Setup 🚀
🔍 Chart Overview:
This chart illustrates the price movement of XAU/USD (Gold vs USD) on a mid-term time frame, highlighting a potential bullish breakout scenario from a key resistance zone.
🟩 Key Levels:
Support Zone: 🛡️
➤ $3,140 – $3,200
This zone has acted as a strong support multiple times, preventing further declines and serving as a springboard for bullish moves.
Breakout Zone (Current Level): ⚡
➤ $3,340 – $3,390
Price is currently testing this crucial resistance-turned-potential-breakout zone. A successful close above this level could confirm bullish continuation.
First Target: 🎯
➤ $3,435.87
This intermediate resistance aligns with a previously tested high. It may act as the first barrier after the breakout.
Second Target: 🥇
➤ $3,502.13
This is the major resistance zone. If bulls maintain momentum, this area will likely be tested.
🧭 Market Structure & Bias:
Price is forming higher lows, signaling growing bullish strength.
The chart shows a bullish breakout of a sideways consolidation zone.
The upward arrows and curved projection suggest a potential pullback-retest scenario at the breakout level before rallying towards targets.
🧠 Trading Plan (Illustrated by Chart):
📈 Breakout Entry:
Wait for confirmation above $3,390 with strong bullish candles and volume.
🔁 Retest Opportunity:
If price pulls back to the breakout zone ($3,340 – $3,390), this may serve as a solid re-entry point for long positions.
🎯 Profit Targets:
TP1: $3,435
TP2: $3,502
🛑 Invalidation:
A strong close back below $3,320 may invalidate the bullish bias.
📌 Conclusion:
The chart indicates a bullish continuation setup for XAU/USD with clearly defined breakout, retest, and target zones. Traders should monitor price action closely around the breakout area for confirmation before entering long positions. Risk management remains key. 🧮⚖️

Gold:Take a short position
Gold: hourly level to see the top, technical form has the trend of adjustment, short - term can be considered short.
Trading Strategy:
sell@3370-75
tp1:3360
tp2:3345-40
↓↓↓ More detailed strategies and trading will be notified here ↗↗↗
↓↓↓ Keep updated, come to "get" ↗↗↗

Gold stumbles at 3379 resistance! Bull-bear eyes 3360-3390 zone I. Resistance and Support Levels
Resistance 🚧: The intraday high of 3379 acts as initial resistance, with strong resistance in the 3390-3400 zone 🏔️.
Support 🛡️: Initial support is at 3360-3365, while strong support lies in the 3325-3330 range 📉.
II. Trading Strategies
(1) Aggressive Long Position 🚀
Entry 📊: Lightly initiate long positions when the price pulls back to the 3365-3368 zone and stabilizes (e.g., bullish candlestick patterns appear 🔥).
Stop Loss ⛔: Exit if the price breaks below 3360.
Targets 🎯: First target at 3390; if breached, aim for 3435* (Note: "34350" in the original text is likely a typo—adjust based on actual market conditions ⚠️).
(2) Conservative Long Position 📈
Entry ⏳: Enter long after the price validly breaks above 3379 and retests support at the 3390-3395 zone 🔄.
Stop Loss ⚠️: Exit if the price falls below 3375.
Targets 🎯: Same as the aggressive long strategy 📍.
(3) Short Position 📉
Entry 📊: Lightly initiate short positions if the price rejects resistance in the 3380-3385 zone (e.g., bearish candlestick patterns form 📉) or fails to break above 3390 and drops below 3375 ⬇️.
Stop Loss ⛔: Exit if the price breaks above 3388.
Targets 🎯: First target at 3360; if breached, aim for 3330 🏁.
Professional trading strategies are pushed daily 📊
Lock in precise signals amid market fluctuations 🚀
Confused about market trends? Stuck in strategy bottlenecks?
Real-time strategies serve as your "trading compass" 🌐
From trend analysis to entry/exit points, dissect market logic comprehensively
Refer now 📲
Help you move steadily forward in investments ✨
👇👇👇

Don't chase long positions easily during high-level adjustments📰 Impact of news:
1. The conflict between Russia and Ukraine breaks out again, exacerbating the uncertainty of the situation
2. The tension in the Middle East continues, Iran claims to be ready to defend its airspace at any time, and the Houthi armed forces attack Israeli airports
3. May PMI data released
📈 Market analysis:
In the short term, the double high points above the gold price are suppressed at the 3365 line. The MACD indicators at the 4H and daily levels tend to form a golden cross, releasing bullish signals. In the short term, if you want to confirm a unilateral upward trend, you need to break through the 3365 line. Despite the strong bullish signals, as I just reminded you, the current technical indicators are close to overbought areas, and I still think there is a certain risk of a correction. In the European session, I will consider trying to short at the 3355-3365 line, and pay attention to the short-term support at 3340-3330 line below. Later, after the price gets some support at the support level, we can consider long trades.
🏅 Trading strategies:
SELL 3355-3365
TP 3340-3330-3320
If you agree with this view, or have a better idea, please leave a message in the comment area. I look forward to hearing different voices.
OANDA:XAUUSD FX:XAUUSD FOREXCOM:XAUUSD FXOPEN:XAUUSD TVC:GOLD

6/2 Gold Analysis and Trading SignalsGood evening, traders!
Gold surged more than $70 today, reaching an intraday high of 3363.
If you held short positions from last Friday’s close based on my plan, I hope your SL protected you from major losses.
📉 Technical Insight:
The rapid rally has triggered overbought signals and correction pressure
Watch for pullback support levels at:
3342
3328–3321 zone
If these hold, price might retest 3400 tomorrow
🎯 Trading Plan:
📉 Sell around 3360–3372 (with tight stop)
📈 Buy near 3328–3318 (if price stabilizes)
🔁 Scalp zones:
3332 / 3338 / 3343 / 3352 / 3366

gold on sell retrace#XAUUSD price have been bullish since tension increases, now price is trying to correct before any further movement.
Firstly we await price to fall below 3341 to sell, Target 3331-3317. Stop loss 3357
Any further breakout above the 3366 will form a strong bullish which will reach 3390-3420

Market Analysis: Gold Price Could Gain Bullish PaceMarket Analysis: Gold Price Could Gain Bullish Pace
Gold started a fresh increase above the $3,300 resistance level.
Important Takeaways for Gold Price Analysis Today
- Gold price started a steady increase from the $3,250 zone against the US Dollar.
- A connecting bearish trend line is forming with resistance at $3,318 on the hourly chart of gold at FXOpen.
Gold Price Technical Analysis
On the hourly chart of Gold at FXOpen, the price found support near the $3,250 zone, formed a base, and started a fresh increase above the $3,280 level.
The bulls cleared the $3,300 zone and the 50-hour simple moving average. There was also a move above the 61.8% Fib retracement level of the downward move from the $3,331 swing high to the $3,271 low. The RSI is now above 50 and the price could aim for more gains.
Immediate resistance is near the 76.4% Fib retracement level of the downward move from the $3,331 swing high to the $3,271 low at $3,318. There is also a connecting bearish trend line forming with resistance at $3,318.
The next major resistance is near the $3,330 level. An upside break above the $3,330 resistance could send Gold price toward $3,382. Any more gains may perhaps set the pace for an increase toward the $3,400 level.
Initial support on the downside is near the $3,300 zone. If there is a downside break below the $3,300 support, the price might decline further.
In the stated case, the price might drop toward the $3,270 support. The next major support sits at $3,250. Any more losses might send the price toward the $3,220 level.
This article represents the opinion of the Companies operating under the FXOpen brand only. It is not to be construed as an offer, solicitation, or recommendation with respect to products and services provided by the Companies operating under the FXOpen brand, nor is it to be considered financial advice.

Gold 1D timeframe. What Next Moment?Hello everyone, I am back after 3 years. Finally I have decided to continue my trade journey in forex and crypto professionally.
Here is the analysis of XAUUSD/Gold.
Gold has taken a big bold moment of Uptrend since strong resistance breakout on march of 1st, 2024. Since that time Gold didn't looked back & continued it's rally in uptrend. So our major trend is Uptrend in 1D and 4H timeframe. Gold did some downtrend and sideway rally and again took another uptrend rally on Dec of 18th, 2024. Gold break all top high and made new high 3500.
If I talk in 1D timeframe gold is trading in bullish flag, and I am not wishing it right now to break upward. But has you know it is gold anything can happen. While today is Monday and market opening was in gap. So it needs to fill the gap after that we can execute a trade. Still now needs some confirmation that it will come down. So have patience and watch the market carefully.
Key point.
Resistance - 3356, 3369, 3396
Support - 3343, 3323, 3304
Any Query Reach Us or comment down
Rudra Vasaikar Wishes You A Great And Very Amazing Trading Life. Trade Safe, Trade Right.
RISK WARNING 🔴 🔴 🔴
There is high risk of loss in Trading Forex, Crypto, Indices, CFDs, Features and Stocks. Choose your trade wisely and confidently, please see if such trading is appropriate for you or not. Past performance is not indicative of future results. Highly recommended - Information provided by Pro Trading Point are for Educational purpose only. Do your investment according to your own risk. Any type of loss is not our responsibility.
HAPPY TRADING.
#gold #xauusd #xauusdtrading #goldtrading #goldanalysis #forextrading #forex #trendline #goldsignals #goldnews goldlatestanalysis #xauusdtradesetup #forextradingguide #fxgold

Will Gold drop to 3200 zone next week?🟡 1. What happened last week with Gold (XAUUSD)
Gold began last week by testing the 3350 resistance zone, hinting the end of the correction and the potential for an upside breakout.
However, in the following days, the market reversed aggressively, reaching as low as 3250 on Thursday — a drop of nearly 1000 pips from the local top and resistance zone.
After this sharp fall, Gold bounced back above 3300, retested the 3325–3330 area, but failed once again — closing the week below 3300.
❓ 2. Key question: Has the rebound ended or is it just a deeper trap?
The market has shown a fake-out followed by compression under resistance.
So the real question becomes: Will the 3280–3290 support finally give in, or will bulls defend it again?
________________________________________
🔻 3. Why I expect a continuation to the downside
Here’s what the chart structure tells us:
• Clear lower highs and lower lows — the trend remains bearish
• 3330 has turned into major confluence resistance
• Every bounce is sold, showing fading bullish momentum
• The support at 3280–3290 is being squeezed repeatedly
If 3280 breaks cleanly, price action will likely accelerate downward.
________________________________________
🧭 4. Trading Plan for Next Week
Focus remains on selling rallies, especially if price rises above 3300.
📉 Invalidation: any clean break and hold above 3330
🎯 Target Zones:
• 3250 = Soft target (first reaction zone)
• 3200 = Real target (bearish continuation zone if structure unfolds as expected)
Use structure, not emotion. Let the breakout confirm the plan.
________________________________________
🚀 5. Final thoughts
The price action around 3280 will likely set the tone for next week.
A breakdown here confirms the bearish structure and opens the door to 3250, then 3200.
Until then: sell rallies, manage risk, and wait for the chart to validate your edge.
Stay sharp. 🚀
Disclosure: I am part of TradeNation's Influencer program and receive a monthly fee for using their TradingView charts in my analyses and educational articles.

XAUUSD:BUYAfter the good news came out. XAUUSD followed my expectations. Continued to rise above 3300. The current quotation is 3317.
The tariff issue was released again over the weekend. Inflation fermented again, and the Russian-Ukrainian negotiations reached a tense and uncertain stage again.
Traders who followed me to buy near 3290 successfully made good profits.
Trading reference
XAUUSD:
Pressure position: 3360-3350
Support position: 3305-3295
BTCUSD:
Pressure position: 107000-106000
Support position: 103000-102000
This week, there is the impact of the release of non-agricultural data.
Usually divided into the front, middle, and back end of the triple impact. For traders, every time is a good trading opportunity. The impact is also very large.
This week, we will focus on the impact of news and the stimulation of news to layout the wonderful transactions of XAUUSD and BTCUSD. Remember not to trade independently to avoid losses. If you have any ideas, remember to leave a message to me and my assistant.

XAU/USD 02 June 2025 Intraday AnalysisH4 Analysis:
-> Swing: Bullish.
-> Internal: Bullish.
Analysis and bias remains the same as analysis dated 23 April 2025
Price has now printed a bearish CHoCH according to my analysis yesterday.
Price is now trading within an established internal range.
Intraday Expectation:
Price to trade down to either discount of internal 50% EQ, or H4 demand zone before targeting weak internal high priced at 3,500.200.
Note:
The Federal Reserve’s sustained dovish stance, coupled with ongoing geopolitical uncertainties, is likely to prolong heightened volatility in the gold market. Given this elevated risk environment, traders should exercise caution and recalibrate risk management strategies to navigate potential price fluctuations effectively.
Additionally, gold pricing remains sensitive to broader macroeconomic developments, including policy decisions under President Trump. Shifts in geopolitical strategy and economic directives could further amplify uncertainty, contributing to market repricing dynamics.
H4 Chart:
M15 Analysis:
-> Swing: Bullish.
-> Internal: Bearish.
Analysis and bias remains the same as analysis dated 22 May 2025.
In my analysis from 12 May 2025, I noted that price had yet to target the weak internal high, including on the H4 timeframe. This aligns with the ongoing corrective bearish pullback across higher timeframes, so a bearish internal Break of Structure (iBOS) was a likely outcome.
As anticipated, price targeted strong internal low, confirming a bearish iBOS.
Price has remained within the internal range for an extended period and has yet to target the weak internal low. A contributing factor could be the bullish nature of the H4 timeframe's internal range, which has reacted from a discounted level at 50% of the internal equilibrium (EQ).
Intraday Expectation:
Technically price to continue bullish, react at either premium of internal 50% EQ or M15 demand zone before targeting weak internal low priced at 3,120.765.
Alternative scenario:
Price can be seen to be reacting at discount of 50% EQ on H4 timeframe, therefore, it is a viable alternative that price could potentially print a bullish iBOS on M15 timeframe.
Note:
Gold remains highly volatile amid the Federal Reserve's continued dovish stance and persistent geopolitical uncertainties. Traders should implement robust risk management strategies and remain vigilant, as price swings may become more pronounced in this elevated volatility environment.
Additionally, President Trump’s recent tariff announcements are expected to further amplify market turbulence, potentially triggering sharp price fluctuations and whipsaws.
M15 Chart:

Is the positive news fading? The latest analysis of gold📰 Impact of news:
1. The conflict between Russia and Ukraine breaks out again, exacerbating the uncertainty of the situation
2. The tension in the Middle East continues, Iran claims to be ready to defend its airspace at any time, and the Houthi armed forces attack Israeli airports
3. May PMI data released
📈 Market analysis:
As geopolitical conflicts between Russia and Ukraine and the Middle East broke out again over the weekend, gold jumped higher today. From a technical perspective, the 1H chart shows a bullish arrangement, but the gold price is in a downward channel at the daily level. The gold price is currently near the middle track of the Bollinger Band and is obviously suppressed by the downward channel. The 4H level Bollinger Bands narrowed, the moving averages adhered, the long and short positions were in a stalemate, and the MACD indicator hovered around the 0 axis. 3330 - 3335 above is the key resistance area. If it breaks through 3340, it is expected to continue to see new highs. At the same time, there is short-term support in the 3285-3280 range below. 3270 - 3265 becomes the key important support. If it falls below, it may fall to 3245. For short-term operations in the Asian and European sessions today, if the resistance area of 3325-3335 cannot be effectively broken through, you can consider shorting and look towards 3310-3290 in the short term.
🏅 Trading strategies:
SELL 3325-3335
TP 3310-3290
If you agree with this view, or have a better idea, please leave a message in the comment area. I look forward to hearing different voices.
TVC:GOLD FXOPEN:XAUUSD FOREXCOM:XAUUSD FX:XAUUSD OANDA:XAUUSD

Here's a weekly buy-side analysis🟢 Bias: Bullish (Buy)
Gold remains in a long-term uptrend, with fundamental and technical factors supporting continued upside.
50 & 100 EMA: Price is well above both EMAs, confirming bullish momentum.
RSI: Around 60–70 on the weekly; no bearish divergence yet.
MACD: Histogram ticking upward with bullish crossover in play.⚠️ Risk Factors
Sudden USD strength due to surprise Fed hawkishness.
Strong U.S. labor or inflation data that pushes bond yields higher.
Gold profit-taking near ATH could cause sharp but temporary pullbacks.

GOLD H1 Chart Update For 2 June 25As you can see that there are some important zones mentioned on the chart
First read all details carefully market is in sideways for now once market will break 3330 level then it will move further higher towards 3360 even 3370
3300 Psychological Remains in focus once market breaks 3300 then it will try to fill the OPENING GAP which is due on 3289
for today if market sustains below 3280 level then it will move towards 3240-50 zone
Scalping or shorter term range in 3295-3320
Remember always use SL
Disclaimer: Forex is Risky

Gold hourly chart bears dominateFrom the gold 1-hour K-line chart, the current price continues to be suppressed by the key resistance level of 3325. This Friday, the Asian and European trading sessions showed a clear downward trend, reaching a low of 3271. The rapid rebound on Thursday easily induces investors to chase the rise, but the decline on Friday once again shows that there is a major market wash-out behavior. Given that the overall weak consolidation pattern on Friday is expected to face new downward pressure at the beginning of next week. At present, the gold 1-hour moving average system has turned to a short arrangement, and a golden cross signal has not yet been formed, indicating that the short momentum is continuing to accumulate. Therefore, I suggest adopting a rebound short trading strategy. If the price fails to break through the 3310 resistance level after the rebound, you can consider establishing a short position near this position next week to seize the opportunity to continue the short trend. Operational suggestions: Consider the layout of short orders after the price rebounds to the 3308-3312 range. This key area needs to be paid special attention.

XAUUSD Analysis todayHello traders, this is a complete multiple timeframe analysis of this pair. We see could find significant trading opportunities as per analysis upon price action confirmation we may take this trade. Smash the like button if you find value in this analysis and drop a comment if you have any questions or let me know which pair to cover in my next analysis.

Elliott Wave Analysis – XAUUSD Trading Plan | June 2, 2025
🌀 Current Wave Structure
On the H1 timeframe, wave 2 (black) appears to have completed as a zigzag pattern, with price reacting strongly after touching the 3272 level — signaling that the abc corrective wave (green) may be finished.
Zooming into the M10 timeframe, the recent rally shows a 5-wave leading diagonal, indicating that wave 1 (red) is complete.
Currently, price is in the pullback phase of wave 2 (red).
📍 The ideal correction zone for wave 2 (red) is around 3281, which is our key area to look for Buy opportunities.
However, if price breaks below 3272, this wave count becomes invalid, and we’ll wait for a new setup aligned with deeper correction.
🔋 Momentum Outlook
• D1: Momentum is preparing to turn bullish ⇒ supports the start of wave 3 (black) and a bullish outlook for the week
• H4: Momentum is bottoming and about to reverse ⇒ supports wave 3 (red) forming in upcoming sessions
• H1: Currently declining ⇒ expect early-session pullback. Watch for bullish reversal signals as long as 3272 holds for potential entries
✅ Trade Setup
🎯 BUY ZONE: 3282 – 3279
🛑 Stop Loss: 3272
🎯 Take Profits:
• TP1: 3308
• TP2: 3324
• TP3: 3346
⏳ Note: Price action around the 3272–3281 zone will be key to confirming whether wave 2 (red) is complete.
If confirmed, wave 3 could begin with strong momentum — especially after breaking above 3296.

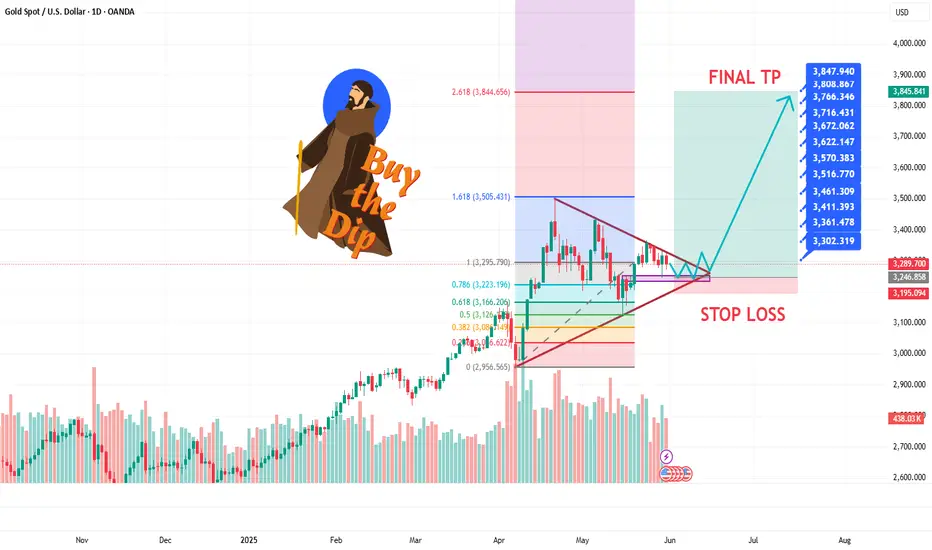
GOLD AND WAR NEXT TO 4K$Hello traders
as i can see gold is trading in a Decending Triangle zone and it had tested Fibo 0.61 ratio in month of may dip as we can see gold close monthly candle above 3280 zone which is a clear sign that big players and banks are still prefer Safe haven we can see US econmey in a bad recession zone unemployment and higher inflation is a big problrm for $ and on all these things Mr. Trump Tariffs is a game changer in commodities markets if we see Geopolitical issues around the world it esculating more war in diffrent regions of the world.. Now Israiel & US have a new biggest problem Iran which is showing us a attack on Iran can be happen incoming days as we can see 6 meetings was unsucessful in Oman for a Deal to Stop Iran's Nucler Enrichment Program which is not good... other then fundamental Charts are crystal clear and showing us a clear view for a New ATH on Gold our Risk reward ratio is prefect for us have a proper research before taking any trade its just an trade idea share your thoughts with us it will help many other traders Comments are open we love your comments and support the channel so it can diliver to many other new traders Stay Tuned for new updates ..
XAU/USD Gold short to long ideaIn this week’s analysis, price is currently positioned between a few key zones where we could expect reactions. Given the overall bullish trend, we’ll be using the broader bias to guide our setups, but there’s also opportunity for tactical short-term plays.
Recently, price has shown strong bearish structure, forming new supply zones such as the 6H supply, which is now close by. If price reacts from this level, there’s potential for short-term sells targeting the clean 9H demand zone below — a solid area where I’ll be looking for a possible Wyckoff accumulation and bullish continuation with the trend.
Confluences for GOLD Shorts:
- Recent strong bearish structure and downside moves
- Significant liquidity and imbalance to the downside
- Well-defined 6H supply zone has formed nearby
- Market appears overbought, and bearish pressure is becoming more visible
- For long-term bullish continuation, price may need to revisit the demand zone below
P.S. If gold pushes higher first and sweeps the liquidity above, I’ll be watching closely for signs of Wyckoff distribution before considering any short-term sell setups. Patience is key — let the market show its hand before reacting.
