Fed Uncertainty and Rejected Trendline ResistanceOANDA:XAUUSD TVC:GOLD Gold trades around $3,270 after rebounding from the $3,240 support zone, but remains capped below the $3,287–$3,290 resistance zone, which now acts as resistance after the breakdown. Technically, the price is struggling under a descending trendline (TL2), and the $3,287 zone also aligns with previous support turned resistance.
Fundamentally, the rejection of Trump's “Liberation Day” tariffs by the U.S. trade court helped ease risk sentiment, reducing safe-haven demand and pressuring gold. At the same time, market focus shifts to today’s U.S. GDP data and Friday’s Core PCE inflation report—both of which may sway Fed expectations and drive short-term volatility.
If XAU/USD fails to break back above $3,287, a renewed test of the $3,240 breakout zone is likely. Sustained downside may open the path to $3,207 or lower. On the upside, reclaiming $3,290 would weaken the bearish bias and challenge the TL2 trendline.
Resistance : $3,287 , $3,302
Support : $3,240, $3,207
Xauusdupdates

Gold Bull vs. Bear Battle: Trading Guide Between Support at 32804-hour chart bullish trend, support at 3280-3285, resistance at 3360 ⭐️.
Long Positions:
Go long on pullback to 3280-3290 📊🎯.
Stop loss: 3270
Targets: 3320 → 3330
Add positions if price holds above 3330 🌟.
Targets: 3350 → 3360
Short Positions:
Short on rally to 3350-3360 ⚠️📉.
Stop loss: 3370
Targets: 3330 → 3320
Risk Control:
Always use stop loss and take profits in batches ✨.
Professional trading strategies are pushed daily 📊
Lock in precise signals amid market fluctuations 🚀
Confused about market trends? Stuck in strategy bottlenecks?
Real-time strategies serve as your "trading compass" 🌐
From trend analysis to entry/exit points, dissect market logic comprehensively
Refer now 📲
Help you move steadily forward in investments ✨
👇👇👇

5/28 Gold Analysis and Trading SignalsGood morning everyone!
Yesterday, gold saw a sharp downward move, and we profited well by trading short based on the double-top pattern.
Yesterday, gold has reached the 3287 support area, and by the end of the U.S. session it rebounded slightly above 3300. Although the rebound lacks strong momentum, it does show that the support zone held on the first test. Whether the bulls can take back control depends heavily on today's follow-up strength.
📊 Key Technical Levels:
If bulls break above and hold 3323–3336, a bullish reversal is likely;
If the bounce is weak, short positions remain the preferred strategy;
4H support: 3268
Daily support: 3172
Before that, 3301–3275 also forms an important support zone;
If price breaks below 3301–3275, especially under negative news impact, a drop to 3150 or even 3100 is not out of the question.
🗞 Key News Focus Today:
Watch for May FOMC-related remarks during the U.S. session, which could become a catalyst for major market movement.
📈 Today’s Trading Plan:
📉 Sell in the 3342–3362 zone (strong resistance)
📈 Buy in the 3258–3248 zone (strong support)
🔁 Flexible intraday levels to monitor:
3336 / 3328 / 3319 / 3306 / 3295 / 3286 / 3274 / 3266
Stay sharp and combine technicals with key news events to make informed trades. Feel free to reach out if you need support — wishing you a profitable day ahead!

Elliott Wave Analysis – XAUUSD Trading Plan | May 28, 2025
🔍 Current Wave Structure
Following yesterday’s sharp decline, price has made a mild recovery and is currently consolidating around the 3314 area. The drop has nearly reached the projected wave C (green) target, but the current rebound — with overlapping small H1 candles — suggests the bullish structure is still unconvincing.
We’re now monitoring two potential scenarios:
✅ Scenario 1 – Correction Completed
Wave C appears to be complete, and the market may be entering a new bullish trend.
However, the overlapping candles on H1 hint that this could be a leading diagonal (wave 1).
In this case, a deeper pullback (wave 2) is expected — likely forming a zigzag or flat correction.
📌 Strategy:
Wait for wave 2 to complete before looking for a better Buy entry.
🌀 Scenario 2 – Ongoing Correction
If price continues to move sideways, we may be in wave b of a double zigzag correction (wave Y).
🎯 Wave c target within wave Y: 3324
If price breaks below 3284 before reaching 3324, wave c may have already started and could complete around 3280–3274.
📈 Momentum Outlook
• Daily (D1): Momentum remains bearish → primary trend still leans downward
• H4: Bullish momentum → short-term recovery possible today
• H1: Near oversold → watch for bullish reversal signals in current zone for intraday Buy setups
🎯 Trade Plan
⏰ Intraday Buy (Scalp):
• Entry: 3292 – 3289
• SL: 3282
• TP1: 3313
• TP2: 3324
🕰️ Ideal timing: During the London session to end of New York session
🎯 Swing Buy Setup:
• Entry: 3280 – 3277
• SL: 3270
• TP1: 3290
• TP2: 3313
• TP3: 3324
🕰️ Ideal timing: European to late US session
🎯 Sell Zone: 3324 – 3327
• SL: 3334
• TP1: 3313
• TP2: 3290
• TP3: 3280
🕰️ Best considered if price reaches resistance during US session or late EU session
📌 All scenarios will be updated once wave 2 is confirmed or price decisively breaks below 3284.
Be patient — let the market give you clear signals before taking action.

Key data will be released, gold will usher in a turning point🗞News side:
1. Musk issued the "strongest" condemnation of Trump
2. Trump and Netanyahu failed to reach an agreement, and the US-Iran negotiations may be "disrupted" by Israel
📈Technical aspects:
Gold prices continued to fall this week as Trump extended the impact of increasing tariffs on the European Union. After stabilizing at 3285 and rebounding yesterday, the gains and losses at 3315 during the day are the key to the subsequent layout. The current Asian session did not stand above 3315 in the morning, which means that the short-term retracement and decline have not ended, and only by breaking through 3315 can there be a chance to continue upward. The 4H level of gold is not so strong at present. The market encountered resistance and fell back at the upper track. Now the market has touched the lower track. The Bollinger Bands have not opened and are still flat, indicating that the market is in a volatile trend in the short term. The support below 3280 just coincides with the lower track. The upper side pays attention to the resistance near the middle track of 3325. If the pressure near the middle track of 3325 is broken, it can be seen to the upper track of 3365. If the market breaks below 3280, it is expected to go to 3260-3250. The European session will temporarily maintain a high-altitude low-multiple cycle. Pay attention to 3315-3325 on the upper side and 3285-3280 on the lower side.
If you agree with this view, or have a better idea, please leave a message in the comment area. I look forward to hearing different voices.
OANDA:XAUUSD FX:XAUUSD TVC:GOLD FXOPEN:XAUUSD FOREXCOM:XAUUSD

Bulls rebounded as expected and broke the intraday highFrom the 4-hour analysis, the support of gold price in the evening is around 3290-95, the pressure above is around 3335-40, and the short-term long-short strength and weakness watershed is 3275-83. Before the daily level falls below this position, continue to look at the long-short oscillation range, and maintain the main tone of high-altitude low-multiple cycle participation.
Gold operation strategy:
1. Go long on gold when it falls back to 3295-3300, and add more positions when it falls back to 3280-85, stop loss at 3273, target 3316-3320, and look at 3338-45 when it breaks;

Geopolitics Fail to Lift Gold as Dollar Regains MomentumOANDA:XAUUSD TVC:GOLD Gold trades near $3,300, respecting TL1 trendline resistance. A break below the $3,289 level may trigger a deeper pullback toward the key $3,247 support zone. On the flip side, reclaiming $3,315 could open the path toward $3,342 resistance.
On the news front, despite escalating Russia–Ukraine tensions and a record drone strike from Moscow, gold failed to gain. Risk sentiment improved after President Trump postponed the 50% EU tariff deadline, lifting both the U.S. dollar and Treasury yields. U.S. consumer confidence also surprised to the upside at 98.0 in May, dampening safe-haven demand.
Markets now await the Fed’s May Meeting Minutes, which may reinforce the cautious hawkish stance. This poses near-term downside risk to gold if policy flexibility remains limited.
Resistance : $3,315 , $3,342
Support : $3,289 , $3,247

GOLD M30 Intraday Chart Update for 28 may 2025Hello Guys, as you can see that GOLD intraday chart just shared with levels
you may do some scalping in the ranging zone, however today strong zone is 3265-3280 which also buying zone but must check confirmation before enter
as well as once market will break SBL level then you may also look long position
Remember always trade with SL
Disclaimer: Forex is Risky

Gold trading insights: 28-May-2025Gold trading insights for today: Explore our zones for informed decision-making.

0526 Mastering Divergence in Gold: Daily vs. 4H Chart TacticsHello traders,
Check this Latest COT Report first:
Gold:
Net long positions increased by 7,741 contracts, with a net long increase of 7%. The current total net long positions stand at 118,615, nearing the upper limit of the past year (the maximum being 254,841), with a relative position of 47%. This indicates that long funds are returning to the market, enhancing expectations for continued increases in gold prices; at the same time, short sellers are actively retreating, and those with short-term bearish views are exiting.
From a technical perspective, gold also shows a clear bullish trend. I believe the support level for gold is at 3200, and if it successfully breaks through the important resistance level of 3400, there is a possibility of testing the 3450-3500 range within this week.
On weekly chart, check this first.
Price action all above weekly EMAS
On this 4H chart, GOLD is running the fifth wave on this current swing. It could be rejected from the daily pressure line down to sideways price action above the red buying zone 3260-3277, WHERE BUYER VERY POSSIBLE WAITING THE OPPORTUNITY TO OPEN LONG TRADE ON GOLD AGAIN!
For mid-term buyers, fibo ext 1.27-1.414 zone is very possible.
GOOD LUCK!
LESS IS MORE!

Gold Falls as Expected — Bearish Structure HoldsAfter today’s market open, gold entered the 3346–3358 resistance zone, but failed to maintain upward momentum.
As expected from yesterday’s analysis, the bearish pattern remained intact, and price turned lower.
🔔 Congrats to those who followed the plan — another profitable move locked in!
🔍 Current Market Outlook:
✅ Trend remains bearish, technicals do not currently support a bullish case;
✅ Key support zones:
First support: near 3306
Major zone: 3290–3280
Extended support: around 3260
📌 We’ll continue to focus on short setups as long as the bearish structure holds.
⚠️ Key Reminders:
The market won’t fall in a straight line — watch for temporary rebounds;
During rebounds, pay attention to support/resistance flips;
Be ready to adjust your strategy if the trend shifts!
📍 Important resistance levels:
3346–3338
3324–3318
(This has been highlighted multiple times — don’t ignore it.)
✅ Stick to the plan, adapt to the trend, and manage risk like a pro — that’s the key to consistent profits.

Analysis of gold trend at night and how to arrange it🗞News side:
1. Trump's view on Russia is not optimistic
2. Trump boasted in a post that his threat to impose tariffs on the EU worked
📈Technical aspects:
Gold does not seem to have a strong rebound. After touching 3305, the rebound momentum has weakened and it has been hovering between 3300-3290. Judging from the hourly chart, I think it is still in a state of correction. Then we may see another drop in the evening to accumulate momentum. This is why I chose to manually close the position near 3300 while waiting for the rebound just now. In the evening, bros can pay attention to the support line of 3280-3270 below to look for entry trading opportunities.
If you agree with this view, or have a better idea, please leave a message in the comment area. I look forward to hearing different voices.
FOREXCOM:XAUUSD FXOPEN:XAUUSD TVC:GOLD FX:XAUUSD OANDA:XAUUSD

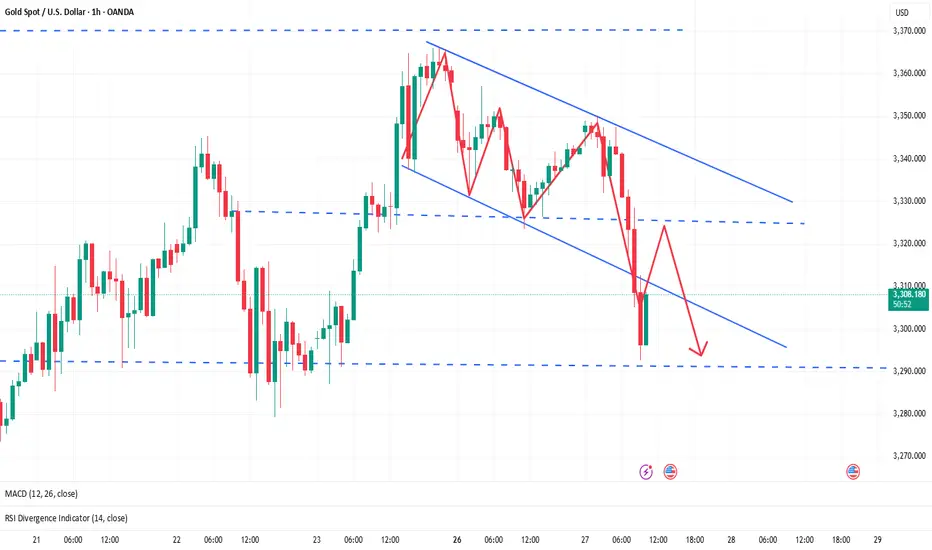
GOLD Will Keep Falling!
HI,Traders !
GOLD is going down
Now and the pair broke
The rising support line
Made and is going
Down again now so we are
Bearish biased and we will
Be expecting a further
Bearish move down !
Comment and subscribe to help us grow !

3300 becomes the dividing line between long and short positions🗞News side:
1. The situation in the Middle East and between Russia and Ukraine has escalated again
2. Pay attention to the opening of US stocks today
📈Technical aspects:
Good morning, bros. Gold is currently testing the important support of 3300. Once it falls below 3300, it can be officially confirmed that the correction trend is coming. Today's opening of the U.S. stock market is critical. If the U.S. stock market opens higher, it is very likely to pull down gold prices. The stable operation suggestion for the day is to go long when it retreats to 3295-3290, and then rely on the upper side of the previous low point for protection, that is, look at the vicinity of 3325-3330. If it encounters resistance and pressure near 3330-3340, you can consider entering a short position and continue to be bearish. At present, the first focus below is the support of 3290-3280. If it continues to fall, it may touch the 3266 line.
If you agree with this view, or have a better idea, please leave a message in the comment area. I look forward to hearing different voices.
OANDA:XAUUSD FX:XAUUSD TVC:GOLD FXOPEN:XAUUSD FOREXCOM:XAUUSD
Gold hits around 3280, please go long in the short term
📌 Driving Events
Gold prices fell more than 0.50% on Monday as demand for safe-haven assets decreased after U.S. President Donald Trump announced a postponement of tariffs on the European Union. Trading activity remained subdued as the U.S. and UK markets were closed for public holidays. As of this writing, the gold/dollar exchange rate was around $3,294. Trump issued a statement on Sunday, postponing the date of the 50% tariff on EU goods to July 9, and market sentiment improved. As a result, gold prices came under pressure and fell after a sharp rise of 4.86% last week (the strongest weekly performance since early April)
📊Commentary Analysis
Focus on the support level of 3285/80. If this area is touched for the first time, go long
💰Strategy Package
🔥Selling area: 3345-3350 SL 3355
TP1: $3333
TP2: $3325
TP3: $3308
🔥Buying area: $3280-$3285 SL $3275
TP1: $3312
TP2: $3330
TP3: $3345
⭐️ Note: Labaron hopes that traders can properly manage their funds
- Choose a lot size that matches your funds
- Profit is 4-7% of the fund account
- Stop loss is 1-3% of the fund account
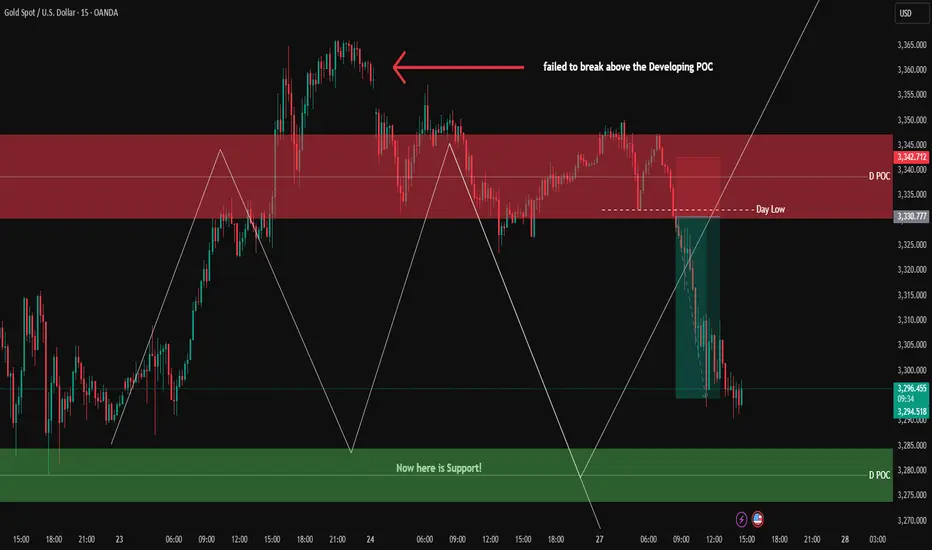
XAUUSD Update – 1H Confirmation/ 15 min Chart/ 3min Sell SetupGold failed to break above the Developing POC resistance and is now pulling back toward the demand zones marked on the chart.
At 3331.8, we entered a short position after the day's low was swept on the 3-minute timeframe, combined with our entry confirmations — resulting in a clean 1:3 R:R ✅
Now we’re waiting for price to reach the demand zones. If we get confirmation on lower timeframes, we’ll be looking to enter a long position.
🔔 The deeper price pulls into the lower demand zones, the better the long setups become, allowing us to consider increasing our risk from 1% to 3%, given a solid setup and momentum.
🔍 Insight by ProfitaminFX
If this outlook aligns with your bias, or if you see it differently, feel free to share your perspective in the comments. Let’s grow together 📈
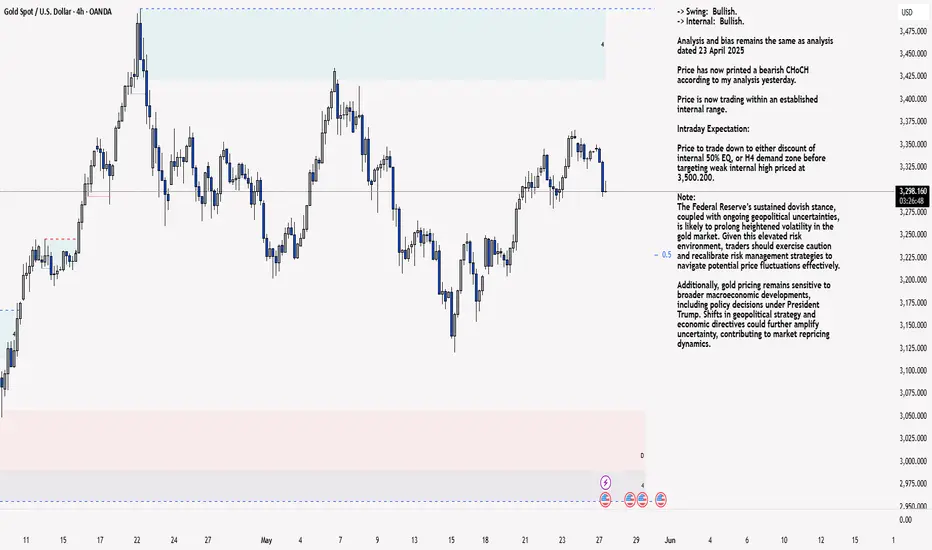
XAU/USD 27 May 2025 Intraday AnalysisH4 Analysis:
-> Swing: Bullish.
-> Internal: Bullish.
Analysis and bias remains the same as analysis dated 23 April 2025
Price has now printed a bearish CHoCH according to my analysis yesterday.
Price is now trading within an established internal range.
Intraday Expectation:
Price to trade down to either discount of internal 50% EQ, or H4 demand zone before targeting weak internal high priced at 3,500.200.
Note:
The Federal Reserve’s sustained dovish stance, coupled with ongoing geopolitical uncertainties, is likely to prolong heightened volatility in the gold market. Given this elevated risk environment, traders should exercise caution and recalibrate risk management strategies to navigate potential price fluctuations effectively.
Additionally, gold pricing remains sensitive to broader macroeconomic developments, including policy decisions under President Trump. Shifts in geopolitical strategy and economic directives could further amplify uncertainty, contributing to market repricing dynamics.
H4 Chart:
M15 Analysis:
-> Swing: Bullish.
-> Internal: Bearish.
Analysis and bias remains the same as analysis dated 22 May 2025.
In my analysis from 12 May 2025, I noted that price had yet to target the weak internal high, including on the H4 timeframe. This aligns with the ongoing corrective bearish pullback across higher timeframes, so a bearish internal Break of Structure (iBOS) was a likely outcome.
As anticipated, price targeted strong internal low, confirming a bearish iBOS.
Price has remained within the internal range for an extended period and has yet to target the weak internal low. A contributing factor could be the bullish nature of the H4 timeframe's internal range, which has reacted from a discounted level at 50% of the internal equilibrium (EQ).
Intraday Expectation:
Technically price to continue bullish, react at either premium of internal 50% EQ or M15 demand zone before targeting weak internal low priced at 3,120.765.
Alternative scenario:
Price can be seen to be reacting at discount of 50% EQ on H4 timeframe, therefore, it is a viable alternative that price could potentially print a bullish iBOS on M15 timeframe.
Note:
Gold remains highly volatile amid the Federal Reserve's continued dovish stance and persistent geopolitical uncertainties. Traders should implement robust risk management strategies and remain vigilant, as price swings may become more pronounced in this elevated volatility environment.
Additionally, President Trump’s recent tariff announcements are expected to further amplify market turbulence, potentially triggering sharp price fluctuations and whipsaws.
M15 Chart:
XAUUSD Analysis todayHello traders, this is a complete multiple timeframe analysis of this pair. We see could find significant trading opportunities as per analysis upon price action confirmation we may take this trade. Smash the like button if you find value in this analysis and drop a comment if you have any questions or let me know which pair to cover in my next analysis.

Switched to Bearish Bias After Failed Breakout 🟡 What happened yesterday?
In my previous analysis, I mentioned that the drop from 3360 could be just a correction — and my strategy was to buy the dips.
That’s exactly what I did, buying from the zone I highlighted in yesterday's analysis.
❗ This morning I updated the situation on “minds”
I said we now have a clearer picture:
A break above 3350 would confirm bullish continuation toward the 3400 zone
But a break below yesterday’s low would shift the outlook to bearish and open the door for 3250
📉 What followed?
I closed my long with a small 80 pip profit. More important than the gain itself is this:
The picture is now clear — bears have taken control.
- The ascending trendline is broken.
- The recent touch of 3360 looks like a lower high in the bigger structure.
🧭 My strategy has now changed:
➡️ I'm shifting to selling the rallies
➡️ My target for this bearish leg: 3250
Let’s see if price confirms the scenario in the next sessions — but for now, the signal is clear. Bearish bias in play.
Disclosure: I am part of Trade Nation's Influencer program and receive a monthly fee for using their TradingView charts in my analyses and educational articles.

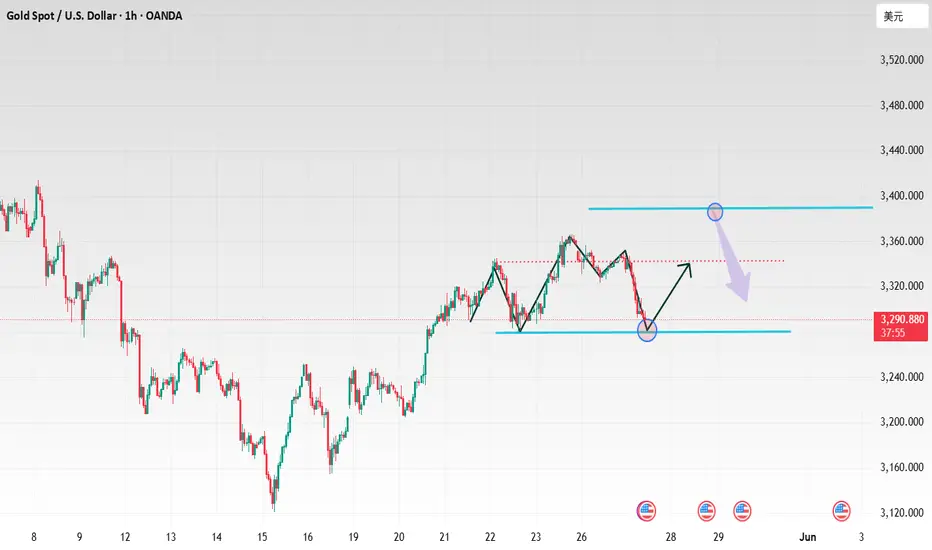
Gold Pulls Back from 3360 – Is This Just a Correction?Last week, Gold closed right into the 3360 resistance zone — a level I’ve highlighted in multiple past analyses.
This week, price has started to pull back.
So far, the move looks like a normal correction, not a reversal.
________________________________________
📊 Trend Intact – But Watch 3320 Closely
As shown in the chart, the uptrend from the 3120 zone remains intact, and Gold is still trading above the psychological 3300 level.
That means the bullish structure holds, and the strategy remains:
🟩 Buy the dips.
________________________________________
⚠️ BUT — Key Support Must Hold
The 3300–3320 area is crucial.
Why?
• A break below would mean a trendline break
• It could mark a lower high (compared to 3430 and the ATH at 3500)
• It would shift momentum in favor of the bears
________________________________________
📉 Trading Plan:
As long as 3360 is not clearly broken, I’ll keep buying dips, but with reduced position size and tight risk controls.
The market still needs to prove the bulls are in full control.
Disclosure: I am part of Trade Nation's Influencer program and receive a monthly fee for using their TradingView charts in my analyses and educational articles.

Gold trading zones: 27-May-2025Today's Gold trading zones: Identify potential opportunities and plan your strategy.

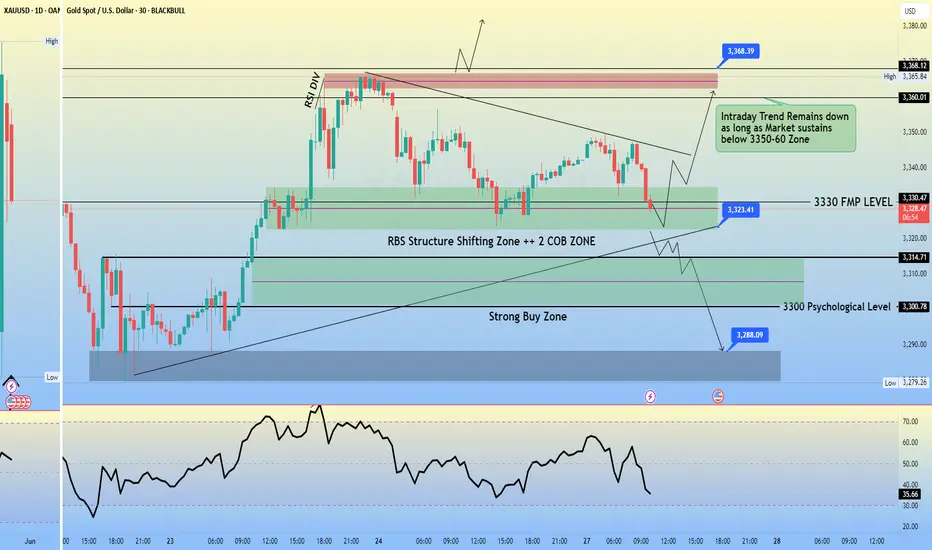
GOLD M30 Intraday Chart Update for 27 May 2025As you can see that there some zones mentioned in chart
right now market is in short selling trend as long market sustain below 3350-60 once market clearly break 3350 psychological level then it will move towards 3380 or even 3400
you may do some scalping between 3320-3350 but remember trade always with SL
And if market goes below 3320 level then wait sustain below 3320 then enter with proper SL for sell direction
Disclaimer: Forex is Risky !
5/27 Gold Analysis and Trading SignalsGood afternoon everyone!
Yesterday, gold fluctuated within the flexible trading zone, and we only executed a long entry near 3323, which brought decent profit.
Today, gold opened with an upward move toward 3350, but quickly pulled back. The recent market shows a sideways consolidation, with the $3340 level acting as a key pivot zone:
Below 3340: dense support areas
Above 3340: resistance clusters
In this context, any breakout without strong momentum can easily lead to capital flow shifts, causing false breakouts or rapid pullbacks, making trend continuation more difficult.
📉 Technical View:
On the 30M chart, bearish momentum slightly outweighs bullish, and gold is likely to remain range-bound within the zone defined yesterday.
🗞 Fundamental Reminder:
There are a few important U.S. economic releases during the NY session. Watch closely to see if they provide a clear directional push.
📈 Today’s Trading Plan:
📉 Sell in the 3366–3386 zone (resistance area)
📈 Buy in the 3278–3256 zone (support zone)
🔁 Flexible intraday levels to monitor:
3353 / 3341 / 3334 / 3317 / 3309 / 3296 / 3284
Trade with flexibility, beware of fake breakouts, and focus on NY session data-driven opportunities. Let me know if you have questions — good luck and happy trading!
