Gold Pullback as Expected, Range Trading ContinuesAs I clearly stated last Friday, key resistances are located at 3366 and the stronger zone between 3376–3391. On Friday, the price peaked near 3366 without touching the second resistance band, followed by a pullback — a natural result of recent buying pressure being released and previous trapped positions being closed out.
🎯 Congratulations to those who carefully followed and executed the strategy — you should have captured solid profits from this retracement!
🔍 Current Technical Outlook:
✅ A wave of selling has already been absorbed. Now we watch:
Support strength — if key levels hold, scalping on dips remains valid;
Rebound momentum — short-term indicators favor a bounce, though medium-term structures are still being repaired;
Focus zone: 3355–3357 is a newly created gap resistance, critical for today’s action;
Previously broken supports (3346–3338 and 3324–3318) now serve as resistance and should be watched during any upside attempt.
📈 Trading Strategy:
Today’s price range is relatively contained — stick to selling near resistance, buying near support. If there are any major changes or new developments, I’ll update everyone in time.
Xauusdupdates

5/26 Gold Trading SignalsGood afternoon everyone!
I just returned from a weekend trip and apologize for the late update today — thank you all for your patience and continued support!
Gold has shown mild downward movement in a one-sided consolidation pattern today. This is a technical pullback after reaching a key resistance zone, reflecting selling pressure at higher levels. Today is Memorial Day in the U.S., which explains the low volatility and reduced trading volume.
🔎 Technical Outlook:
Once gold reached around 3360, it entered a significant resistance zone. If bulls intend to maintain the current uptrend, then the support around 3272 will be a critical level during this pullback. Before that, we should also keep an eye on 3322, 3318, and 3298.
On the 2-hour chart, a bearish divergence has formed, which needs to be resolved, possibly through sideways consolidation or a further pullback.
🗞 Fundamental Outlook:
The news is relatively quiet today, but important economic data and speeches will begin tomorrow, which may trigger larger market moves.
📈 Today’s Trading Plan:
📉 Sell in the 3352–3368 zone (resistance area)
📈 Buy in the 3292–3272 zone (support zone)
🔁 Flexible intraday levels to watch:
3348 / 3332 / 3323 / 3312 / 3305 / 3296
Stay flexible and manage risk accordingly. If you have any questions or want to discuss your trading strategy, feel free to reach out. Wishing everyone a smooth and profitable session!

Here is the trend of gold prices in the next three weeks!The hourly level trend indicates that the current support position is 3310-3320. And it is the retracement position after the downward trend is broken. It is also a small retracement point after the rebound.
At present, the news trend is basically mixed, offsetting each other. However, in the following period, the growth of risk aversion will boost the rise of XAUUSD, and geopolitics is also an important influencing factor.
Short-term buying opportunities are considered at 3325-3300. The short-term target focuses on the pressure of 3375-3400.
Remember the core of swing trading. Follow the wave of trading. Do not trade independently to avoid losses. If you are not sure about the trading opportunity. Remember to leave me a message in the swing trading center.
Gold Eyes Breakout or Breakdown: All Eyes on PCE and FOMCTVC:GOLD OANDA:XAUUSD Gold (XAU/USD) surged above $3,350 last week, boosted by safe-haven flows following Moody’s downgrade of the U.S. credit rating and rising geopolitical tensions. Concerns over U.S. debt sustainability, weak dollar sentiment, and renewed trade risks kept investor demand for gold elevated.
Technically, gold is currently trading within an ascending channel. Price is now hovering near a key resistance zone around $3,364, while the $3,324 breakout level below may act as pivotal support. A pullback below this level could expose downside risk toward the lower channel boundary. Meanwhile, a sustained break above resistance may invite further bullish momentum toward $3,400.
This week, attention turns to key U.S. data including FOMC minutes, Q1 GDP, and the Fed’s preferred inflation gauge — core PCE. Any upside surprise in inflation may weigh on gold, while geopolitical headlines and fiscal uncertainty are likely to continue supporting the upside.
Resistance : $3,364 , $3,400
Support : $3,324 , $3,315

Rebound after hitting bottomToday, gold opened at a low of 3331 and rebounded, and reached a high of 3356 and then stepped back to adjust. The overall trend is the same as our weekend analysis. Last week, the overall technical side of gold continued to fluctuate upward with bullish momentum. The daily level repeatedly tested and stabilized at the 3200 mark at the beginning of the week, ushering in a bullish upward momentum. On Friday, it continued to fluctuate upward with bullish momentum relying on the 3280 mark throughout the day, forming a reverse medium-sized positive. The daily K-line closed with a shock upward breakout of the medium-sized positive. The overall gold price continued to fluctuate upward with bullish momentum in the short term, and it is still bullish.
From the 4-hour market analysis, pay attention to the 3378-80 line of suppression on the top, pay attention to the 3320-25 line of short-term support on the bottom, and focus on the 3300-3306 line of support. Rely on this range to maintain the main tone of low-multiple participation temporarily. In the middle position, watch more and do less, be cautious in chasing orders, and wait patiently for key points to enter the market.
Gold operation strategy:
1. Go long on gold when it falls back to 3320-3325, stop loss 3307, target 3366-3370, break to see 3378-85

Gold Buy Chart setup Xauusd Parallel Channel in 15M
Each candlestick represents 15 minutes of price action.
Instrument: Gold Spot vs US Dollar (XAUUSD).
2. Price Channel:
The price is moving within a descending channel (highlighted in blue), which indicates a short-term downtrend.
The upper boundary (resistance) and lower boundary (support) define the range.
3. Current Price:
As of the latest data, the price is around $3,333

Gold bulls advance as expected Mainly go long on pullback.Today, gold opened lower and fell, reaching the lowest level of 3331. Then the bulls exerted their strength, reaching the highest level of 3356 and then adjusted back. The overall trend was highly consistent with the expected judgment. Looking back at the market last week, the technical side of gold continued the bullish pattern, and the oscillating upward trend was significant. From the daily level, the price repeatedly tested around the 3200 mark at the beginning of the week, and finally stabilized successfully, laying a solid foundation for the bull market. On Friday, it was supported by the 3280 mark, continuing the strong oscillating upward trend, forming a reverse middle Yang pattern, and the daily K line closed with an oscillating upward break of the middle Yang, fully demonstrating the short-term bullish pattern of gold prices, and bullish expectations continued to heat up.
Based on the current gold trend analysis, the focus below is on the 3330-3320 range support, and the focus above is on the 3380-3400 resistance. In terms of overall strategy, the bullish thinking is maintained before breaking 3320 to avoid blindly guessing the top.

XAUUSD While the GBPJPY trade is still active, I’ve also spotted a new opportunity on XAUUSD and have entered a sell position. I'm sharing the trade here for traders who may want to take it as well.
🔍 Trade Details:
✔️ Timeframe: 15-Minute
✔️ Risk-to-Reward Ratio: 1:1 / 1:1.50
✔️ Trade Direction: Sell
✔️ Entry Price: 3329.64
✔️ Take Profit: 3324.68
✔️ Stop Loss: 3334.59
🔔 Disclaimer: This is not financial advice. I’m simply sharing a trade I’ve taken based on my personal trading system, strictly for educational and illustrative purposes.
📌 Interested in a systematic, data-driven trading approach?
💡 Follow the page and turn on notifications to stay updated on future trade setups and advanced market insights.

gold on buy#XAUUSD base on price movement both past and current, we wait to see if price will break below 3330 to sell short.
Below 3330 have short sell till 3324. Buy limit 3324, target 3370, SL 3312
Above the 3344 if current h1 closes there will continue bullish move till same target.

How to plan for gold price box fluctuations🗞News side:
1. The situation between Russia and Ukraine escalated again
2. Israel in the Gaza Strip was once again criticized by the international community
📈Technical aspects:
After gold opened lower today, it fell into a small box-shaped shock in the short term. It seems that the situation in Russia and Ukraine and the Middle East over the weekend did not have further impact on the gold price. The gold daily level closed with a positive line again, injecting new vitality into the trading space last week. These two rounds of rise not only successfully crossed the resistance level of 3250 last Monday, but also further broke through the suppression of 3320, showing a clear upward trend. The current volatility is more like a correction after breaking through the previous high! Last Friday, the price failed to break through the 3370 line several times and encountered resistance continuously, which shows that the pressure from above is still relatively strong! Due to the particularity of today's market trading, the technical side of the hourly chart shows a downward trend. The European session temporarily focuses on the 3350-3355 line resistance, and the 3330-3320 support is seen below.
If you agree with this view, or have a better idea, please leave a message in the comment area. I look forward to hearing different voices.
FOREXCOM:XAUUSD FXOPEN:XAUUSD TVC:GOLD FX:XAUUSD OANDA:XAUUSD

GOLD M15 Intraday Chart For 26 May 2025GOLD M15 Intraday Chart just posted as you can see that there are important zone
right now market is in range so you can do couple of scalping trades in Support & Resistance range
furthermore there are 2 breakout scenarios mentioned, kindly check carefully then trade
Remember Trade always with SL

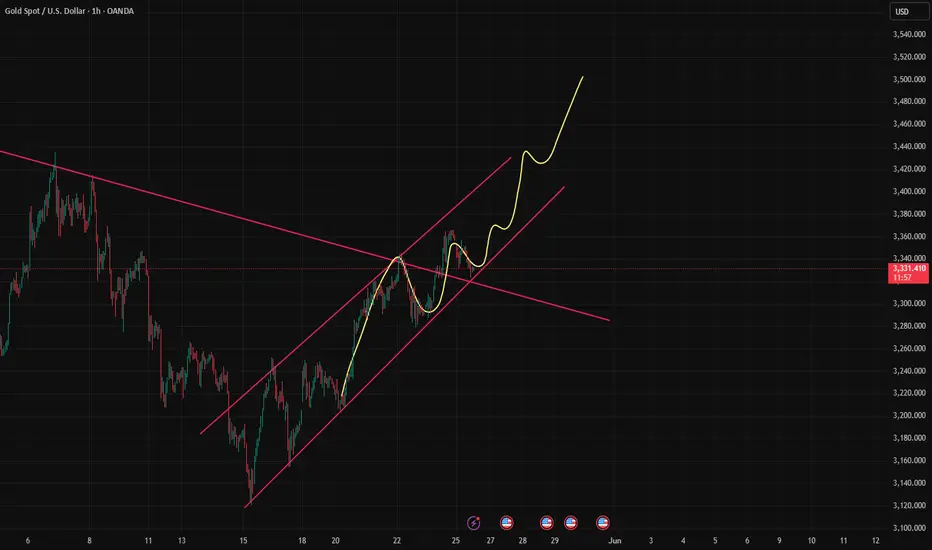
Critical Resistance Ahead–Will Gold Confirm the Bullish Reversal🔶 What happened last week on Gold (XAUUSD)?
Last week was an excellent one for Gold bulls – the price surged by nearly 1500 pips, fully recovering the drop from the 12–16 May week.
Looking at the chart, the decline from the last ATH at 3500 appears clearly corrective, forming a classic ABC 3-wave pattern which now seems complete.
Gold is currently testing a major confluence resistance zone, aligned with:
• The 17 April ATH
• The end-of-April resistance
• And the early May support
Also worth noting: this week’s breakout above resistance followed the formation of an ascending triangle, which is typically bullish.
________________________________________
❓ Key question – Will the bullish move continue, or will price reject from here?
________________________________________
🔍 Why a bullish continuation is probable:
1. The ABC corrective structure seems to have ended.
2. Price broke out after an ascending triangle – a bullish signal.
3. The broader structure still leans bullish after the ATH at 3500.
________________________________________
⚠️ But this resistance zone is critical:
• Without a clear breakout above 3360 zone, bulls don’t have full control.
• A drop below 3300 would shift momentum back to the bears, with 3360 becoming a potential lower high.
________________________________________
🧭 My Trading Plan:
✅ I favor a bullish scenario, aiming for:
• 3430
• 3500 (ATH retest)
❌ This outlook gets invalidated if price falls below 3300 – in that case, I’ll reassess for more downside.
________________________________________
🚀 The market must confirm the direction. We’re just here to read the map.
Disclosure: I am part of Trade Nation's Influencer program and receive a monthly fee for using their TradingView charts in my analyses and educational articles.

Bearish Setup for Gold (XAU/USD)
Current Price: ~3,334 USD
• Expected Move: Short-term rise to 3,380–3,390, then a strong drop.
Reasoning:
• Completing an Elliott Wave triangle (E wave) at resistance.
• Harmonic pattern (Gartley/Bat) aligns with this reversal zone.
• Resistance lies within a descending channel.
• Bearish Target: ~3,050–3,030
• Trade Setup: Consider shorting near 3,380–3,390 with stops above 3,400.
TVC:GOLD

Gold is in the bullish direction after correcting the supportHello Traders
In This Chart GOLD HOURLY Forex Forecast By FOREX PLANET
today Gold analysis 👆
🟢This Chart includes_ (GOLD market update)
🟢What is The Next Opportunity on GOLD Market
🟢how to Enter to the Valid Entry With Assurance Profit
This CHART is For Trader's that Want to Improve Their Technical Analysis Skills and Their Trading By Understanding How To Analyze The Market Using Multiple Timeframes and Understanding The Bigger Picture on the Charts
GOLDHello friends
Given the sharp upward movement we had, the price is now forming a flag pattern, and if this pattern is completed, we can wait for a new high.
*Trade safely with us*

XAU/USD 26-30 May 2025 Weekly AnalysisWeekly Analysis:
Swing Structure -> Bullish.
Internal Structure -> Bullish.
Analysis and bias remains the same as analysis dated 16 March 2025.
In my analysis dated 27 October 2024 I mentioned (below) that price could potentially print higher-highs in order to reposition CHoCH. This is exactly how price printed. CHoCH positioning has been brought significantly closer to current price action. CHoCH positioning is denoted with a shortened blue dotted horizontal line.
The remainder of my analysis and bias remains the same as analysis dated 09 February 2025.
Price has printed a further bullish iBOS.
Price is currently trading within an internal low and fractal high. CHoCH positioning is denoted with a blue dashed line.
Price Action Analysis:
In my analysis dated 27 October 2024, it was noted that the first sign of a pullback would be a bearish Change of Character (CHoCH), indicated by a blue dotted line. Price's consistent upward momentum had repositioned previous CHoCH much closer to recent price levels as expected for weeks. Current CHoCH positioning is quite a distance away from price, therefore, it would be viable if price continued bullish to reposition ChOCH.
Note:
It is highly unlikely price will "crash" as many analysts are predicting. My view is this is merely a corrective wave of the primary trend.
Given the Federal Reserve's dovish policy stance alongside heightened geopolitical risks, market volatility is likely to remain elevated, influencing intraday price swings.
Price could also be driven by President Trump's policies, geopolitical moves and economic decisions which are sparking uncertainty and potential repricing of Gold.
Weekly Chart:
Daily Analysis:
Swing -> Bullish.
Internal -> Bullish.
Analysis and Bias remains the same as Analysis dated 11 May 2025.
Since my last weekly analysis price has finally printed a bearish CHoCH.
This is the first indication, but not confirmation of bearish pullback phase initiation.
Price is now trading within an established internal range.
Price should now technically trade down to either discount of 50% internal EQ, or Daily demand zone before targeting weak internal high, priced at 3,500.200.
Note:
The Federal Reserve’s continued dovish stance, coupled with escalating geopolitical uncertainties, is expected to sustain elevated market volatility, influencing both intraday and broader trend developments.
Additionally, price action may be further shaped by U.S. policy decisions, including measures enacted under President Trump. Shifts in geopolitical strategy and economic policymaking could introduce further uncertainty, contributing to the ongoing repricing dynamics within the gold market.
Daily Chart:
H4 Analysis:
-> Swing: Bullish.
-> Internal: Bullish.
Analysis and bias remains the same as analysis dated 23 April 2025
Price has now printed a bearish CHoCH according to my analysis yesterday.
Price is now trading within an established internal range.
Intraday Expectation:
Price to trade down to either discount of internal 50% EQ, or H4 demand zone before targeting weak internal high priced at 3,500.200.
Note:
The Federal Reserve’s sustained dovish stance, coupled with ongoing geopolitical uncertainties, is likely to prolong heightened volatility in the gold market. Given this elevated risk environment, traders should exercise caution and recalibrate risk management strategies to navigate potential price fluctuations effectively.
Additionally, gold pricing remains sensitive to broader macroeconomic developments, including policy decisions under President Trump. Shifts in geopolitical strategy and economic directives could further amplify uncertainty, contributing to market repricing dynamics.
H4 Chart:

#XAUUSD: +2000 Pips Correction US-China Trade Deal ConfirmedGold has experienced a significant decline in recent days, primarily due to fundamental market factors that have caused its price to fall from 3430 to 3209, resulting in a loss of approximately 2210 pips. Consequently, we recommend that you consider selling Gold if it aligns with your analysis and assessment. It is imperative that you implement strict risk management measures while trading Gold.
It is important to note that this analysis does not guarantee a price decline or that the market will behave as described. Therefore, we strongly advise you to conduct thorough trade planning before making any trading decisions.
We extend our sincere gratitude for your unwavering support over the years.
Our primary objective is to assist you in making well-informed decisions. Therefore, we encourage you to contact us if you have any inquiries or require further information.
Additionally, we would be delighted to receive your insights on which cryptocurrency pair you would like to explore next. Please do not hesitate to share your preferences.
Best regards,
Team Setupsfx_

XAUUSD[GOLD]: Another Possible Swing Sell Happening! Swing MoveGold rejected twice as we had described in our last two analyses on Gold. We remain heavily bearish on Gold and expect a swift bearish move within the next week or following week. We are eyeing two targets. Please use this analysis accordingly and avoid overtrading. This is not a confirmation, and do not use the marked arrow as an entry or exit point. The marked red area drawn there represents a potential reversal zone from which price may reverse.
As always, this analysis does not guarantee that price will move as described in the chart. Please use your own knowledge and trading plan while trading Gold. Good luck and trade safely.
Want to support us? Do the following ❤️
-LIKE THE IDEA
-COMMENT YOUR VIEW
-SHARE IF YOU AGREE
Much love ❤️
Team Setupsfx_

XAUUSD[GOLD]: 1 Hour View Show Extreme Seller Volume Gold in a shorter time frame shows extreme bearish volume kicking in the market, where bulls are failing to push prices higher. Additionally, if you’re someone who analyses patterns, a HEAD AND SHOULDERS pattern has also formed. There are three targets you can aim for.
We extend our best wishes and good luck in your trading endeavours. Your unwavering support is greatly appreciated.
If you’d like to contribute, here are a few ways you can assist us:
- Like our ideas
- Comment on our ideas
- Share our ideas
Team Setupsfx_🚀❤️

Opening price trend analysis and trading operationsGold technically, gold rose sharply on Friday, closing with a real big positive line on the daily line. The pressure from the 3500 high point still plays a partial role in the short term. The market may still need to focus on the upper limit pressure test of the channel in the future, and beware of the market rising again after experiencing a medium-term adjustment. At the 1-4 hour level, the short-term trend quickly reversed from the low point of 3120 and once challenged the high of 3365 US dollars before correcting. It has repeatedly tested the support of 3320 below but still failed to break, stimulating the market bulls to enter the market again. Finally, gold closed sideways at a high level, and the pressure test of 3370 and 3400 areas continued to be paid attention to above. In terms of operation, in the short term, pay attention to the two supports of 3335 and 3320 below to try to go long, and pay attention to the resistance of 3370-3400 area to go short. There are many uncertainties in the market over the weekend, which will directly lead to a gap or a high opening next week. Therefore, you can follow my real-time sharing for specific operation points!

XAUUSD[GOLD]: Bearish Correction Is Happening! Gold rejected at 3350, dropping almost 600 pips to 3290. We can expect the price to drop further to around 3250, potentially reversing from there. A possible entry point is 3304, followed by a drop from there.
If you’d like to contribute, here are a few ways you can assist us:
- Like our ideas
- Comment on our ideas
- Share our ideas
Team Setupsfx_🚀❤️

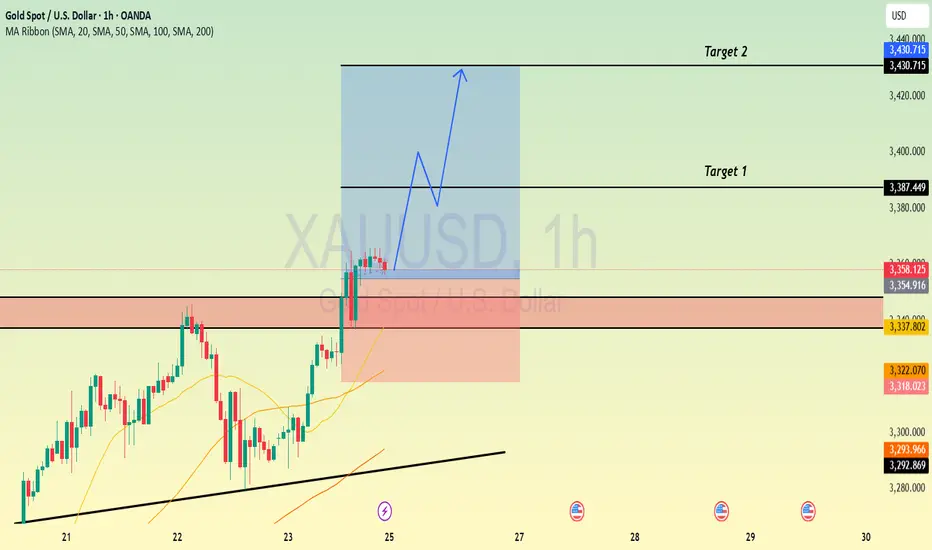
GOLD outlook for the weekIn today’s analysis, I’m expecting price to continue its bullish momentum, partially influenced by recent political developments surrounding Donald Trump. This aligns well with the broader higher time frame trend, where we’ve been favouring long setups.
To capitalise, the most immediate and valid point of interest I’ve marked out is the 9H demand zone — the origin of the most recent break of structure. If price retraces, this is where I’ll be watching for bullish confirmation.
However, if price continues to climb without retracing first, we could see a temporary bearish reaction from the nearby 4H supply zone around the 3,400 level. If this happens, I may look for a short-term countertrend sell setup, but only with strong confirmation. Risk will be kept low and I won’t be overly ambitious with targets.
Confluences for GOLD Buys:
Strong bullish momentum following a clear CHoCH on the higher time frame
Recent break of structure left behind a clean 9H demand zone for potential retracement
Trend remains bullish on both the lower and higher time frames
Liquidity resting above still yet to be swept
DXY is currently bearish, supporting a bullish case for gold
P.S. While we could see a minor sell opportunity down to the demand zone, patience is key.
Waiting for a solid pre-trend setup is part of the process — no need to rush entries.
Have a great trading week and stay sharp!

Gold (XAU/USD) Bullish Trade Setup – Breakout in ProgressTrend Overview
📈 Uptrend in Progress
Price is moving within an ascending channel:
🔵 Support Line (bottom of channel)
🔺 Resistance Line (top of channel)
Key Levels
Current Price:
● 3,337.53 (📍)
Trade Idea (Long Setup):
🔵 Entry Zone
● 3,306.85 – 3,302.98
(Wait for pullback into this area)
🟦 RBS + RBR ZONE – Previous resistance, now potential support
🔴 Stop Loss
● 3,265.51
💣 Protect your capital below support zone
🎯 Target
● 3,490
🚀 Bullish target based on breakout from channel and momentum
📉 EMA 70:
● 3,282.74 (📉 Red Line)
Helps confirm trend direction. Price above EMA = Bullish bias.
Outlook Summary
✅ Wait for a dip to entry zone
✅ Stop below recent support zone
✅ Target high at 3,490 if breakout continues
