The focus of gold today is 3200!News:
The US economic data in April was weak across the board, with the producer price index (PPI) unexpectedly falling by 0.5%, retail sales growth plummeting to 0.1%, and manufacturing output falling by 0.4%, which severely hit the market's confidence in the US economy. Affected by this, the US bond market fluctuated violently, with the 10-year US bond yield plummeting by 11 basis points and the 2-year yield plummeting by 9.2 basis points; the US dollar index fell by 0.2%, and the real interest rate fell. At the same time, geopolitical risks continue to heat up. The Russia-Ukraine peace talks have reached a deadlock, Putin refused to meet with Zelensky, and the Iran nuclear agreement negotiations have not progressed smoothly. Against this background, the safe-haven attribute of gold has been highlighted, and market attention has increased significantly. Looking ahead to this trading day, a number of important US economic data will be released soon, and the progress of the Russia-Ukraine talks and Trump's dynamics are also attracting much attention. These factors will continue to affect market trends.
Technical aspect: From the perspective of the daily line, gold can no longer be regarded as a unilateral decline after yesterday's bottoming out and rebounding. It should be directly followed by the idea of oscillation! The primary focus today is still the position of the dividing line of 3200.
Trading idea: Go long if it doesn’t break around 3200, sl3190, target 3230
Xauusdupdates

XAUUSD remains bearish unless it breaks 3265🗞News side:
1. India considers using new Indus River project to cut water supply to Pakistan.
2. Pay attention to the news of Russia-Ukraine ceasefire negotiations today
📈Technical aspects:
Today's opening correction is due to technical repair and adjustment, which is why I shorted. The support of 3200-3210 is of great significance to the short-term trend. If it can be supported here again, it may further promote the upward expansion space. However, after the rebound in the morning Asian session, it did not break through the 3265 line. On the contrary, the bulls began to weaken. Today is Friday, and the market is not expected to show a unilateral strong attitude. It will be treated as a shock during the day. Before breaking through 3265 above, we can short at a small level during the intraday rebound. Short-term operation suggestions, temporarily look at 3235-3240 on the upper side, and look at the support of 3210-3200 on the lower side.
If you agree with this view, or have a better idea, please leave a message in the comment area. I look forward to hearing different voices.
FOREXCOM:XAUUSD FXOPEN:XAUUSD TVC:GOLD FX:XAUUSD OANDA:XAUUSD

Gold has a strong deep V, 3200 support is good for longThe 1-hour moving average of gold begins to turn and continue, so the momentum of gold bears begins to weaken, and gold bulls may begin to exert their strength. However, gold started to rise all the way from 3120 to 3252 yesterday. Gold rose by about 130 points, so the volatility began to increase. Therefore, we must wait patiently for gold to adjust. Because of such a large fluctuation, an adjustment will also be tens of dollars. We must wait patiently for the adjustment and stabilize before going long. After gold breaks through 3192, it is considered a strong deep V breakthrough of important resistance. Then 3192 of gold has now become an important support level. If it falls back to 3192 in the Asian session, go long on dips. If gold falls back to near the 3200 mark, you can try to go long.
Since gold has started to reverse strongly, gold bulls have begun to show their muscles. In the short term, we should not be stubbornly bearish anymore. We should be flexible and adapt to the market. The market is like this, changing rapidly. We should adapt to the market and not be too obsessed with bears or bulls. Obsession is a trap. Gold bulls are strong now, so gold is now the home of bulls. Go long when the Asian session falls back.

Gold operation strategy analysisAt present, the long and short views in the gold market are significantly different, and the effectiveness of technical positions has been verified. The 3180 point has not shown an effective support role in the recent downward process. Its logic as a potential pressure point lacks price behavior verification, and we need to be vigilant against the risk of misjudgment caused by subjective preset technical positions. As for the short strategy at 3200 points, if 3230 is used as the stop loss, the risk exposure of more than 30 US dollars is disproportionate to the current volatility range, and the profit and loss ratio needs to be strictly evaluated in actual transactions. In the current market environment, the price has not yet shown a clear bottom signal. The operational level should focus on optimizing the risk-return ratio and avoid excessive gambling on short-term fluctuations during the trend continuation stage. It is recommended to wait patiently for clearer technical signals or fundamental drivers to intervene.
Gold continued its decline last week, refreshing a new low in a month, but the gold price bottomed out and rebounded during the day, indicating that there is strong bargain hunting below. Gold's support below, from the 30-minute analysis, the upper short-term resistance is around 3180-3185, with a focus on the 3200-3210 line. The pullback will rely on this position to continue the main short trend and look down. The short-term long and short strength watershed is 3235-3240. Before the daily level breaks through and stands on this position, any pullback is a short-selling opportunity.
Operation strategy:
1. It is recommended to short gold when it rebounds to 3180-3185, with a stop loss at 3193, and the target is 3170-3160, and the break is 3160-3130

5/16 Gold Trading Signals
🌇Good afternoon, everyone!
Gold made a strong one-way rally from 3120 to above 3200 yesterday, perfectly achieving our bullish target with substantial profits.
Today, after a slight uptick at the open, gold started to pull back and enter a consolidation phase. Technically, this is a normal correction after a $120 surge. However, the key question now is:
🔍 Is this just a healthy pullback, or a bearish continuation pattern?
There’s some uncertainty in the current structure:
On the larger scale, the market still appears to be forming a double top.
On the shorter-term, this week’s pattern resembles a head and shoulders bottom, and price is now testing the neckline zone.
🧭 So, while the direction remains unclear, we can still identify key trading zones to act on.
🗞 News Watch:
Several important U.S. data releases are scheduled during the New York session. They may provide crucial directional signals for gold.
📌 Today’s Gold Trading Strategy:
🟢 Buy Zone: 3176 – 3148
🔴 Sell Zone: 3265 – 3287
🔄 Flexible Trading Zones (watch for reversals or breakout plays):
▫️3187-3198-3209-3237-3258-3267
✅ Reminder: With the structure being complex and direction unclear, avoid aggressive positioning. Focus on scalp or short-term trades near key zones and react to market post-data.

Latest trading opportunities for XAUUSD.The market went to the target position smoothly as expected.
Due to the sharp decline this week, there was a huge rebound in technical demand on Thursday. The highest broke through 3175/3200/3250. There were some pullbacks in the Asian market. So what positions should we pay attention to now? How to trade?
From the news side. The results of today's meeting between Russia and Ukraine are very important. The delay of one day in yesterday's negotiations has increased geopolitical uncertainty again. This is the biggest black swan event and the factor affecting the rise of XAUUSD. Before the results are announced today. There are still uncertain factors, which are the support for the decline of XAUUSD. However. If the results of the meeting are announced on the news side, then XUAUSD will have a corresponding response in the market. Then we can naturally choose the direction of trading.
Two results. Stop or extend the truce, then XAUUSD will fall further. If no agreement is successfully reached, then it is an opportunity to buy. So the impact of today's news results is very large. It needs to be paid attention to.
The basic data needs to pay attention to the support of 3200. Maintain the principle of long.

Gold price rises and then sells off?Information summary:
Yesterday morning, gold prices soared due to the impact of international news, hitting an intraday high of $3,253.
On Friday, Asian time, gold suddenly fell rapidly in the short term, and the price of gold currently fell to around $3,215/ounce, a sharp drop of nearly $28 in the day.
Gold price targets higher, but the bullish potential is limited in the short term. The focus will be on the preliminary value of the University of Michigan Consumer Confidence Index in May.
Technical analysis:
Looking at the daily chart, gold prices rose on Thursday, but both the high and low points of the day moved down from the previous trading day. On the other hand, the 20-day moving average eased down to around $3,305/ounce, while the 100-day and 200-day moving averages maintained an upward tilt at a level far below the current gold price. Finally, the trend of technical indicators is upward, but it is still below the previous intraday high and in the negative range, which shows that buyer sentiment is not very high.
The short-term trend shows that gold buyers still lack full confidence.
You need to pay attention to the important support and resistance levels:
Support level: $3,200; $3,175; $3,160.
Resistance level: $3,230; $3,245.
Operation strategy:
Buy around $3,200, stop loss at $3,190, and profit range at $3,250-3,280.

Can a V-shaped reversal continue the bull market?🗞News side:
1. Hamas official: If a permanent ceasefire is achieved, control of the Gaza Strip can be handed over
2. Fed Chairman Powell: The Fed is adjusting its overall policy-making framework. Zero interest rates are no longer a basic situation. The wording of underemployment and average inflation rate needs to be reconsidered. PCE is expected to fall to 2.2% in April.
3. Russia and Ukraine reached a ceasefire at the technical level
📈Technical aspects:
Yesterday, the gold price staged a V-shaped reversal and once rose to close near 3244. Although the technical indicators in the hourly chart show a favorable situation, there has been no correction in the current round of gold price increase, and the rise is slow. In addition, the RSI has entered the overbought area, so we need to be alert to the possibility of gold price correction today. Focus on the 3250-3260 resistance on the top and the 3210-3200 support on the bottom.
SELL 3245-3250 TP 3210-3200
If you agree with this view, or have a better idea, please leave a message in the comment area. I look forward to hearing different voices.
OANDA:XAUUSD FX:XAUUSD TVC:GOLD FXOPEN:XAUUSD FOREXCOM:XAUUSD

Gold is likely to trend upward Gold has made a perfect V - shaped reversal today. It opened at 3,177 and declined unilaterally in the Asian session, once dropping to around 3,120, reaching a new low since April 10. Then it gradually climbed all the way, and has now completely recovered the decline, with a rising trend.👉👉👉
On Friday, we continue to anticipate a bullish daily close for gold. However, if the pullback falls below 3,200, the daily cycle may narrow again, leading to a sustained rebound to 3,235 and 3,260. Therefore, the key point is to monitor whether the price holds above or breaks below 3,200.
For short-term trading of gold, the recommended strategy is to focus on going long during pullbacks and supplement with shorting during rebounds.
Short-term key resistance to watch above: 3250-3260 level
Short-term key support to focus on below: 3190-3200 level
XAUUSD trading strategy
buy @ 3210-3215
sl 3195
tp 3230-3240
If you think the analysis helpful, you can give a thumbs-up to show your support. If you have different opinions, you can leave your thoughts in the comments. Thank you for reading!👉👉👉

Will gold continue to rise after breaking down?Technical analysis of gold: the daily cycle is constructed based on the M-head pattern. 3202 is the bullish defense position. If it cannot go up at the close, there will be further declines. A major technical breakdown has occurred. Pay attention to the change in thinking. If the adjustment is large, it may even reach 2900/3000. It rises quickly and falls just as quickly, but the long-term logic of gold's rise remains unchanged. It is also an opportunity to deploy more when it goes down, but the position needs to be observed by the market. It is difficult to predict at present. In the short term, rely on 3198 to do short selling. After breaking 3200, pay attention to shorting even if it rebounds. If it rebounds upward, go short at the golden section resistance of 3265.
After gold fell below 3202 in the US market, it rebounded to 3198 at its highest. This rebound was just an oversold rebound, and then continued to fall back. Although it has not refreshed the low point for the time being, the pattern has weakened and it is difficult to rise again. Weak shorts can hardly get past 3198. The short-term support below is 3140/3150. Gold 1 hour still continues to cross downward short positions, and the short-term strength is still there. The rebound still continues to give shorts opportunities. There is no obvious sustained upward momentum in the short term, so such a market is just a rebound. Gold rebounds in the US market and continues to be short.
Overall, today's short-term operation strategy for gold is to short on rebounds and to go long on pullbacks. The short-term focus on the upper side is 3202-3205 resistance, and the short-term focus on the lower side is 3150-3155 support.
Short position strategy:
Strategy 1: Short 20% of the position in batches near 3198-3202 in the early trading of gold, stop loss 10 points, target near 3180-3170, and look at 3150 if it breaks;
Long position strategy:
Strategy 2: Buy 20% of the position in batches near 3150-3155 when gold falls back, stop loss 10 points, target near 3170-3190, and look at 3200 if it breaks;

Gold changes trend? Latest analysis.Information summary:
Due to the easing of trade tensions between the world's two largest economies; suppressing safe-haven demand, and investors waiting for US economic data for more clues on future interest rate trends. On Thursday, Asian time, gold prices fell to their lowest point in more than a month. At one point in the session, it hit the lowest level since April 10 at $3,120. The price has now rebounded to around $3,190.
Technical analysis:
Gold once again showed a trend of falling first and then rising, basically swallowing up all the declines in the Asian market. Is gold about to start a new round of rise? I don't think it is possible to judge that the upward trend is established now. Because from the weekly line, the price rushed up and fell back, and the more obvious signal is that it will fall again.
From the daily rhythm, today fell first and then rose, and the short-term rise was strong, swallowing up all the declines in the Asian session and there are signs of continued rise. But in terms of rhythm, the watershed of the Asian session's decline is the integer mark of 3,200. If it continues to be suppressed below the watershed, the market will still fall.
Operation strategy:
Short around $3205, stop loss at $3215, profit range at $3180-3175.
If the gold price breaks through the $3,200 resistance with strength and stays above this level, we need to change our strategy.

Gold V-shaped reversal? How to solve the short order quilt🗞News side:
1.PPI has fallen for three consecutive months
2. Russia-Ukraine talks are ongoing
3. Powell says the era of long-term low interest rates is over
📈Technical aspects:
Gold rebounded from oversold in the European session, hitting a low of 3120 before pulling back and rising. After a second retracement to confirm 3130, it made a V-shaped reversal. Currently, gold is still testing the 3190-3200 resistance line. Before breaking the resistance range, gold may still usher in a second bottom detection
🎁SELL 3190-3200, SL 3210, TP 3170-3160
If you agree with this view, or have a better idea, please leave a message in the comment area. I look forward to hearing different voices.
FOREXCOM:XAUUSD FXOPEN:XAUUSD TVC:GOLD FX:XAUUSD OANDA:XAUUSD

XAUUSD SHORT SELLING RESISTANCEHere I Created This XAUUSD Chart Analysis
Pair : XAUUSD (Gold)
Timeframe: 15 - Minutes
Pattern: Resistance
Momentum: Bearish/ SELL
Entry Level : SELL 3187
Resistance zone : 3190
Target Will Be : 3160
Disclaimer : This signal is based on personal analysis for learning purposes. Trade at your own risk and always use proper risk management.

5/15 Gold Trading Signals🌇Good afternoon, everyone!
Yesterday, gold broke the support after some sideways movement and touched the buy zone near 3170, but profit was limited.
Today, after opening, gold rebounded to above 3190 but faced resistance and started dropping again. Notably, the 1-hour chart shows bullish divergence, and although not yet corrected, such divergence usually leads to a rebound of at least $60 — a potential opportunity worth watching.
🗞 News Highlights:
U.S. Initial Jobless Claims
Research conference on monetary policy and economy
These events may significantly impact gold, so stay alert.
📌 Today’s Trading Strategy:
🟢 Buy Zone: 3113 – 3076
🔴 Sell Zone: 3208 – 3223
🔄 Flexible Trading Ranges:
▫️3123-3152-3168-3187-3198
✅ Maintain cautious, flexible positioning. Watch for divergence correction opportunities for a potential sharp rebound.

2000+ Pips Down This Week – Can Gold Finally Breathe?Yesterday, Gold continued its aggressive drop and, as expected, broke below the key 3200 level, reaching the 3165 support zone and even exceeding it — trading now around 3136.
The move that started on Monday is extremely sharp — more than 2,000 pips lost in just a few days — and follows the same pattern we've seen recently: rapid, volatile swings.
________________________________________
❓ Is this the bottom, or will the fall continue?
At this stage, calling a bottom is risky. There is no clear sign of exhaustion on higher timeframes, and Gold remains vulnerable.
________________________________________
📌 What I’m watching now:
• Lower timeframes (M30–H1) for signs of a temporary reversal
• Potential bullish divergence
• Watching for spikes down followed by sharp reversals to the upside as potential long entries — aiming to catch a short-term correction within the broader downtrend
________________________________________
📊 Trading Plan:
For now, I will wait for a possible upside correction, but I won’t rush in. If signs of a bottom emerge, I might catch a short-term bounce, with tight risk.
Disclosure: I am part of Trade Nation's Influencer program and receive a monthly fee for using their TradingView charts in my analyses and educational articles.

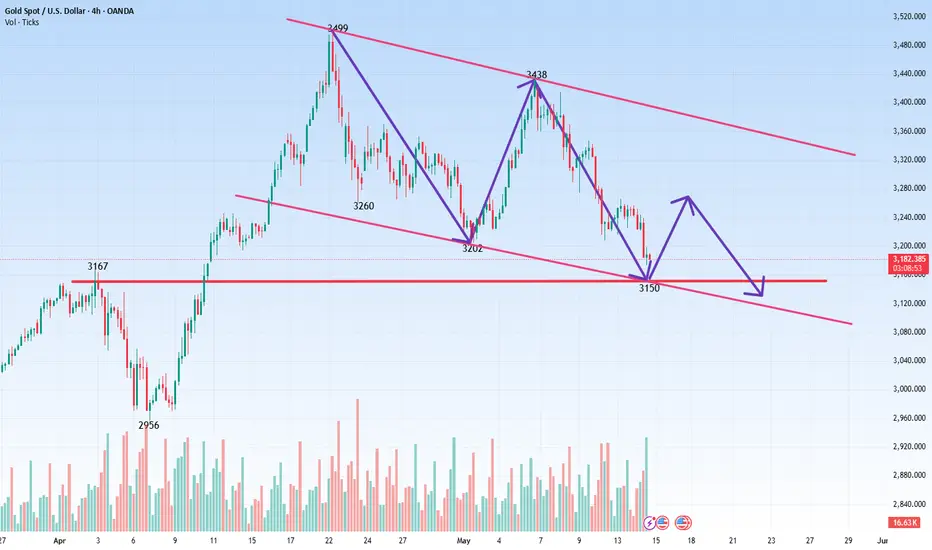
Gold Price Drops to Lowest Level in Over a MonthGold Price Drops to Lowest Level in Over a Month
As shown on the XAU/USD chart, the price of gold fell below $3,130 this morning – its lowest level since 10 April.
Since its peak in May, gold has lost more than 8% in value per ounce.
Why Is Gold Falling?
Bearish sentiment in the gold market may be fuelled by easing geopolitical tensions. According to media reports:
→ China and the US have already reported progress in reaching a trade agreement, while details of potential deals with India, Japan, and South Korea are currently being developed.
→ Iran is reportedly willing to sign a nuclear deal in exchange for the lifting of sanctions. In addition, Donald Trump may lift sanctions on Syria during his visit to the Middle East.
→ The situation between India and Pakistan has stabilised, and today, talks between Russia and Ukraine are expected to take place in Istanbul, with a potential ceasefire on the agenda.
These developments could be seen as reducing the appeal of gold as a safe-haven asset.
Technical Analysis of the XAU/USD Chart
In our 7 May gold price analysis, we:
→ outlined a descending channel (marked in red);
→ noted that bearish pressure persisted above $3,400.
Since then, the gold (XAU/USD) price has continued to move within this channel, breaking support around the $3,200 level and approaching a key support zone formed by:
→ the lower boundary of the red channel;
→ a long-term trendline (marked in blue);
→ a former resistance level (highlighted with arrows) at $3,140.
Given these conditions, traders should consider a scenario in which a minor rebound may occur – for instance, towards the median line of the red channel.
This article represents the opinion of the Companies operating under the FXOpen brand only. It is not to be construed as an offer, solicitation, or recommendation with respect to products and services provided by the Companies operating under the FXOpen brand, nor is it to be considered financial advice.

XAUUSD H1 (15/05/2025)For today setup, i like to make sell position at price 3168 - 3171 for short position
for now i can see Gold can go down until demand h1 (3123 - 3116) and will make bounce if respect that demand. if you guys see the daily timeframe. you can see structure is for buy because daily make breakout. For the position, i will take short position and then fokus buy.
🎯 The Ideal Combo for trading:
📌 A discipline mind
📌 A trading edge
📌 Risk management
📌 Long-term mentality.

The technical side collapses! Can the bear market continue?🗞News side:
1. Russia and Ukraine hold ceasefire talks
2. Initial jobless claims data released during today's US trading session
3. Trump administration exposed to trillions of national debt
📈Technical aspects:
After gold fell below 3200, it pointed directly at the 3100-3000 line. Although there has been a rebound in the process, the current short-term short-term situation has not changed. The current lack of rebound momentum in the market is mainly due to the fact that the bad news has not been completely digested. At present, the gold price has rebounded to around 3160. Above, we need to pay attention to the first-line suppression of 3168, which is the first low point in the decline, followed by the 3190-3200 resistance zone above. If the gold rebound cannot break through the 3168 point, then the gold price will most likely continue its decline, test the 3120 low again, or even move towards 3000. If the European market hits the 3168 line and encounters resistance, it can be short-term and focus on the release of initial jobless claims data in the US market.
If you agree with this view, or have a better idea, please leave a message in the comment area. I look forward to hearing different voices.
OANDA:XAUUSD FX:XAUUSD TVC:GOLD FXOPEN:XAUUSD FOREXCOM:XAUUSD

XAUUSD Analysis today: Unemployment spike? Hello traders, this is a complete multiple timeframe analysis of this pair. We see could find significant trading opportunities as per analysis upon price action confirmation we may take this trade. Smash the like button if you find value in this analysis and drop a comment if you have any questions or let me know which pair to cover in my next analysis.

Gold Breaks Lower: Geopolitics Calm, Yields Rise, Bulls RetreatOANDA:XAUUSD Gold weakened beneath $3,150 as easing US-China trade tensions and fading Fed rate cut expectations dented safe-haven demand. US Treasury yields rose, putting further pressure on non-yielding assets. Technically, gold is testing crucial support at $3,123. A break lower can see potential for downward movement to $3,084. Fed Chair Powell speech and PPI data remain key for short-term guidance.
Resistance : $3,171 , $3,229
Support : $3,123 , $3,084

Gold plummets, pay attention to the 3100 first-line support🗞News side:
1. Russia and Ukraine hold ceasefire talks
2. Initial jobless claims data released during today's US trading session
3. Trump administration exposed to trillions of national debt
📈Technical aspects:
Gold has been in a sideways consolidation yesterday, and we did not have a good entry opportunity to trade in the evening. Today, it has been falling with inertia since the opening of the market. It has now fallen to around 3130, successfully breaking through 3150, the key early point. At present, the daily chart of gold is in a downward wedge arrangement, with the focus on 3130 support below and 3200 suppression above. If the European market cannot fall below 3130, then be wary of bullish counterattacks.
On the other hand, if we fall below the 3130 line, we will fall back and continue to focus on the 60-day moving average support 3105-3110 area. Therefore, in terms of operation, gold will first focus on the 3130 first-line support. If it breaks below, wait for the 3105-3110 area and then consider buying based on the long-short game. The top target is the 3190-3200 area. If it does not break 3200, then go short!
If you agree with this view, or have a better idea, please leave a message in the comment area. I look forward to hearing different voices.
FOREXCOM:XAUUSD FXOPEN:XAUUSD TVC:GOLD FX:XAUUSD OANDA:XAUUSD

XAUUSD SellThis week's trading cycle is fast. And there are huge fluctuations. The news is still more negative. So the decline is expected. Followers have also gained rich profits.
At present, the entire trading logic is still mainly selling. With the gradual realization of the goal, the space below becomes larger.
After the target of 3160-3130 is reached, XAUUSD has reached the lowest position of 3119. This is a huge drop. The trading opportunities are also greater. At present, 3150-3130 is a support in a dense trading area. In the short term, you can pay attention to the rebound position of 3160-3172DE selling position. The target is 3100-3070.
If it breaks through 3175, then the short-term needs to pay attention to the upper pressure level of 3200-3210. The transaction is still mainly selling.
