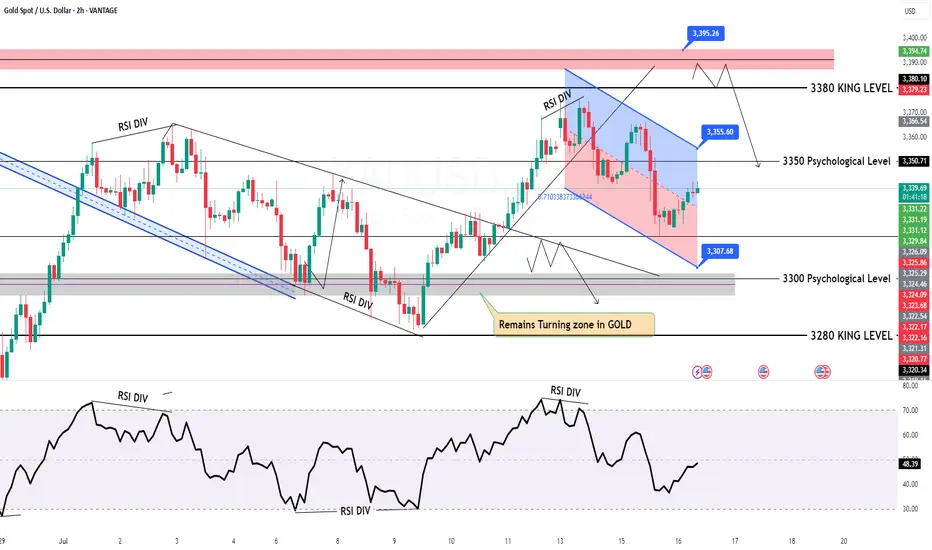
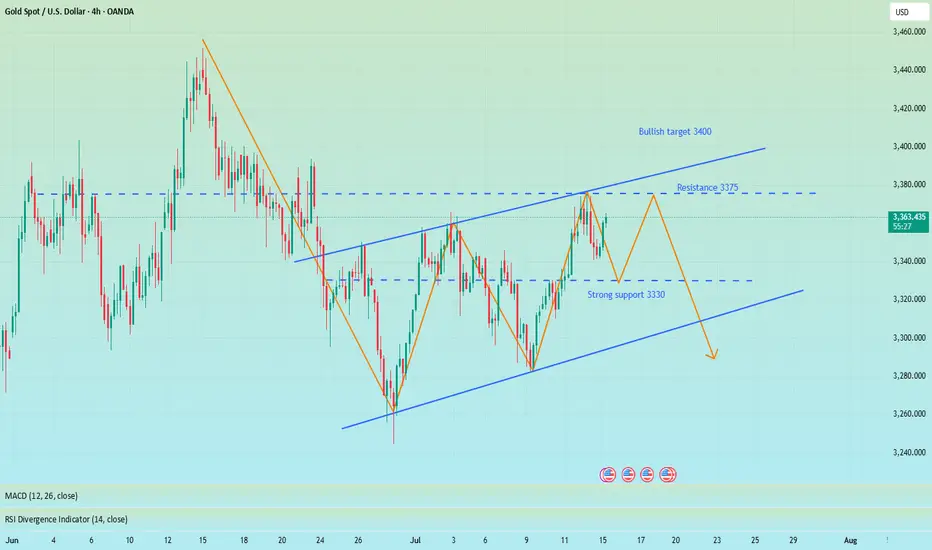
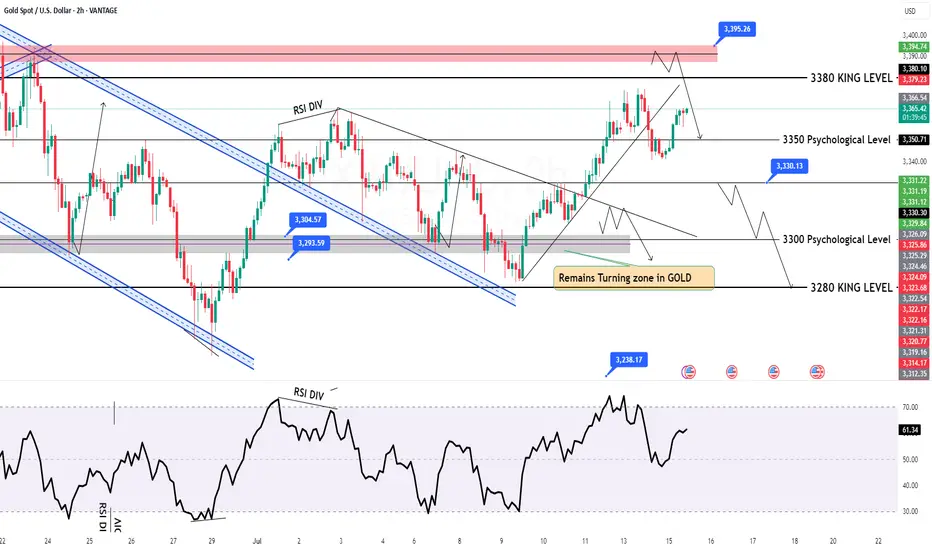
#XAUUSD(GOLD): Strong Sellers Hold, Further Drop Incoming! God dropped from our area of entry yesterday as we initially expected. However, since the massive drop, we are now seeing some short-term correction in the prices. In the coming time, we can expect further price drops around 3280 or 3250.
If you like our idea, please like and comment.
Team Setupsfx_
Xauusdupdates
Gold: Bull-Bear Swings & Today's Trade Tips + AnalysisAnalysis of Gold News Drivers:
During the U.S. session on Wednesday (July 16th), spot gold surged sharply and is currently trading around 3,370 🚀. Trump stated that tariff letters will soon be sent to small countries, with rates likely slightly above 10%, providing safe-haven support for gold prices 🛡️.
Gold prices fell 0.5% on Tuesday, closing at 3,324.68, barely holding above the 55-day moving average of 3,222 📉. Earlier, the U.S. June CPI increase hit its highest level since January, pushing the U.S. dollar index to a nearly three-week high, while U.S. Treasury yields also climbed to a six-week peak, pressuring gold prices ⚖️. The dollar index has risen for four consecutive trading days, hitting a high of 98.70 on Tuesday, the highest since June 23rd 🆙. A stronger dollar makes dollar-denominated gold more expensive for investors holding other currencies, thereby weighing on gold prices 💸.
However, the market largely interprets the dollar's recent rally as a technical adjustment rather than a reversal of the long-term trend 🔄. Despite short-term pullbacks in gold prices, market sentiment has not fully turned pessimistic 😐. While gold is currently in a consolidation range since mid-May, uncertainties surrounding tariff policies may offer support 🔀. Overall, the long-term outlook for gold remains optimistic, with sustained market focus on tariff issues expected to drive a rebound in gold prices in the future 📈
Accurate signals are updated every day 📈 If you encounter any problems during trading, these signals can serve as your reliable guide 🧭 Feel free to refer to them! I sincerely hope they'll be of great help to you 🌟 👇
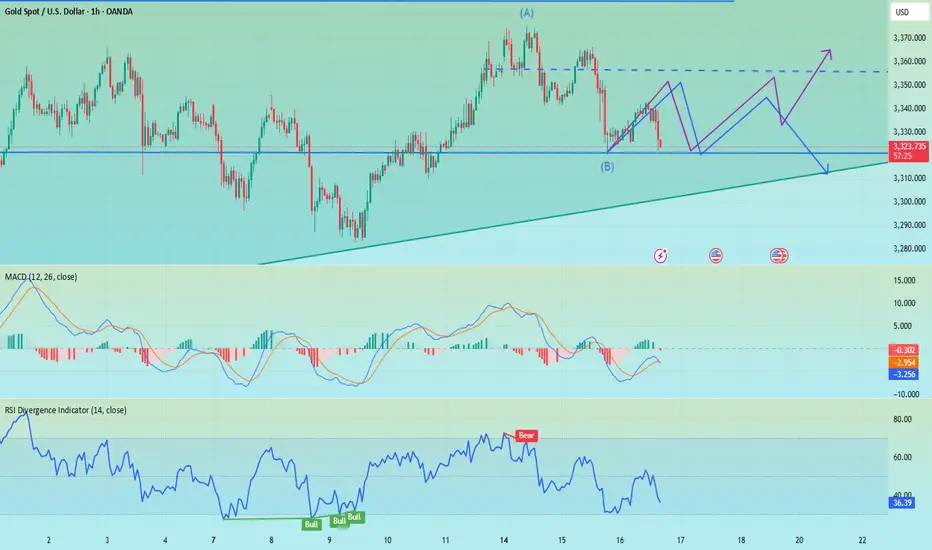
Gold – Bullish Structure Still Intact, but Bears are Knocking📉 What happened yesterday?
As expected, XAUUSD made another leg down, breaking even below my buy zone (3330–3335) and hitting a low at 3320. From there, we’re now seeing a modest rebound, with gold trading around 3333 at the time of writing.
📌 Current position:
I'm currently holding a long position. It hovers around break-even – fluctuating between small gains and small losses. Nothing solid yet.
❓ Key question:
Was this just a deep pullback within a bullish structure… or the beginning of a deeper trend reversal?
🔍 Why bulls still have a case:
• Price prints higher lows – bullish structure technically remains intact
• A clean break above 3350 would show short-term strength
• A confirmed break above 3375 would activate a bullish ascending triangle → targeting the 3450 zone
⚠️ But here's the concern:
• Yesterday’s dip to 3330 happened during the New York session (strong volume)
• The bounce from 3320 has been weak, with no follow-through
• Daily candle closed near the lows, showing a long upper wick → a classic bearish signal
• The confluence support now lies at 3310–3320. A red daily candle closing in this area could mean the medium-term trend is flipping
🎯 My trading plan:
Although I'm still holding my buy, if bulls don’t recover 3350 quickly, I will consider closing early. The break of 3310 would shift my bias bearish.
________________________________________
📌 Conclusion:
We’re in a critical zone. The bullish structure isn’t broken yet, but yesterday’s action was not encouraging. If buyers fail to reclaim control soon, the market may be preparing for a deeper correction. Stay sharp. 🚀
Disclosure: I am part of TradeNation's Influencer program and receive a monthly fee for using their TradingView charts in my analyses and educational articles.
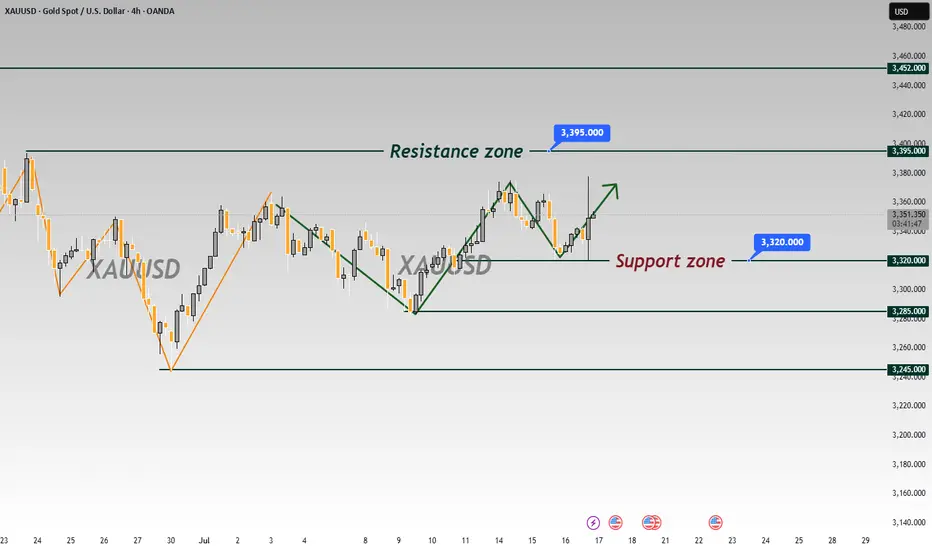
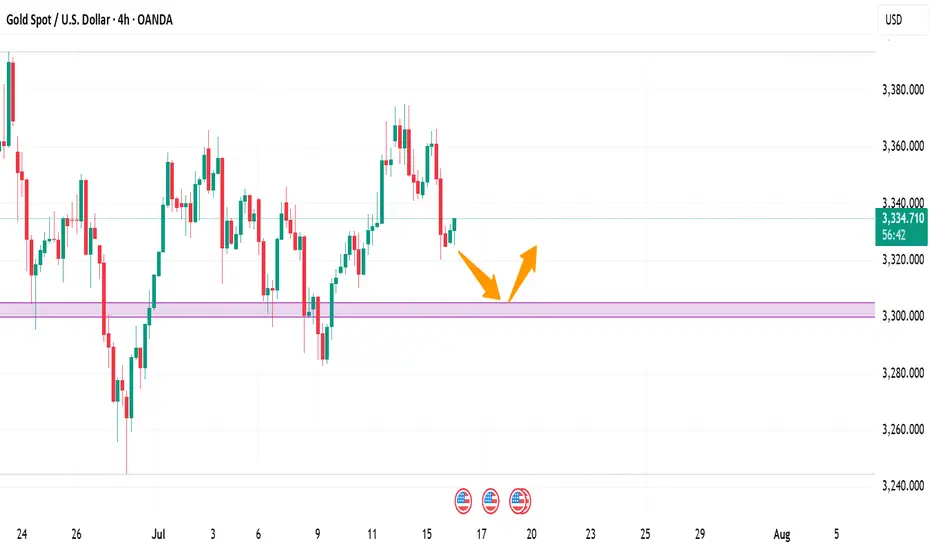
Gold Spot Price (USD) - 4-Hour Chart (OANDA)4-hour performance of the Gold Spot price against the U.S. Dollar (OANDA). The current price is $3,223.660, reflecting a 1.3% decrease. Key levels include a resistance zone around $3,360.405 and a support zone near $3,294.070, with recent price action showing a potential breakout or reversal within these ranges.

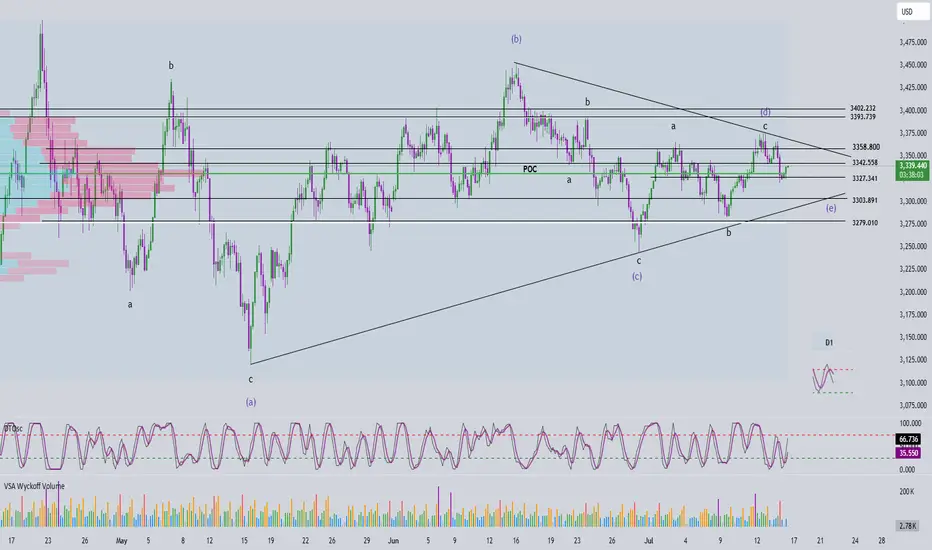
Elliott Wave Analysis – XAUUSD July 16, 2025🔄 Momentum Analysis
D1 timeframe: Momentum is currently reversing to the downside, suggesting that the price may continue to decline or move sideways in the short term.
H4 timeframe: Momentum is rising, indicating that the current recovery may continue. The next resistance zones to watch are 3342 and 3358.
🌀 Elliott Wave Structure
At present, price action is being compressed within a contracting triangle corrective pattern, with its range narrowing further—signaling market consolidation. We should closely monitor for signs of a breakout that could end this correction.
Based on the current wave structure, it is expected that wave d (green) has completed, and the current downward move is likely part of wave e (green).
The trading strategy focuses on waiting for the price to approach the lower boundary of the triangle—drawn from the low of wave a to the low of wave c—looking for confluent support areas near this trendline to identify a potential BUY opportunity.
🎯 Target & Trade Plan
BUY ZONE: 3303 – 3300
Stop Loss (SL): 3290
Take Profits (TP):
- TP1: 3327
- TP2: 3358
- TP3: 3402
Pay attention to 3320, if it falls below, go long at 3310-3300The short order has been completed and profit has been realized. Now the 1H technical indicators show that there is still room for decline in the short term. Focus on the 3320 support. If it falls below 3320, the gold price is expected to reach the 3310-3300 area, which is also an ideal trading area for intraday long positions. There is nothing much to say. Follow the wolves and you will get meat. Currently, the brothers who follow me to trade have all made good gains.
OANDA:XAUUSD
The rebound is not a reversal, continue to shortGold showed a trend of rising and falling back and closing low on Tuesday. The highest intraday rise was 3366, and the lowest fell to 3320. The daily line recorded a medium-sized Yin line with a long upper shadow. The K-line was negative, and the closing line broke the resonance support of the middle track and the short-term moving average, suggesting that the bullish momentum has slowed down and the bears are ready to move. Today, we need to pay attention to the further downward performance of gold. From the 4H level, the price stood firm at the four-hour resistance position last Thursday, and then rebounded upward in the short term. Yesterday, the price fell below the daily support level. Currently, the short-term market is bearish, and attention is paid to the resistance in the 3340-3345 range above. In the one-hour period, the price is in short-term shock adjustment. On the whole, it will be treated as a shock decline before breaking yesterday's low, and the lower side pays attention to the 3225-3320 area support. In the short term, you can consider shorting at 3340-3350 in the European session, and look towards 3330-3320
OANDA:XAUUSD
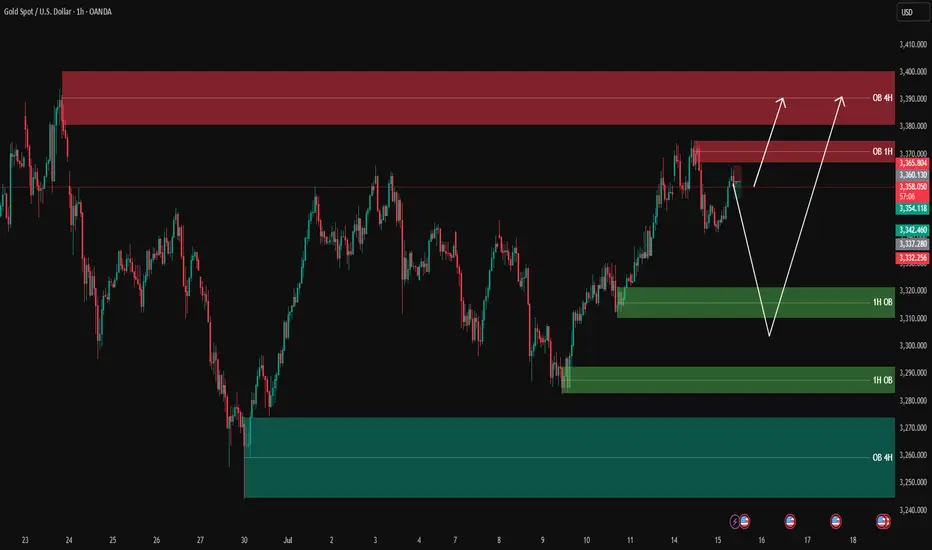
XAUUSD analysis - 1H FVG and OB Setups✅ Green boxes = Buy Order Blocks (OB)
✅ Red boxes = Sell Order Blocks (OB)
✅ Blue boxes = Fair Value Gaps (FVG) (none currently on this chart)
Currently, gold is approaching the 1H Sell OB (red) between 3360 – 3370, which is a strong resistance zone.
We have two clear scenarios:
1️⃣ If sellers step in and we get confirmation, we can look for a pullback down to the lower green buy OB zones:
3320 – 3330 (1H OB)
3290 – 3300 (1H OB)
These zones will be key for looking for buy opportunities with LTF confirmations.
2️⃣ If buyers break above 3370 with a strong close, we can expect a move towards the 4H Sell OB (red) at 3380 – 3395.
🎯 Summary:
✅ Currently looking for a potential sell at the red zone with LTF confirmations.
✅ Watching green zones below for clean buys on a pullback.
✅ If price breaks above, the next target will be 3380 – 3395.
Let price come to your levels, wait for confirmation on 3m/5m for clean entries, and stay disciplined with your plan.
—
📊 ProfitaminFX | Gold, BTC & EUR/USD
📚 Daily setups & educational trades
GOLD Intraday Chart Update For 16 July 2025Hello Traders,
Today we have major news is US PPI, currently market is in tight range between 3360 to 3310
all eyes on 3360 level breakout for the day for further upward continuation
Only break below 3315 market will goes further downside
Currently we also have Bearish channel in H2 TF
Disclaimer: Forex is Risky
Public short selling profit, NY short-term multiple layoutInterest rate futures data showed that the results were in line with our previous expectations, with a lower rate cut this month and a higher probability of a 25 basis point cut in September. In the short term, gold may first take profits and then rebound. NY session trading has just begun. Bros can pay attention to the 3335-3330 area below. If it falls back and stabilizes, you can consider participating in long positions, defending 3325 and targeting 3355-3365.
OANDA:XAUUSD

XAUUSD Forming Falling WedgeGold (XAUUSD) has recently completed a textbook falling wedge breakout, confirming a powerful bullish reversal setup on the higher timeframes. This pattern, known for its strong trend-continuation potential, has played out beautifully. After a period of consolidation and lower highs, price has decisively broken above wedge resistance and is now pushing higher with strong bullish momentum. We've already captured significant profit from the breakout zone, and price action suggests another wave to the upside is imminent.
Fundamentally, gold continues to benefit from growing geopolitical tensions, elevated inflation concerns, and central bank reserve accumulation. With the Federal Reserve leaning cautiously dovish due to signs of a softening labor market and cooling inflation, real yields are under pressure. This is supportive for gold, especially as markets begin to price in potential rate cuts before year-end. The weakening US dollar and stable treasury yields are reinforcing demand for precious metals, particularly among institutional investors seeking safety and hedge assets.
Technically, gold has broken its bearish structure and is forming a new bullish leg, supported by strong volume and RSI divergence at the lows. The breakout from the falling wedge pattern has opened up upside targets toward recent swing highs and potentially even all-time highs if macro conditions remain favorable. With price now above key moving averages and consolidating above the wedge breakout zone, the technical bias is clearly bullish.
This move aligns well with seasonality and macro risk flows. As risk-off sentiment slowly builds and inflation risks remain unresolved globally, gold is regaining its status as a premier safe-haven asset. Expecting continued follow-through in the coming weeks, with clean structure and fundamentals favoring bulls, this setup remains a high-probability opportunity to ride the next impulsive bullish leg.
xauusd setup"🌟 Welcome to Golden Candle! 🌟
We're a team of 📈 passionate traders 📉 who love sharing our 🔍 technical analysis insights 🔎 with the TradingView community. 🌎
Our goal is to provide 💡 valuable perspectives 💡 on market trends and patterns, but 🚫 please note that our analyses are not intended as buy or sell recommendations. 🚫
Instead, they reflect our own 💭 personal attitudes and thoughts. 💭
Follow along and 📚 learn 📚 from our analyses! 📊💡"
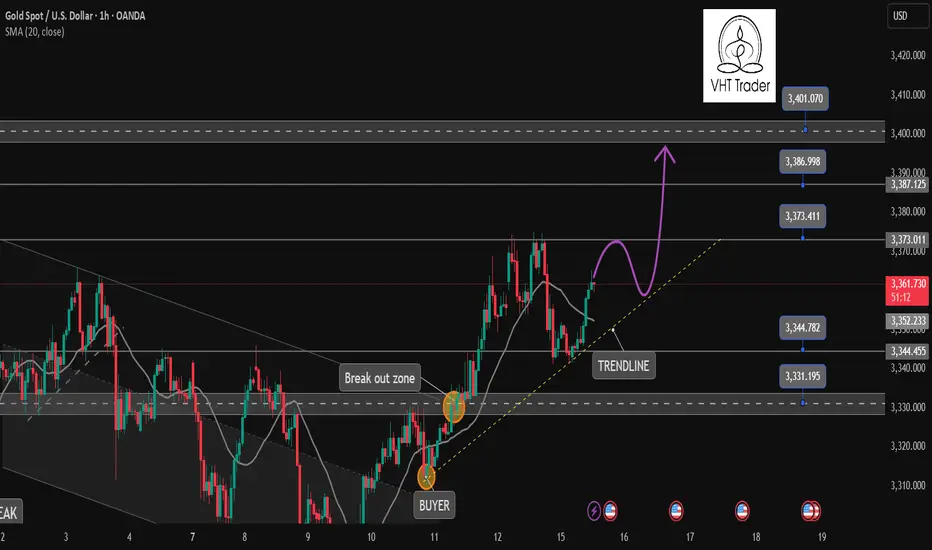
XAUUSD Structural Analysis & Confluence - 16 July 2025 4-Hour Bias & Structural Context
Gold has recently broken above a key structure level at $3,320, confirming a bullish market environment on the 4‑hour timeframe. This follows a Change of Character (CHOCH) around $3,300, signifying a shift from consolidation to an upward trend. The swing from the late-June low ($3,244) to mid-July’s high ($3,374) sets our Fibonacci context:
38.2% retrace ≈ $3,318
50% retrace ≈ $3,309
61.8% retrace ≈ $3,300
These fib levels also align with prior structure and key ICT/SMC zones, signaling strong areas of interest.
🧭 Key 4-Hour Confluence Zones
Demand / Order Block → $3,300 – 3,305
Multi-method support: BOS, CHOCH, 50–61.8% fib convergence.
Fair Value Gap (FVG) → $3,320 – 3,325
Volume deficient zone post-BOS, primed for a retest.
Supply / Resistance Area → $3,360 – 3,370
High-timeframe supply, likely to cap further upside.
🧠 Smart Money Concepts
BOS above $3,320 confirms bullish structure.
CHOCH at ~$3,300 marks structure flip.
Liquidity grab zones found between $3,335–3,340, validating the presence of institutional activity.
Order Block at $3,300–3,305 supports buy-side interest.
📊 1-Hour Intraday Trade Setups
🔸 Setup #1 – FVG Re-Test
Entry: At ~$3,325 on pullback into $3,320–3,325 zone
SL: Below $3,320
TP1: $3,345, TP2: $3,360
🔸 Setup #2 – Demand OB Bounce (“Golden Setup”)
Entry: In the $3,300–3,305 range
SL: Below $3,298
TP1: $3,325, TP2: $3,345, TP3: $3,360
Edge: Tight risk, high confluence (SMC + fib + structure)
🌟 The Golden Setup
Zone to Watch: $3,300–3,305
Why It Rates Highest:
BOS, CHOCH, fib, and OB all align
Offers tight stop placement and strong upside
Risk-to-reward ~1:3
📌 Daily Watchlist Summary
Directional Bias: Bullish (BOS above $3,320 intact)
Primary Entry Zones:
$3,300–3,305 (Demand OB + structure)
$3,320–3,325 (FVG retest for continuation)
Key Target Zones:
$3,345–3,350 – realistic intraday exit
$3,360–3,370 – major supply cap
Invalidation Level: 4‑hour candle close below $3,298 negates bullish outlook
Final Commentary
Stay disciplined—only trade reactive signals at these levels: clean bounces, pinbars, or bullish engulfing patterns. The $3,300–3,305 zone stands out as the prime ‘Golden Setup’ entry.
CPI triggers sell-off, 3330 can be short-term long📰 News information:
1. Focus on tomorrow's CPI data
2. Bowman's speech at the Federal Reserve
3. Tariff information outflows and countries' responses to tariff issues
📈 Technical Analysis:
The short-term trend flag pattern has been formed, and our short-selling strategy perfectly hits the TP. According to current news, Trump has once again urged the Federal Reserve to cut interest rates. While there is almost no possibility of a rate cut this month, there is a high probability that a 25 basis point rate cut will be completed in September, which is also in line with our previous prediction of market trends.
The big negative line in 4H pierced the middle Bollinger band. Although the CPI data is bullish, it has little impact based on the announced value. Market expectations have been digested in advance, so there is no room for a big drop. The upper points still focus on the short-term resistance of 3355-3365. If it rebounds to this area first in the short term, you can consider shorting again. Focus on the strong support of 3330 below. As long as the retracement entity does not fall below 3330, gold will rise again and touch the resistance line of 3375-3385.
🎯 Trading Points:
BUY 3335-3325
TP 3355-3365
In addition to investment, life also includes poetry, distant places, and Allen. Facing the market is actually facing yourself, correcting your shortcomings, facing your mistakes, and exercising strict self-discipline. I share free trading strategies and analysis ideas every day for reference by brothers. I hope my analysis can help you.
OANDA:XAUUSD PEPPERSTONE:XAUUSD FOREXCOM:XAUUSD FX:XAUUSD TVC:GOLD FXOPEN:XAUUSD
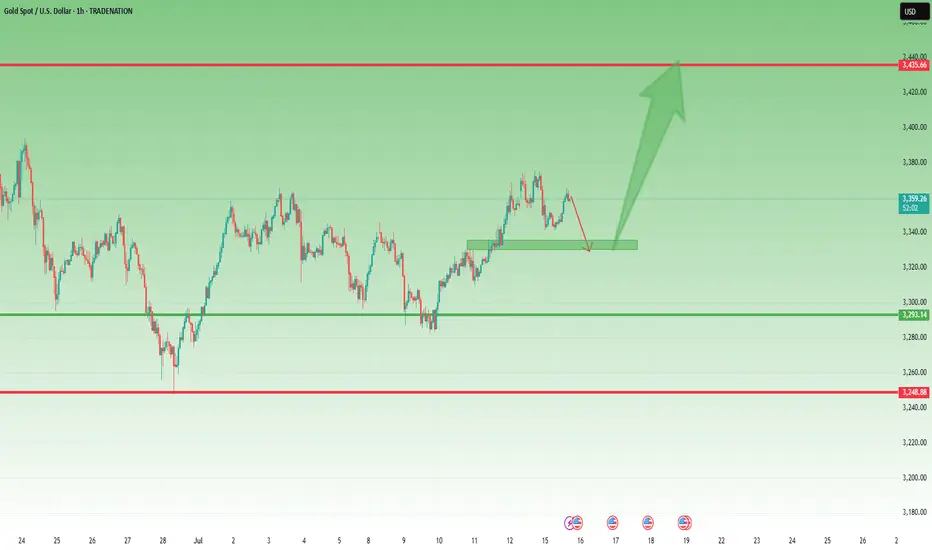
Gold Pullback in Play – Still Aiming for 3450 📌 In yesterday’s analysis, I argued that bulls likely won the battle and that a new leg up toward 3450 could be next from a swing trade perspective. I also mentioned that buying dips remains the preferred strategy.
And indeed – we got that dip.
📉 Price pulled back to 3340 and bounced,
but it hasn’t yet touched my key area of interest: 3330–3335.
What now?
My view stays the same –I still expect a move toward the 3450 zone,but I also believe a deeper dip toward support is still on the table – likely a liquidity grab before the next leg up.
Trading Plan:
✅ Buying dips remains the core strategy
🚫 Invalidation only comes on a break below 3305–3310
🎯 Upside target remains well above 3400, aiming for 1000+ pips
Let’s stay focused and let price come to us.
🚀
Disclosure: I am part of TradeNation's Influencer program and receive a monthly fee for using their TradingView charts in my analyses and educational articles.
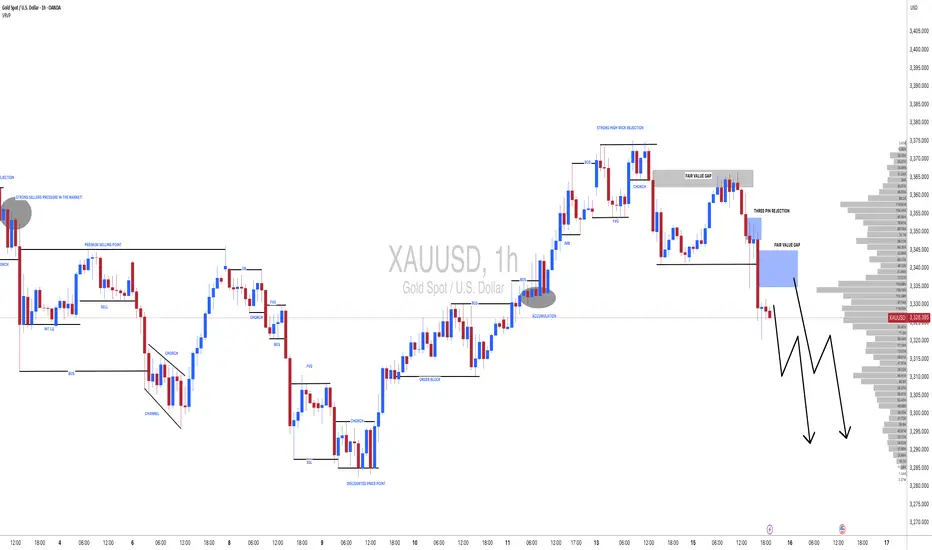
Diving through support, gold's downward space opens up!Gold reached a high of 3366. Although it broke through slightly, it failed to form an effective breakthrough and was only a false break. Subsequently, the bears led the market to continue to decline, breaking the key support of 3330 to 3320 at the end. The daily line closed with a medium-sized Yin line, directly breaking the short-term moving average support, ending the previous three-day positive trend. After the single Yin retreat, the upward trend failed to continue, and the risk of technical pattern reversal increased. The bears chose to break down, indicating that the market may fall further. The first test below is the support of the previous starting point of 3300. If this position is lost, the bearish target will point to the area near the previous low of 3270. The current market atmosphere is bearish, and the key pressure above has moved down to the 3340 line. It is expected that the rebound will be difficult to reach.
In terms of operation strategy: It is recommended that if gold rebounds first, it can be considered to continue to short near 3336-3338, stop loss 3347, and the target is 3310-3300 and below, and strictly stop loss to control risks. The overall bearish view is maintained.

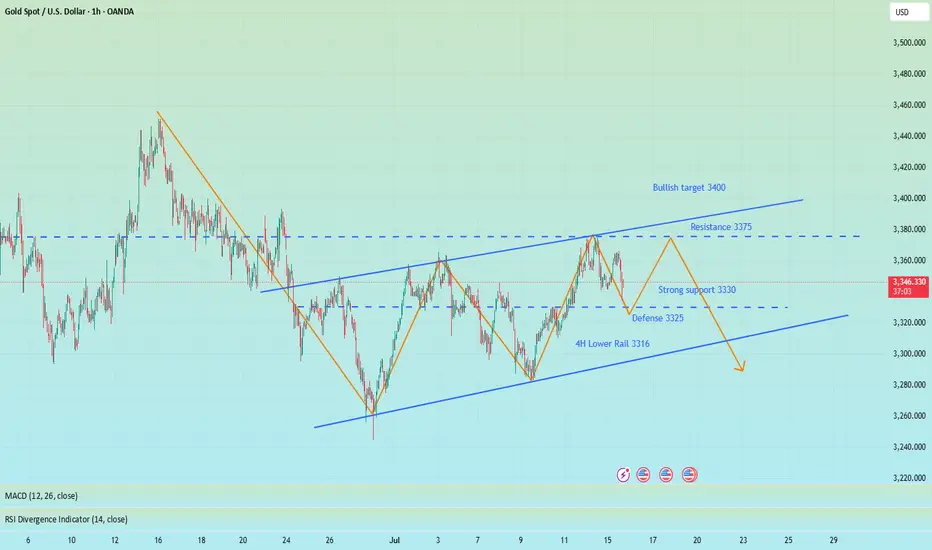
Gold is coming to our target✏️ OANDA:XAUUSD As analyzed on Monday, the market touched the BUY zone at 3345 and continued the bullish wave structure, heading toward the 3400 level. If gold breaks above 3373, it will likely continue its strong upward momentum. Therefore, it is advised to avoid trading against the trend once the 3373 level is broken.
On the other hand, if gold breaks below the key support level at 3343 (yesterday's U.S. session barrier), the current uptrend may temporarily pause. In that case, gold will need to find new momentum to establish a fresh market trend.
📉 Key Levels
SUPPORT: 3343 - 3330 - 3313
RESISTANCE: 3373-3387-3400
Hold BUY order 3345 with target 3400
SELL trigger: Rejection of prices 3373, 3387 with confirmation from sellers
SELL 3400 Strong resistance zone
Leave your comments on the idea. I am happy to read your views.
GOLD...Hello friends
Due to the entry of buyers and the strong breakdown of the indicated resistance, the price is expected to move to the indicated targets.
*Trade safely with us*

XAUUSD: Time For Swing Sell, 1 Hour Timeframe! Gold is currently trading at crucial level where we have witnessed a strong bearish presence. This is a small time frame overview and price may not complete the target fully, so close when you think it is the time. Good luck and trade safe!
Team Setupsfx_

Gold: Data, Tariffs & Trading LevelsThis week is packed with market news and economic data 😣. Key focuses include the US CPI, PPI, retail sales data, and the University of Michigan's preliminary consumer sentiment index. Additionally, former US President Trump plans to make a "major announcement" on Russia; the Federal Reserve will release the Beige Book (Economic Conditions Survey); and the CFTC's weekly positioning report is also worth monitoring 📊.
Over the weekend, Trump imposed tariffs on the EU and other regions, prompting a strong counterattack from the EU. The subsequent evolution of the situation requires continuous tracking, as it has triggered sharp market volatility pushing toward the 3400 mark 😱. Trump has recently announced frequent tariff policies (e.g., 30% tariffs on the EU and Mexico, and threats of 100% tariffs on Russia), amplifying market uncertainty. While this theoretically benefits gold's safe-haven demand, the actual impact requires close observation of institutional capital flows 🤔.
Gold prices consolidated at the bottom after a sustained pullback last night and extended their rebound this morning. Key pressure levels have undergone a support-resistance flip. The current gold rebound is merely a secondary confirmation of the 30-minute top structure, and after surging to 3365 in the afternoon, short-term signs of pressure have emerged 😕. In a volatile market, if prices start to consolidate sideways, it may signal the end of this oscillating upward trend, with a shift to a downward phase ahead.
Given market sensitivity ahead of the CPI data release, it’s advisable to focus on a volatile pullback trend 🧐. After today’s rebound, key attention should be on the 3363-3368 range as a shorting zone, with the long/short defensive level set at yesterday’s intraday high of 3375. Downside support is focused on the 3340-3335 range 🔍

It is expected to fluctuate and fall before CPI data📰 News information:
1. Focus on tomorrow's CPI data
2. Bowman's speech at the Federal Reserve
3. Tariff information outflows and countries' responses to tariff issues
📈 Technical Analysis:
The 1H chart shows that the gold price continued to pull back last night and then fluctuated at the bottom, and continued the rebound trend this morning. The key pressure level is the top and bottom conversion level. The current rebound in gold is only a secondary confirmation of the top structure at the 30-minute level. After reaching 3365, it has shown signs of short-term pressure. In a volatile market, if the price begins to consolidate horizontally, it may indicate the end of this round of volatile upward trend, and it will enter a downward phase later. Considering the market sensitivity before the release of CPI data, it is recommended to focus on the volatile decline trend. After today's rebound, it is necessary to focus on the 3365-3368 area as a short-selling range, and the long-short defense position is set at yesterday's intraday high of 3375. The support below focuses on the 3350-3340 range.
🎯 Trading Points:
SELL 3358-3368
TP 3345-3333
In addition to investment, life also includes poetry, distant places, and Allen. Facing the market is actually facing yourself, correcting your shortcomings, facing your mistakes, and exercising strict self-discipline. I share free trading strategies and analysis ideas every day for reference by brothers. I hope my analysis can help you.
FXOPEN:XAUUSD TVC:GOLD FX:XAUUSD FOREXCOM:XAUUSD PEPPERSTONE:XAUUSD OANDA:XAUUSD
GOLD Intraday Chart Update For 15 July 2025Hello Traders,
Welcome to the US CPI Day, as you can see that market is in tight range for now and all eyes on the breakout for now
Only clear breakout of 3380 we will consider market will be bullish towards 3400 & 3425
If markets sustains below 3335 it will move towards 3305 or even 3285
All eyes on US CPI
Disclaimer: Forex is Risky
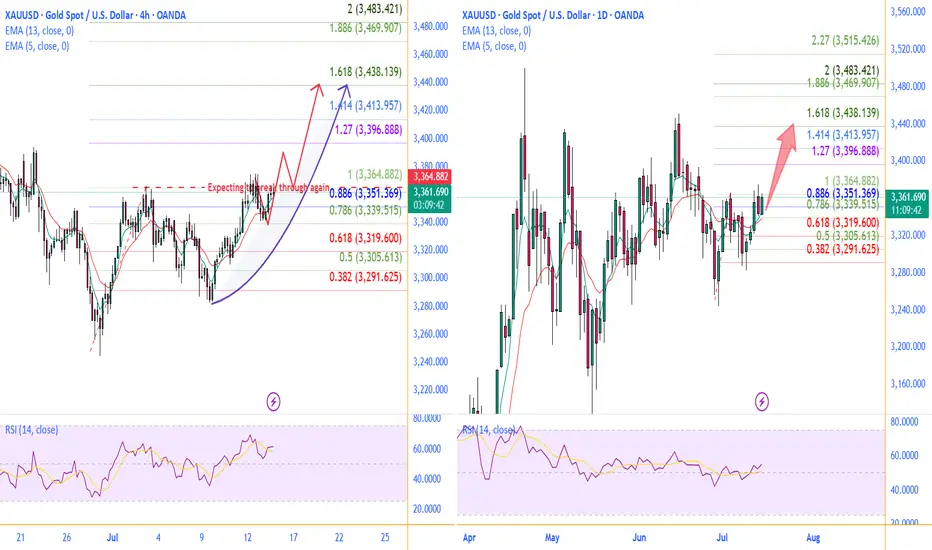
1507 a bull trend back to Gold Hello traders,
Gold has returned back above EMAs on daily chart.
On 4h chart, there is a chance for it to break through last top level to make a new high up to 3438 .
Take a good use liquidity of CPI of US today.
You could get a great result of that.
GOOD LUCK!
LESS IS MORE!