After the gold frenzy, there will soon be a sharp correctionTo be honest, I must admit that I still hold a short position. I think there should be many people holding short positions now, but they are unwilling to admit that they hold short positions because they are losing money.
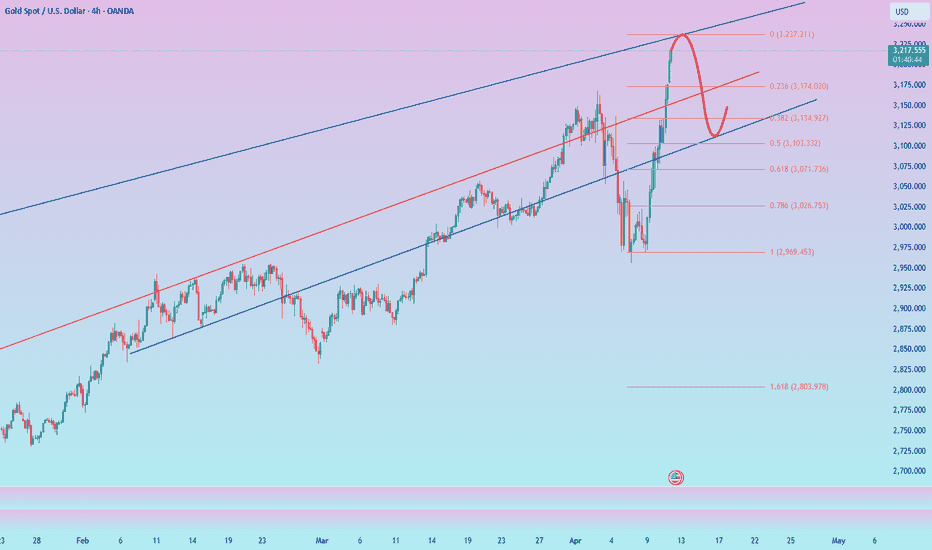
I think it is not shameful to hold a short position now. Although gold has violently risen to around 3220, from the perspective of trading volume, gold is rising without volume. Without the support of trading volume, gold is destined to usher in a round of correction in the short term.
And I have reason to believe that the accelerated rise of gold is suspected of being manipulated by large institutional funds. There are two purposes. One is to accelerate the rise to attract more retail funds to flow into the market to take over; the other is to raise prices arbitrarily to make it easier to sell. So the faster gold rises, the easier it is to collapse! We first aim at the retracement target: 3150-3130 area,or even 3120.
So for short-term trading, I think we can still continue to short gold, and I am optimistic about the short position of gold! The trading strategy verification accuracy rate is more than 90%; one step ahead, exclusive access to trading strategies and real-time trading settings
Xauusdwave
Bull market hides falling crisis!Gold rose sharply to around 3170 in the short term. Gold is in an obvious bull market. I think we should not be too optimistic! Don't blindly chase gold in trading!!!
Although it is only one step away from the previous high, it not only faces the psychological resistance of 3200, but also multiple integer resistance. After the fundamental positive factors are exhausted, it is difficult for gold to have enough power to continue to rise and break through the heavy resistance.
So the sharp rise of gold is likely to be a bull market trap, in order to confuse more people to chase gold, and large institutional funds take the opportunity to sell! So in terms of short-term trading, I still will not vigorously chase long gold, I will start to short gold gradually in batches! The faster gold rises, the faster it may collapse!
Bros, I am not afraid of shorting gold now. I think short trading can also bring me huge profits. The retracement target first focuses on the area around 3135.The trading strategy verification accuracy rate is more than 90%; one step ahead, exclusive access to trading strategies and real-time trading settings
It is hard not to make a profit by trading CPI like thisI have to say that gold is indeed in a bullish pattern at present. After all, gold did not even fall below 3110 during the correction process. However, the current fluctuations are relatively cautious, and we are waiting for the guidance of CPI data, which may exacerbate short-term fluctuations!
To be honest, although gold is in a bullish pattern, the resistance above cannot be ignored, especially the 3150-3155 area and the previous high of 3167. It is not ruled out that gold will form a secondary high during the rise and form a double-top structure with the previous high of 3167, so I will not be a radical in the short term and set the target at 3200.
In addition, during the CPI data period, it is not ruled out that gold will rise and then fall back, so I do not advocate blindly chasing gold. On the contrary, I will definitely try to short gold in the 3050-3060 area. However, the market's long sentiment is high, and it is not advisable to have too high expectations for the magnitude of the correction in short-term trading. The first retracement target area is: 3105-3095, followed by 3080!
Get Rich: Buy Cheap GoldAfter a sharp decline, gold seems to have insufficient bullish momentum compared to before, but this is only in comparison. In fact, after gold hit the low point near 2957, the low and high points of gold are gradually rising. We can see that the bulls are gradually and implicitly picking up cheap chips.
So now we can't blindly short gold. According to the current gold structure, gold may continue to rebound above 3030, or even around 3050. These two positions will be the target areas for long traders and will also be the entry prices suitable for short traders.
So for short-term trading, I will adjust my trading strategy and plan in time. If gold falls back to the 3000-2990 area, I may first tend to go long on gold!
It must be noted that the current gold price fluctuates frequently and violently, so you must be particularly patient first. Because once there is no good entry price, it is difficult to set the psychological SL, and setting a relatively small SL is easy to be hit in market fluctuations!
The trading strategy verification accuracy rate is more than 90%; one step ahead, exclusive access to trading strategies and real-time trading settings
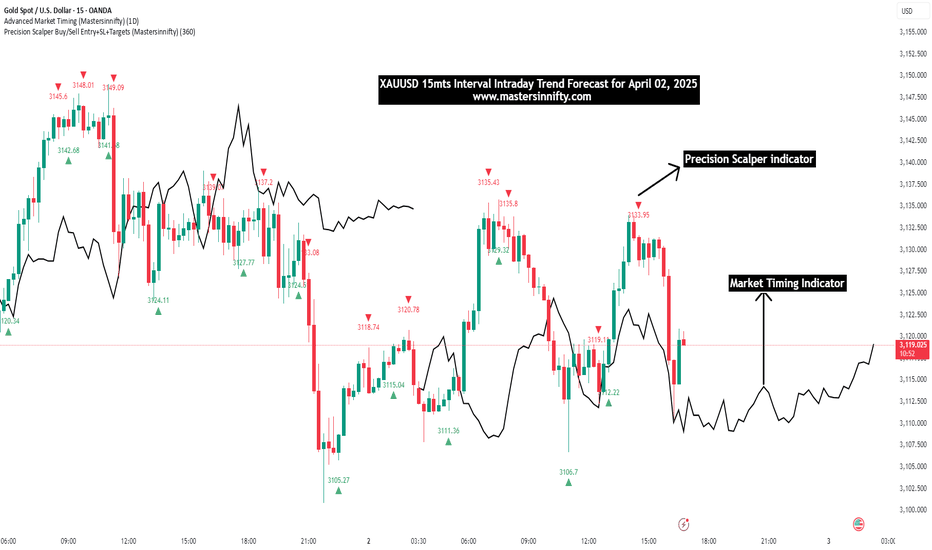
XAUUSD hourly trend analysis for April 09, 2025XAUUSD trend is currently bearish. Once it closes above 3023, there is an immediate resistance at 3050. But 3050 may not indicate bullishness unless Trend trading indicator confirms the signal. Once the Buy is confirmed, there would be an immediate resistance at 3090. This is just my view.
Gold has won two consecutive games, continue to short?Gold continued to be in a dead cross downward short position at 1 hour. The strength of gold short positions has not diminished. Gold fell near the resistance of 3017, and the gold moving average resistance has now moved down to near 3021. After gold rebounds, it is still mainly short selling.
Trading ideas: short gold near 3015, stop loss 3025, target 2990
The above is only a sharing of personal opinions and does not constitute investment advice. Investment is risky and you are responsible for your profits and losses.
Gold is Bullish, Target 3030-3060At the market open today, we signaled a buy opportunity near the 2980 level for gold. Since then, the price has surged over $30, and those who followed the strategy have already secured solid profits.
Gold is now approaching a short-term resistance, so a minor pullback may occur. However, the overall uptrend for the day remains intact, and our strategy continues to favor buying on dips.
Based on the current chart pattern, there's potential for the price to rise toward the 3030–3060 zone later today.
Stay alert for retracement opportunities, manage your position size wisely, and trade with discipline.
If you missed this entry, don’t worry — the next opportunity is just around the corner!
Gold's decline is not over yet, go short on the rebound!The gold 1-hour moving average continues to cross the downward short arrangement, the momentum of gold shorts is still there, and gold rebounds and continues to short. Of course, gold has been falling sharply in the past few days, and the market may gradually begin to recover. You must wait patiently for opportunities to rebound, and do not chase short positions easily.
Trading ideas: short gold near 3017, stop loss 3027, target 2090
The above is purely a sharing of personal opinions and does not constitute trading advice. Investments are risky and you are responsible for your profits and losses.
XAU/USD "The Gold" Metal Market Heist Plan (Scalping/Day Trade)🌟Hi! Hola! Ola! Bonjour! Hallo! Marhaba!🌟
Dear Money Makers & Robbers, 🤑💰✈️
Based on 🔥Thief Trading style technical and fundamental analysis🔥, here is our master plan to heist the XAU/USD "The Gold" Metal Market. Please adhere to the strategy I've outlined in the chart, which emphasizes short entry. Our aim is the high-risk Blue MA Zone. Risky level, oversold market, consolidation, trend reversal, trap at the level where traders and bullish robbers are stronger. 🏆💸"Take profit and treat yourself, traders. You deserve it!💪🏆🎉
Entry 📈 : "The heist is on! Wait for the MA breakout then make your move at (3000) - Bearish profits await!"
however I advise to Place sell stop orders above the Moving average (or) after the Support level Place sell limit orders within a 15 or 30 minute timeframe most NEAREST (or) SWING low or high level.
📌I strongly advise you to set an "alert (Alarm)" on your chart so you can see when the breakout entry occurs.
Stop Loss 🛑: "🔊 Yo, listen up! 🗣️ If you're lookin' to get in on a sell stop order, don't even think about settin' that stop loss till after the breakout 🚀. You feel me? Now, if you're smart, you'll place that stop loss where I told you to 📍, but if you're a rebel, you can put it wherever you like 🤪 - just don't say I didn't warn you ⚠️. You're playin' with fire 🔥, and it's your risk, not mine 👊."
📌Thief SL placed at the nearest/swing High or Low level Using the 4H timeframe (3050) Day/Scalping trade basis.
📌SL is based on your risk of the trade, lot size and how many multiple orders you have to take.
Target 🎯: 2960
XAU/USD "The Gold" Metal Market Heist Plan (Scalping/Day Trade) is currently experiencing a Neutral trend (there is a chance to move bearishness),., driven by several key factors.👇
📰🗞️Get & Read the Fundamental, Macro, COT Report, Quantitative Analysis, Sentimental Outlook, Intermarket Analysis, Future trend targets.. go ahead to check 👉👉👉🔗
⚠️Trading Alert : News Releases and Position Management 📰 🗞️ 🚫🚏
As a reminder, news releases can have a significant impact on market prices and volatility. To minimize potential losses and protect your running positions,
we recommend the following:
Avoid taking new trades during news releases
Use trailing stop-loss orders to protect your running positions and lock in profits
💖Supporting our robbery plan 💥Hit the Boost Button💥 will enable us to effortlessly make and steal money 💰💵. Boost the strength of our robbery team. Every day in this market make money with ease by using the Thief Trading Style.🏆💪🤝❤️🎉🚀
I'll see you soon with another heist plan, so stay tuned 🤑🐱👤🤗🤩
Buy gold, expect a rebound to 3000Gold just fell to 2958, but quickly rebounded to above 2965. The short-term support of 2965-2960 was not effectively broken. Gold quickly recovered above the short-term support, proving that bulls still have room to fight back. I expect gold to at least rebound and test the 3000 position again, so in short-term trading, we should not be too bearish on gold.
I actually reminded everyone in the last article update that we can buy gold when gold falls. In this extremely fierce market, with a cautious trading mentality, I actually do not expect too much about the rebound space of the bulls. Once gold touches around 3000, I will leave the market safely and lock in profits!
The trading strategy verification accuracy rate is more than 90%; one step ahead, exclusive access to trading strategies and real-time trading settings
Gold still has the potential to bounce back to 3070!Gold has been experiencing significant volatility driven by fundamental factors. While bearish sentiment appears to remain dominant, the recent downside move has already priced in much of the negative risk. As such, traders should avoid an overly one-sided bearish bias in the current environment.
After bottoming out near the 2970 level, gold staged a strong rebound. During the ensuing consolidation phase, the 3010–3000 zone has provided consistent support, signaling the emergence of a short-term demand zone. This indicates that the bulls have not completely capitulated and may attempt to stage a corrective rally toward the 3050 level, or potentially even as high as 3070.
From a short-term trading perspective, we may consider initiating long positions within the 3015–3005 range, aiming for an upside target of 3050, with a possible extension toward the 3070 resistance area.
The trading strategy verification accuracy rate is more than 90%; one step ahead, exclusive access to trading strategies and real-time trading settings
Master swing trading! Both long and short sides can profit!The current fundamental environment: tariff issues and geopolitical conflicts are on opposite sides, so there are both bearish and bullish factors for the gold market, which have triggered fierce competition between long and short forces to a certain extent, exacerbating market volatility!
At present, overall, the short forces have the upper hand, but the longs still have a certain ability to fight back! If the short energy is fully released during the process of gold falling to around 2970, then gold may still usher in a wave of rebound opportunities in the short term. First of all, the areas worthy of our participation in trading are mainly concentrated in the following:
1. The short-term support area below: 3010-3000; secondly, the important defensive area for bulls is: 2975-2965.
2. The short-term resistance area above: 3040-3050; secondly, the important defensive area for bears is: 3070-3080.
This is the key area that we must pay attention to in the short-term, and it is also an important reference for our next short-term trading!
The trading strategy verification accuracy rate is more than 90%; one step ahead, exclusive access to trading strategies and real-time trading settings
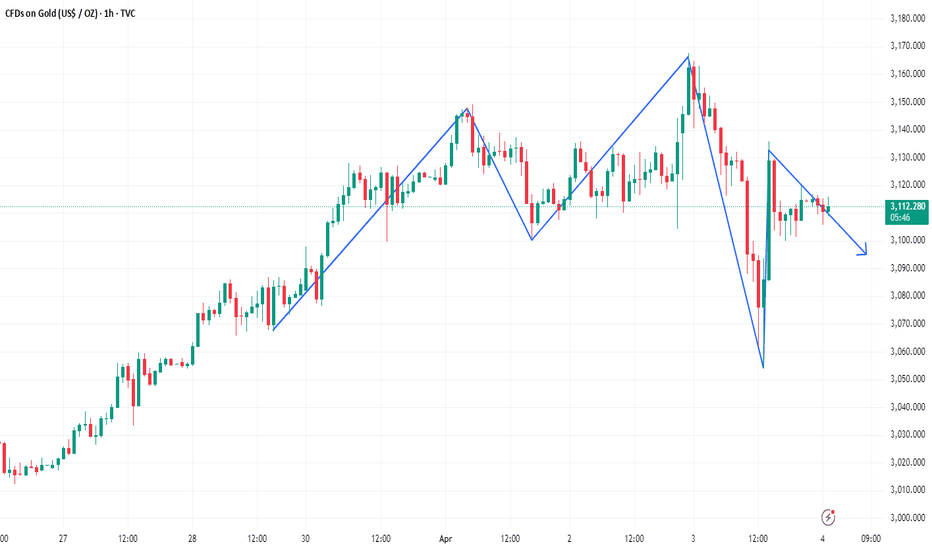
How will gold perform after the super rollercoaster market?Gold's 1-hour moving average still shows signs of turning downwards. Although gold bulls have made a strong counterattack, it is also because of the risk-aversion news that stimulated a retaliatory rebound. However, gold continued to fall after rising, and gold began to return to volatility. In the short term, gold is supported near 3100. If gold falls below the support near 3100 again, then gold shorts will still have an advantage in this war. Overall, the impact of today’s non-agricultural data is expected to be dim. What is more important is the stimulation of the news. However, it may be noted that if gold holds the 3100 mark for a long time, then gold is expected to fluctuate upward above 3100.
Trading idea: short gold near 3115, stop loss 3125, target 3100
The above is purely a sharing of personal views and does not constitute trading advice. Investments are risky and you are responsible for your profits and losses.
XAUUSD: Buy or Sell?Today's gold market can be said to have the largest intraday volatility since 2025! After experiencing violent fluctuations, the current trend of gold has once again become anxious.
However, from the perspective of range conversion, it is certain that gold is currently operating in a weak position, and after the brutal and violent fluctuations, the market also needs to recuperate. And there will be NFP tomorrow. It is expected that before NFP, it will be difficult for gold to form a new unilateral market again. So in the process of shock, I think both long and short sides have a certain profit space.
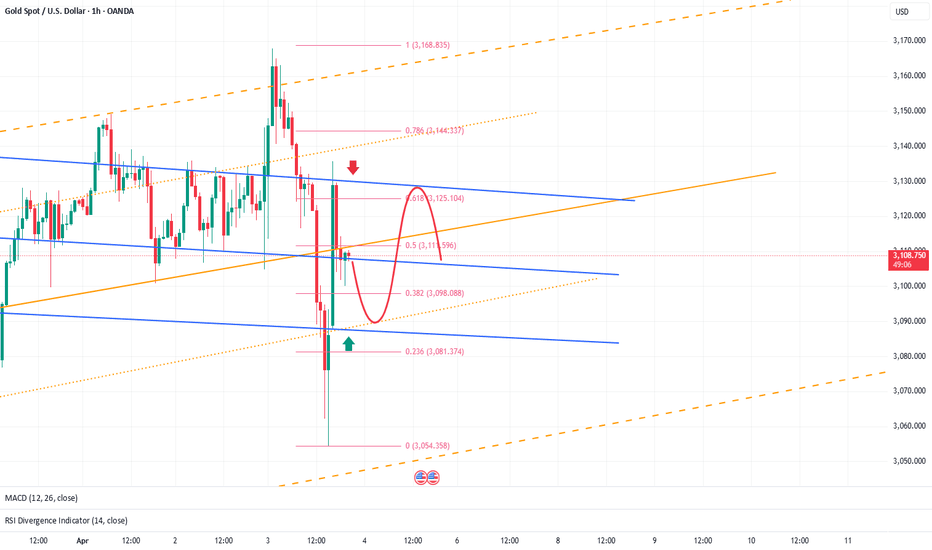
First of all, pay attention to the resistance of 3125-3135 area on the top. If gold touches this area during the shock process, we can still short gold;
And the first focus on the 3095-3085 area on the bottom is that if gold touches this area during the shock process, we can still consider going long on gold.
The trading strategy verification accuracy rate is more than 90%; one step ahead, exclusive access to trading strategies and real-time trading settings
Continue to short gold after the rebound!Although gold did not fall due to the negative impact of ADP data, this does not mean that the risk of gold falling has been eliminated. As long as gold does not break through the recent highs, and in the fluctuations in recent days, the resistance strength of the 3135-3145 zone has been strengthened, gold still has a considerable risk of falling before breaking through the resistance area, and once gold falls below the 3110-3100 zone, it is bound to retreat to the 3095-3085 zone!
The trading strategy verification accuracy rate is more than 90%; one step ahead, exclusive access to trading strategies and real-time trading settings
Gold Under Pressure In Head And Shoulders PatternGold's 1-hour moving average has gradually begun to show signs of turning, and gold's 1-hour moving average is also in the form of a head and shoulders. Even if it pulls back and forth again, gold will continue to fluctuate in a wide range. There are more data in the second half of this week, and there is news about important events, so gold still needs to wait for news or data to take gold out of a new direction.
Trading ideas: short gold around 3130, sl: 3140, tp: 3115
The above is purely a personal opinion sharing. Investment involves risks and you are responsible for your profits and losses.
A rebound is a good opportunity to short goldGold rebounds from 3100, but is the bullish momentum truly revived?
I don’t see it that way. Yesterday’s retracement to 3100 has already weakened the strong bullish structure to some extent, with 3150 likely acting as a key resistance level. I believe the current rebound is merely a technical retest of the 3150 zone, reinforcing it as a potential cycle high and paving the way for a double-top formation, which could provide a bearish technical setup for further downside.
Following the initial 3100 test, a second retest of this support level is likely. If gold fails to hold 3100 on the second attempt, a break lower towards 3095-3085 would become increasingly probable.
I will continue to scale into short positions within the 3132-3142 zone, with an initial target of 3120-3110. If gold approaches 3100, I will closely monitor the price action to assess the likelihood of a further breakdown.
The trading strategy verification accuracy rate is more than 90%; one step ahead, exclusive access to trading strategies and real-time trading settings
Continue to short gold, there is still huge downside potentialGold fell below the short-term key support of 3120 and extended to around 3100. The short-term raid caught most long traders off guard. Today, I evaluated from both market factors and risk factors, and made a plan to short gold in the 3135-3145 zone, with the goal of a pullback to 3100. The potential profit space is $50. I believe that as long as you pay attention to and follow my trading strategy, you will definitely make a lot of money today!
At present, gold has rebounded slightly after touching around 3100, but I do not recommend going long on gold in this position area; because a sharp drop in gold can easily hit the confidence of long traders, stimulate profit-taking and panic selling, so I think the decline is not over.
Even from a technical perspective, although gold has a certain degree of technical repair after a rapid decline, it is obvious that the 4-hour level has not started to make up for the decline, indicating that there is still a lot of room for correction below. In this round of decline, I think gold is likely to continue to fall to the area around 3085, or even the 3075-3065 zone.
Therefore, for short-term trading, we can still consider shorting gold in batches after it rebounds to the 3115-3125 zone, with the target pointing to the 3095-3085 zone.The trading strategy verification accuracy rate is more than 90%; one step ahead, exclusive access to trading strategies and real-time trading settings
Gold Investors Beware: Bears Are Quietly AssemblingGold’s candlestick chart has displayed multiple upper shadows above the 3025-3030 zone, widely regarded as a clear rejection signal. With repeated failures to break through this resistance, gold is showing signs of forming a potential short-term top. This not only caps the upside but could also act as a key indicator of a possible bearish reversal.
Following the Asian session's opening, gold experienced a slight gap up but failed to sustain its momentum, maintaining a range-bound movement instead. The lack of strong bullish follow-through reflects weak buying interest.
Additionally, recent statements from Trump suggest a softened stance on tariff policies, with his rhetoric appearing less aggressive. If the tariffs are implemented in a more moderate manner or market reactions are less severe than anticipated, risk-off sentiment could subside, leading to a significant pullback in gold prices.
But given the presence of strong buying interest and bullish sentiment consolidation, expectations for an extensive decline remain limited. The primary support to monitor lies in the 3110-3100 range. If gold break below this zone, it may trigger an accelerated drop, with the next downside target at the 3095-3085 region.
The trading strategy verification accuracy rate is more than 90%; one step ahead, exclusive access to trading strategies and real-time trading settings
You can't make money from such a simple market?After gold stepped back, it hit a new high again. Gold bulls continued to be strong. Gold broke through 3127 again, so the bulls are even better.
The gold 1-hour moving average continues to cross upwards and diverges. The support of the gold 1-hour moving average has moved up to 3096, but gold is now far away from the moving average, so wait patiently for adjustments and then step back to continue to buy. The gold 1-hour lowest yesterday fell to around 3100 and then stabilized again, so today gold will continue to buy on dips above 3100.
Trading ideas for reference:
Go long near gold 3110, sl: 3100, tp: 3130
Good news for bears, gold will fall back to 3095-3085Driven by Trump’s tariff policies and geopolitical risks, gold has sustained a strong upward trajectory. However, after reaching around 3128, its momentum has visibly slowed, with multiple signs of pullbacks emerging within the short-term structure.
From the candlestick chart, it’s evident that gold has faced repeated rejection signals above 3125, characterized by long upper shadows. The 3125 level has now formed a notable resistance zone and appears to be acting as a short-term consolidation high. This price action increases the likelihood of a potential top formation.
Moreover, gold’s recent strength is largely attributed to growing concerns of a global trade war sparked by Trump’s tariff policies, prompting investors to rotate out of risk assets like equities and into safe-haven assets such as gold. However, if Trump softens his stance on the tariffs or adopts a more diplomatic approach to maintain confidence in the U.S. dollar, risk appetite may recover. This would likely drive funds back into equities and other risk assets, leading to an outflow from gold.
For gold trading, I prefer to avoid aggressively chasing long positions at this stage, as downside risks persist. If gold fails to decisively break through the 3125-3135 resistance zone, the bullish momentum may weaken, increasing the likelihood of a downward move. If gold break below the 3100 level during a pullback, it could accelerate further declines, with potential targets in the 3095-3085 range.
The trading strategy verification accuracy rate is more than 90%; one step ahead, exclusive access to trading strategies and real-time trading settings
Gold is crazy. When will it peak?Gold has experienced a wave of rapid declines and market washouts. It successfully made many people get off the market with one move, and then it continued to rise all the way. It is really strong.
At present, it seems that gold is getting closer and closer to the top, but you can still take advantage of the pullback to make long orders, but you must not stay in the long term.
At present, gold is getting closer and closer to the top, but you can still take advantage of the correction to go long, but don't be a long-term investor. Gold can take advantage of the trend to take long positions above 3100


