XAU/USD 16-20 June 2025 Weekly AnalysisWeekly Analysis:
Swing Structure -> Bullish.
Internal Structure -> Bullish.
Analysis and bias remains the same as analysis dated 16 March 2025.
In my analysis dated 27 October 2024 I mentioned (below) that price could potentially print higher-highs in order to reposition CHoCH. This is exactly how price printed. CHoCH positioning has been brought significantly closer to current price action. CHoCH positioning is denoted with a shortened blue dotted horizontal line.
The remainder of my analysis and bias remains the same as analysis dated 09 February 2025.
Price has printed a further bullish iBOS.
Price is currently trading within an internal low and fractal high. CHoCH positioning is denoted with a blue dashed line.
Price Action Analysis:
In my analysis dated 27 October 2024, it was noted that the first sign of a pullback would be a bearish Change of Character (CHoCH), indicated by a blue dotted line. Price's consistent upward momentum had repositioned previous CHoCH much closer to recent price levels as expected for weeks. Current CHoCH positioning is quite a distance away from price, therefore, it would be viable if price continued bullish to reposition ChOCH.
Note:
It is highly unlikely price will "crash" as many analysts are predicting. My view is this is merely a corrective wave of the primary trend.
Given the Federal Reserve's dovish policy stance alongside heightened geopolitical risks, market volatility is likely to remain elevated, influencing intraday price swings.
Price could also be driven by President Trump's policies, geopolitical moves and economic decisions which are sparking uncertainty and potential repricing of Gold.
Weekly Chart:
Daily Analysis:
Swing -> Bullish.
Internal -> Bullish.
Analysis and Bias remains the same as Analysis dated 11 May 2025.
Since my last weekly analysis price has finally printed a bearish CHoCH.
This is the first indication, but not confirmation of bearish pullback phase initiation.
Price is now trading within an established internal range.
Price should now technically trade down to either discount of 50% internal EQ, or Daily demand zone before targeting weak internal high, priced at 3,500.200.
Note:
The Federal Reserve’s continued dovish stance, coupled with escalating geopolitical uncertainties, is expected to sustain elevated market volatility, influencing both intraday and broader trend developments.
Additionally, price action may be further shaped by U.S. policy decisions, including measures enacted under President Trump. Shifts in geopolitical strategy and economic policymaking could introduce further uncertainty, contributing to the ongoing repricing dynamics within the gold market.
Daily Chart:
H4 Analysis:
-> Swing: Bullish.
-> Internal: Bullish.
Analysis and bias remains the same as analysis dated 23 April 2025
Price has now printed a bearish CHoCH according to my analysis yesterday.
Price is now trading within an established internal range.
Intraday Expectation:
Price to trade down to either discount of internal 50% EQ, or H4 demand zone before targeting weak internal high priced at 3,500.200.
Note:
The Federal Reserve’s sustained dovish stance, coupled with ongoing geopolitical uncertainties, is likely to prolong heightened volatility in the gold market. Given this elevated risk environment, traders should exercise caution and recalibrate risk management strategies to navigate potential price fluctuations effectively.
Additionally, gold pricing remains sensitive to broader macroeconomic developments, including policy decisions under President Trump. Shifts in geopolitical strategy and economic directives could further amplify uncertainty, contributing to market repricing dynamics.
H4 Chart:
Xauusdweekly

XAU/USD 09-13 June 2025 Weekly AnalysisWeekly Analysis:
Swing Structure -> Bullish.
Internal Structure -> Bullish.
Analysis and bias remains the same as analysis dated 16 March 2025.
In my analysis dated 27 October 2024 I mentioned (below) that price could potentially print higher-highs in order to reposition CHoCH. This is exactly how price printed. CHoCH positioning has been brought significantly closer to current price action. CHoCH positioning is denoted with a shortened blue dotted horizontal line.
The remainder of my analysis and bias remains the same as analysis dated 09 February 2025.
Price has printed a further bullish iBOS.
Price is currently trading within an internal low and fractal high. CHoCH positioning is denoted with a blue dashed line.
Price Action Analysis:
In my analysis dated 27 October 2024, it was noted that the first sign of a pullback would be a bearish Change of Character (CHoCH), indicated by a blue dotted line. Price's consistent upward momentum had repositioned previous CHoCH much closer to recent price levels as expected for weeks. Current CHoCH positioning is quite a distance away from price, therefore, it would be viable if price continued bullish to reposition ChOCH.
Note:
It is highly unlikely price will "crash" as many analysts are predicting. My view is this is merely a corrective wave of the primary trend.
Given the Federal Reserve's dovish policy stance alongside heightened geopolitical risks, market volatility is likely to remain elevated, influencing intraday price swings.
Price could also be driven by President Trump's policies, geopolitical moves and economic decisions which are sparking uncertainty and potential repricing of Gold.
Weekly Chart:
Daily Analysis:
Swing -> Bullish.
Internal -> Bullish.
Analysis and Bias remains the same as Analysis dated 11 May 2025.
Since my last weekly analysis price has finally printed a bearish CHoCH.
This is the first indication, but not confirmation of bearish pullback phase initiation.
Price is now trading within an established internal range.
Price should now technically trade down to either discount of 50% internal EQ, or Daily demand zone before targeting weak internal high, priced at 3,500.200.
Note:
The Federal Reserve’s continued dovish stance, coupled with escalating geopolitical uncertainties, is expected to sustain elevated market volatility, influencing both intraday and broader trend developments.
Additionally, price action may be further shaped by U.S. policy decisions, including measures enacted under President Trump. Shifts in geopolitical strategy and economic policymaking could introduce further uncertainty, contributing to the ongoing repricing dynamics within the gold market.
Daily Chart:
H4 Analysis:
-> Swing: Bullish.
-> Internal: Bullish.
Analysis and bias remains the same as analysis dated 23 April 2025
Price has now printed a bearish CHoCH according to my analysis yesterday.
Price is now trading within an established internal range.
Intraday Expectation:
Price to trade down to either discount of internal 50% EQ, or H4 demand zone before targeting weak internal high priced at 3,500.200.
Note:
The Federal Reserve’s sustained dovish stance, coupled with ongoing geopolitical uncertainties, is likely to prolong heightened volatility in the gold market. Given this elevated risk environment, traders should exercise caution and recalibrate risk management strategies to navigate potential price fluctuations effectively.
Additionally, gold pricing remains sensitive to broader macroeconomic developments, including policy decisions under President Trump. Shifts in geopolitical strategy and economic directives could further amplify uncertainty, contributing to market repricing dynamics.
H4 Chart:

XAU/USD 02-06 June 2025 Intraday AnalysisWeekly Analysis:
Swing Structure -> Bullish.
Internal Structure -> Bullish.
Analysis and bias remains the same as analysis dated 16 March 2025.
In my analysis dated 27 October 2024 I mentioned (below) that price could potentially print higher-highs in order to reposition CHoCH. This is exactly how price printed. CHoCH positioning has been brought significantly closer to current price action. CHoCH positioning is denoted with a shortened blue dotted horizontal line.
The remainder of my analysis and bias remains the same as analysis dated 09 February 2025.
Price has printed a further bullish iBOS.
Price is currently trading within an internal low and fractal high. CHoCH positioning is denoted with a blue dashed line.
Price Action Analysis:
In my analysis dated 27 October 2024, it was noted that the first sign of a pullback would be a bearish Change of Character (CHoCH), indicated by a blue dotted line. Price's consistent upward momentum had repositioned previous CHoCH much closer to recent price levels as expected for weeks. Current CHoCH positioning is quite a distance away from price, therefore, it would be viable if price continued bullish to reposition ChOCH.
Note:
It is highly unlikely price will "crash" as many analysts are predicting. My view is this is merely a corrective wave of the primary trend.
Given the Federal Reserve's dovish policy stance alongside heightened geopolitical risks, market volatility is likely to remain elevated, influencing intraday price swings.
Price could also be driven by President Trump's policies, geopolitical moves and economic decisions which are sparking uncertainty and potential repricing of Gold.
Weekly Chart:
Daily Analysis:
Swing -> Bullish.
Internal -> Bullish.
Analysis and Bias remains the same as Analysis dated 11 May 2025.
Since my last weekly analysis price has finally printed a bearish CHoCH.
This is the first indication, but not confirmation of bearish pullback phase initiation.
Price is now trading within an established internal range.
Price should now technically trade down to either discount of 50% internal EQ, or Daily demand zone before targeting weak internal high, priced at 3,500.200.
Note:
The Federal Reserve’s continued dovish stance, coupled with escalating geopolitical uncertainties, is expected to sustain elevated market volatility, influencing both intraday and broader trend developments.
Additionally, price action may be further shaped by U.S. policy decisions, including measures enacted under President Trump. Shifts in geopolitical strategy and economic policymaking could introduce further uncertainty, contributing to the ongoing repricing dynamics within the gold market.
Daily Chart:
H4 Analysis:
-> Swing: Bullish.
-> Internal: Bullish.
Analysis and bias remains the same as analysis dated 23 April 2025
Price has now printed a bearish CHoCH according to my analysis yesterday.
Price is now trading within an established internal range.
Intraday Expectation:
Price to trade down to either discount of internal 50% EQ, or H4 demand zone before targeting weak internal high priced at 3,500.200.
Note:
The Federal Reserve’s sustained dovish stance, coupled with ongoing geopolitical uncertainties, is likely to prolong heightened volatility in the gold market. Given this elevated risk environment, traders should exercise caution and recalibrate risk management strategies to navigate potential price fluctuations effectively.
Additionally, gold pricing remains sensitive to broader macroeconomic developments, including policy decisions under President Trump. Shifts in geopolitical strategy and economic directives could further amplify uncertainty, contributing to market repricing dynamics.
H4 Chart:

XAU/USD 19-23 May 2025 Weekly AnalysisWeekly Analysis:
Swing Structure -> Bullish.
Internal Structure -> Bullish.
Analysis and bias remains the same as analysis dated 16 March 2025.
In my analysis dated 27 October 2024 I mentioned (below) that price could potentially print higher-highs in order to reposition CHoCH. This is exactly how price printed. CHoCH positioning has been brought significantly closer to current price action. CHoCH positioning is denoted with a shortened blue dotted horizontal line.
The remainder of my analysis and bias remains the same as analysis dated 09 February 2025.
Price has printed a further bullish iBOS.
Price is currently trading within an internal low and fractal high. CHoCH positioning is denoted with a blue dashed line.
Price Action Analysis:
In my analysis dated 27 October 2024, it was noted that the first sign of a pullback would be a bearish Change of Character (CHoCH), indicated by a blue dotted line. Price's consistent upward momentum had repositioned previous CHoCH much closer to recent price levels as expected for weeks. Current CHoCH positioning is quite a distance away from price, therefore, it would be viable if price continued bullish to reposition ChOCH.
Note:
It is highly unlikely price will "crash" as many analysts are predicting. My view is this is merely a corrective wave of the primary trend.
Given the Federal Reserve's dovish policy stance alongside heightened geopolitical risks, market volatility is likely to remain elevated, influencing intraday price swings.
Price could also be driven by President Trump's policies, geopolitical moves and economic decisions which are sparking uncertainty and potential repricing of Gold.
Weekly Chart:
Daily Analysis:
Swing -> Bullish.
Internal -> Bullish.
Analysis and Bias remains the same as Analysis dated 11 May 2025.
Since my last weekly analysis price has finally printed a bearish CHoCH.
This is the first indication, but not confirmation of bearish pullback phase initiation.
Price is now trading within an established internal range.
Price should now technically trade down to either discount of 50% internal EQ, or Daily demand zone before targeting weak internal high, priced at 3,500.200.
Note:
The Federal Reserve’s continued dovish stance, coupled with escalating geopolitical uncertainties, is expected to sustain elevated market volatility, influencing both intraday and broader trend developments.
Additionally, price action may be further shaped by U.S. policy decisions, including measures enacted under President Trump. Shifts in geopolitical strategy and economic policymaking could introduce further uncertainty, contributing to the ongoing repricing dynamics within the gold market.
Daily Chart:
H4 Analysis:
-> Swing: Bullish.
-> Internal: Bullish.
Analysis and bias remains the same as analysis dated 23 April 2025
Price has now printed a bearish CHoCH according to my analysis yesterday.
Price is now trading within an established internal range.
Intraday Expectation:
Price to trade down to either discount of internal 50% EQ, or H4 demand zone before targeting weak internal high priced at 3,500.200.
Note:
The Federal Reserve’s sustained dovish stance, coupled with ongoing geopolitical uncertainties, is likely to prolong heightened volatility in the gold market. Given this elevated risk environment, traders should exercise caution and recalibrate risk management strategies to navigate potential price fluctuations effectively.
Additionally, gold pricing remains sensitive to broader macroeconomic developments, including policy decisions under President Trump. Shifts in geopolitical strategy and economic directives could further amplify uncertainty, contributing to market repricing dynamics.
H4 Chart:

XAUUSD – Bullish Flag Breakout & Black curve Line | Target Gold (XAUUSD) is currently shaping a textbook bullish flag pattern on the daily chart, signaling a potential continuation of the strong uptrend that started late last year. This setup, when combined with the custom-drawn Black Mind Curve, provides a structured and disciplined approach for identifying entry, retest, stop loss, and profit targets. Let’s break it down in detail:
🔍 1. Flagpole: The Impulse Move
The rally from around $2,550 in December 2024 to nearly $3,330 in April 2025 formed a steep and aggressive uptrend, which now serves as the flagpole of our pattern.
This impulsive wave represents strong buying momentum and is the backbone of the entire bullish flag structure. It shows institutional interest and heavy volume participation in gold, likely driven by macroeconomic factors such as inflation hedging, USD weakness, or geopolitical uncertainty.
🔷 2. Bullish Flag: The Consolidation Zone
Following the peak, gold entered a consolidation phase, forming two parallel descending trendlines, indicating healthy profit-taking and temporary market indecision. This is not a reversal but rather a pause in the trend, often seen before the next leg higher.
This down-sloping consolidation resembles a flag pattern—a reliable bullish continuation formation where the price temporarily contracts before a breakout.
The flag pattern is still valid as long as price remains inside or breaks above the upper boundary with momentum.
📈 3. Breakout Signal and Retesting Level
As of now, price is testing the upper boundary of the flag. A bullish breakout is anticipated once price closes above the $3,300–$3,350 resistance zone.
Following the breakout, a pullback to retest this same level is expected, forming a new support zone—a classic "breakout–retest–rally" setup.
💡 Retest Zone:
$3,300 to $3,350
This is your key zone to watch for confirmation. A bounce here could offer the best risk-reward entry.
🛡️ 4. Stop Loss Placement: Protecting Your Capital
To manage risk effectively, the stop loss should be placed below the lower boundary of the flag, and ideally just under the psychological round number at $2,970.
This protects your trade from a false breakout or sudden trend reversal while keeping the risk/reward ratio favorable.
🎯 5. Target Projection: Measured Move Strategy
We use the height of the flagpole (approximately $750) and project it upward from the breakout point to estimate the target price.
📌 Target Level:
$4,318 (approx.)
This aligns with technical confluence and psychological resistance above the $4,300 level.
If momentum remains strong and the macro environment continues to support gold prices, this level is a very realistic short-to-medium-term target.
🧠 6. The Black Mind Curve: A Unique Trend Framework
The chart features a custom “Black Mind Curve”, a smooth parabolic line following the overall trend structure. This curve acts as a visual guide for trend strength, suggesting that gold is respecting a higher time frame uptrend trajectory.
It helps reinforce that the bullish structure is still intact—even during short-term pullbacks—by mapping the psychological rhythm of market participants.
This curve is especially useful for swing traders who need to maintain conviction during consolidations.
🧠 Trading Psychology (Mind Framework):
"Charts show the facts; your mind interprets the truth."
Here’s the psychological approach for this trade:
Recognize the Setup: Bullish flag is forming—observe, don’t rush.
Wait for Confirmation: Let price break out and retest—avoid FOMO.
Act on Logic: Enter with defined stop and target—keep emotions out.
Stay Disciplined: Don’t move stop loss irrationally—trust your setup.
Let the Market Work: Once the trade is active, manage it calmly.
🔁 Summary of Trade Plan:
✅ Entry: On confirmed breakout and successful retest of $3,300–$3,350
✅ Stop Loss: Below $2,970
✅ Target: $4,318
✅ Pattern Type: Bullish Flag + Trend Curve Support
✅ Risk-Reward Ratio: ~1:3+ (Ideal setup)
📝 Final Thoughts:
This is a high-probability bullish continuation pattern supported by strong technical structure and psychological market behavior. The breakout is likely to attract institutional flows, especially if it aligns with fundamental tailwinds like falling interest rates or rising inflation.
Stay patient, wait for the retest confirmation, and trade with discipline. Gold is poised for a potential new leg higher—and this setup provides a structured roadmap to ride that move confidently.

GOLD📊 XAU/USD Weekly Analysis
📅 May 18, 2025
🔍 Key Levels:
▫️ Sell Zone: $3330-3367
▫️ Major Resistance: $3415
▫️ Current Price: $3203
▫️ Target: $2956
⚡️ Scenario:
• Wait for pullback to sell zone
• Sell ONLY with confirmation
⚠️ Warning:
• US rating cut (Moody's) → Potential bullish gap Monday
📌 Risk Management:
• Stop Loss: $3380
• Max Risk: 1% capital

XAU/USD 12-16 May 2025 Weekly AnalysisWeekly Analysis:
Swing Structure -> Bullish.
Internal Structure -> Bullish.
Analysis and bias remains the same as analysis dated 16 March 2025.
In my analysis dated 27 October 2024 I mentioned (below) that price could potentially print higher-highs in order to reposition CHoCH. This is exactly how price printed. CHoCH positioning has been brought significantly closer to current price action. CHoCH positioning is denoted with a shortened blue dotted horizontal line.
The remainder of my analysis and bias remains the same as analysis dated 09 February 2025.
Price has printed a further bullish iBOS.
Price is currently trading within an internal low and fractal high. CHoCH positioning is denoted with a blue dashed line.
Price Action Analysis:
In my analysis dated 27 October 2024, it was noted that the first sign of a pullback would be a bearish Change of Character (CHoCH), indicated by a blue dotted line. Price's consistent upward momentum had repositioned previous CHoCH much closer to recent price levels as expected for weeks. Current CHoCH positioning is quite a distance away from price, therefore, it would be viable if price continued bullish to reposition ChOCH.
Note:
It is highly unlikely price will "crash" as many analysts are predicting. My view is this is merely a corrective wave of the primary trend.
Given the Federal Reserve's dovish policy stance alongside heightened geopolitical risks, market volatility is likely to remain elevated, influencing intraday price swings.
Price could also be driven by President Trump's policies, geopolitical moves and economic decisions which are sparking uncertainty and potential repricing of Gold.
Weekly Chart:
Daily Analysis:
Swing -> Bullish.
Internal -> Bullish.
Since my last weekly analysis price has finally printed a bearish CHoCH.
This is the first indication, but not confirmation of bearish pullback phase initiation.
Price is now trading within an established internal range.
Price should now technically trade down to either discount of 50% internal EQ, or Daily demand zone before targeting weak internal high, priced at 3,500.200.
Note:
The Federal Reserve’s continued dovish stance, coupled with escalating geopolitical uncertainties, is expected to sustain elevated market volatility, influencing both intraday and broader trend developments.
Additionally, price action may be further shaped by U.S. policy decisions, including measures enacted under President Trump. Shifts in geopolitical strategy and economic policymaking could introduce further uncertainty, contributing to the ongoing repricing dynamics within the gold market.
Daily Chart:
H4 Analysis:
-> Swing: Bullish.
-> Internal: Bullish.
Analysis and bias remains the same as analysis dated 23 April 2025
Price has now printed a bearish CHoCH according to my analysis yesterday.
Price is now trading within an established internal range.
Intraday Expectation:
Price to trade down to either discount of internal 50% EQ, or H4 demand zone before targeting weak internal high priced at 3,500.200.
Note:
The Federal Reserve’s sustained dovish stance, coupled with ongoing geopolitical uncertainties, is likely to prolong heightened volatility in the gold market. Given this elevated risk environment, traders should exercise caution and recalibrate risk management strategies to navigate potential price fluctuations effectively.
Additionally, gold pricing remains sensitive to broader macroeconomic developments, including policy decisions under President Trump. Shifts in geopolitical strategy and economic directives could further amplify uncertainty, contributing to market repricing dynamics.
H4 Chart:

XAU/USD 28 April - 02 May 2025 Weekly AnalysisWeekly Analysis:
Swing Structure -> Bullish.
Internal Structure -> Bullish.
Analysis and bias remains the same as analysis dated 16 March 2025.
In my analysis dated 27 October 2024 I mentioned (below) that price could potentially print higher-highs in order to reposition CHoCH. This is exactly how price printed. CHoCH positioning has been brought significantly closer to current price action. CHoCH positioning is denoted with a shortened blue dotted horizontal line.
The remainder of my analysis and bias remains the same as analysis dated 09 February 2025.
Price has printed a further bullish iBOS.
Price is currently trading within an internal low and fractal high. CHoCH positioning is denoted with a blue dashed line.
Price Action Analysis:
In my analysis dated 27 October 2024, it was noted that the first sign of a pullback would be a bearish Change of Character (CHoCH), indicated by a blue dotted line. Price's consistent upward momentum had repositioned previous CHoCH much closer to recent price levels as expected for weeks. Current CHoCH positioning is quite a distance away from price, therefore, it would be viable if price continued bullish to reposition ChOCH.
Note:
It is highly unlikely price will "crash" as many analysts are predicting. My view is this is merely a corrective wave of the primary trend.
Given the Federal Reserve's dovish policy stance alongside heightened geopolitical risks, market volatility is likely to remain elevated, influencing intraday price swings.
Price could also be driven by President Trump's policies, geopolitical moves and economic decisions which are sparking uncertainty and potential repricing of Gold.
Weekly Chart:
Daily Analysis:
Swing -> Bullish.
Internal -> Bullish.
Since my last weekly analysis price has printed a
further bullish iBOS.
Price is now trading within an internal low and fractal high.
CHoCH positioning is denoted with a shortened blue horizontal dotted line.
First indication, but not confirmation of bearish pullback phase initiation is for price to print bearish CHoCH.
Note:
With the Fed maintaining a dovish policy stance and the continued rise in geopolitical tensions, we should anticipate elevated market volatility, which may impact both intraday and longer-term price action.
Price could also be driven by President Trump's policies, geopolitical moves and economic decisions which are sparking uncertainty and the repricing of Gold.
Daily Chart:
H4 Analysis:
-> Swing: Bullish.
-> Internal: Bullish.
Analysis and bias remains the same as analysis dated 23 April 2025
Price has now printed a bearish CHoCH according to my analysis yesterday.
Price is now trading within an established internal range.
Intraday Expectation:
Price to trade down to either discount of internal 50% EQ, or H4 demand zone before targeting weak internal high priced at 3,500.200.
Note:
With the Federal Reserve's dovish stance and persisting geopolitical uncertainties, heightened volatility in Gold is expected to continue. Traders should proceed with caution and adjust risk management strategies in this high-volatility environment.
Price could also be driven by President Trump's policies, geopolitical moves and economic decisions which are sparking uncertainty.
H4 Chart:

XAU-USD 07-11 April 2025 Weekly AnalysisWeekly Analysis:
Swing Structure -> Bullish.
Internal Structure -> Bullish.
Analysis and bias remains the same as analysis dated 16 March 2025.
In my analysis dated 27 October 2024 I mentioned (below) that price could potentially print higher in order to reposition CHoCH. This is exactly how price printed. CHoCH positioning has been brought significantly closer to current price action.
The remainder of my analysis and bias remains the same as analysis dated 09 February 2025.
Price has printed a further bullish iBOS.
Price is currently trading within an internal low and fractal high. CHoCH positioning is denoted with a blue dashed line.
Price Action Analysis:
In my analysis dated 27 October 2024, it was noted that the first sign of a pullback would be a bearish Change of Character (CHoCH), indicated by a blue dotted line. Price's consistent upward momentum had repositioned previous CHoCH much closer to recent price levels as expected for weeks. Current CHoCH positioning is quite a distance away from price, therefore, it would be viable if price continued bullish to reposition ChOCH.
Note:
It is highly unlikely price will "crash" as many analysts are predicting. My view is this is merely a corrective wave of the primary trend.
Given the Federal Reserve's dovish policy stance alongside heightened geopolitical risks, market volatility is likely to remain elevated, influencing intraday price swings.
Price could also be driven by President Trump's policies, geopolitical moves and economic decisions which are sparking uncertainty.
Weekly Chart:
Daily Analysis:
Swing -> Bullish.
Internal -> Bullish.
Price continued bullish repositioning bearish CHoCH positioning closer to current price action.
Price is now trading within an internal low and fractal high.
Price has very nearly printed a bearish which is the first indication, but not confirmation, of bearish pullback phase initiation.
Expectation is for price to print bearish CHoCH to indicate, bearish pullback phase initiation. CHoCH positioning is denoted with a blue dotted line.
Note:
With the Fed maintaining a dovish policy stance and the continued rise in geopolitical tensions, we should anticipate elevated market volatility, which may impact both intraday and longer-term price action.
Price could also be driven by President Trump's policies, geopolitical moves and economic decisions which are sparking uncertainty and the repricing of Gold.
Daily Chart:
H4 Analysis:
-> Swing: Bullish.
-> Internal: Bullish.
Analysis and bias remains the same as analysis dated 04 April 2025.
Since last analysis price has printed a bearish CHoCH which is the first indication, but not confirmation of bearish pullback phase initiation.
Price is now trading within an established internal range.
Intraday Expectation:
Price to trade down to either discount of internal 50% EQ, or H4 demand zone before targeting weak internal high priced at 3,187,835
Note:
With the Federal Reserve's dovish stance and persisting geopolitical uncertainties, heightened volatility in Gold is expected to continue. Traders should proceed with caution and adjust risk management strategies in this high-volatility environment.
Price could also be driven by President Trump's policies, geopolitical moves and economic decisions which are sparking uncertainty.
H4 Chart:

XAU/USD 24-28 March 2025 Weekly AnalysisWeekly Analysis:
Swing Structure -> Bullish.
Internal Structure -> Bullish.
Analysis and bias remains the same as analysis dated 16 March 2025.
In my analysis dated 27 October 2024 I mentioned (below) that price could potentially print higher in order to reposition CHoCH. This is exactly how price printed. CHoCH positioning has been brought significantly closer to current price action.
The remainder of my analysis and bias remains the same as analysis dated 09 February 2025.
Price has printed a further bullish iBOS.
Price is currently trading within an internal low and fractal high. CHoCH positioning is denoted with a blue dashed line.
Price Action Analysis:
In my analysis dated 27 October 2024, it was noted that the first sign of a pullback would be a bearish Change of Character (CHoCH), indicated by a blue dotted line. Price's consistent upward momentum had repositioned previous CHoCH much closer to recent price levels as expected for weeks. Current CHoCH positioning is quite a distance away from price, therefore, it would be viable if price continued bullish to reposition CHOCH.
Note:
It is highly unlikely price will "crash" as many analysts are predicting. My view is this is merely a corrective wave of the primary trend.
Given the Federal Reserve's dovish policy stance alongside heightened geopolitical risks, market volatility is likely to remain elevated, influencing intraday price swings.
Price could also be driven by President Trump's policies, geopolitical moves and economic decisions which are sparking uncertainty.
Weekly Chart:
Daily Analysis:
Swing -> Bullish.
Internal -> Bullish.
Price continued bullish repositioning bearish CHoCH positioning closer to current price action.
Price is now trading within an internal low and fractal high.
Expectation is for price to print bearish CHoCH to indicate, but not confirm bearish pullback phase initiation. CHoCH positioning is denoted with a blue dotted line.
Note:
With the Fed maintaining a dovish policy stance and the continued rise in geopolitical tensions, we should anticipate elevated market volatility, which may impact both intraday and longer-term price action.
Price could also be driven by President Trump's policies, geopolitical moves and economic decisions which are sparking uncertainty and the repricing of Gold.
Daily Chart:
H4 Analysis:
-> Swing: Bullish.
-> Internal: Bullish.
Analysis and bias remains the same as analysis dated 21 March 2025.
Price has printed a bearish CHoCH following printing further all time highs.
Price is now trading within an established internal range. I will however continue to monitor price.
Intraday Expectation:
Price to trade down to either discount of internal 50% EQ, or nested Daily and H4 demand levels before targeting weak internal high priced at 3,057.590.
Note:
With the Federal Reserve's dovish stance and persisting geopolitical uncertainties, heightened volatility in Gold is expected to continue. Traders should proceed with caution and adjust risk management strategies in this high-volatility environment.
Price could also be driven by President Trump's policies, geopolitical moves and economic decisions which are sparking uncertainty.
H4 Chart:

XAU/USD 17-21 March 2025 Weekly AnalysisWeekly Analysis:
Swing Structure -> Bullish.
Internal Structure -> Bullish.
In my analysis dated 27 October 2024 I mentioned (below) that price could potentially print higher in order to reposition CHoCH. This is exactly how price printed. CHoCH positioning has been brought significantly closer to current price action.
The remainder of my analysis and bias remains the same as analysis dated 09 February 2025.
Price has printed a further bullish iBOS.
Price is currently trading within an internal low and fractal high. CHoCH positioning is denoted with a blue dashed line.
Price Action Analysis:
In my analysis dated 27 October 2024, it was noted that the first sign of a pullback would be a bearish Change of Character (CHoCH), indicated by a blue dotted line. Price's consistent upward momentum had repositioned previous CHoCH much closer to recent price levels as expected for weeks. Current CHoCH positioning is quite a distance away from price, therefore, it would be viable if price continued bullish to reposition ChOCH.
Note:
It is highly unlikely price will "crash" as many analysts are predicting. My view is this is merely a corrective wave of the primary trend.
Given the Federal Reserve's dovish policy stance alongside heightened geopolitical risks, market volatility is likely to remain elevated, influencing intraday price swings.
Price could also be driven by President Trump's policies, geopolitical moves and economic decisions which are sparking uncertainty.
Weekly Chart:
Daily Analysis:
Swing -> Bullish.
Internal -> Bullish.
Price printed as per analysis dated 16 February 2025 by price targeting weak internal high priced at 2,956.310. However, The pullback was not substantial. Nonetheless, due to time spent I will classify this as an iBOS.
Price is now trading within an internal low and fractal high.
Expectation is for price to print bearish CHoCH to indicate, but not confirm bearish pullback phase initiation. CHoCH positioning is denoted with a blue dotted line.
Note:
With the Fed maintaining a dovish policy stance and the continued rise in geopolitical tensions, we should anticipate elevated market volatility, which may impact both intraday and longer-term price action.
Price could also be driven by President Trump's policies, geopolitical moves and economic decisions which are sparking uncertainty and the repricing of Gold.
Daily Chart:
H4 Analysis:
-> Swing: Bullish.
-> Internal: Bullish.
Previous analysis and bias was not met as price did not target weak internal low.
Price has printed a bullish iBOS followed by a bearish CHoCH.
Price is currently trading within an established internal range.
Intraday Expectation:
Price to either trade down to discount of 50% internal EQ, or Daily/H4 demand zone before targeting weak internal high priced at
Note:
With the Federal Reserve's dovish stance and persisting geopolitical uncertainties, heightened volatility in Gold is expected to continue. Traders should proceed with caution and adjust risk management strategies in this high-volatility environment.
Price could also be driven by President Trump's policies, geopolitical moves and economic decisions which are sparking uncertainty.
H4 Chart:

XAU/USD 10-14 March 2025 Weekly AnalysisWeekly Analysis:
Swing Structure -> Bullish.
Internal Structure -> Bullish.
Analysis and bias remains the same as analysis dated 09 February 2025.
Price has printed a further bullish iBOS.
Price is currently trading within an internal low and fractal high. CHoCH positioning is denoted with a blue dashed line.
Price Action Analysis:
In my analysis dated 27 October 2024, it was noted that the first sign of a pullback would be a bearish Change of Character (CHoCH), indicated by a blue dotted line. Price's consistent upward momentum had repositioned previous CHoCH much closer to recent price levels as expected for weeks. Current CHoCH positioning is quite a distance away from price, therefore, it would be viable if price continued bullish to reposition ChOCH.
Note:
It is highly unlikely price will "crash" as many analysts are predicting. My view is this is merely a corrective wave of the primary trend.
Given the Federal Reserve's dovish policy stance alongside heightened geopolitical risks, market volatility is likely to remain elevated, influencing intraday price swings.
Price could also be driven by President Trump's policies, geopolitical moves and economic decisions which are sparking uncertainty.
Weekly Chart:
Daily Analysis:
Swing -> Bullish.
Internal -> Bullish.
As per analysis dated 16 February 2025 price has printed a bearish CHoCH which indicates, but does not confirm, bearish pullback phase initiation
Price is now trading within an established internal range. I will however continue to monitor price and depth of pullback.
Expectation is for price to trade down to either discount of internal 50% EQ, or Daily demand zone before targeting weak internal high, priced at 2,956.310.
Note:
With the Fed maintaining a dovish policy stance and the continued rise in geopolitical tensions, we should anticipate elevated market volatility, which may impact both intraday and longer-term price action.
Price could also be driven by President Trump's policies, geopolitical moves and economic decisions which are sparking uncertainty.
Daily Chart:
H4 Analysis:
-> Swing: Bullish.
-> Internal: Bearish.
Analysis/Bias remains the same as analysis dated 07 March 2024.
Price has printed a bullish CHoCH according to analysis and bias dated 28 February 2025.
Price is currently trading within an established internal range.
Intraday Expectation:
Price is now trading in premium of 50% internal EQ where we could see a reaction at any point. Price could also target H4 supply zone before targeting weak internal low, priced at 2,832.720
Note:
With the Federal Reserve's dovish stance and persisting geopolitical uncertainties, heightened volatility in Gold is expected to continue. Traders should proceed with caution and adjust risk management strategies in this high-volatility environment.
Price could also be driven by President Trump's policies, geopolitical moves and economic decisions which are sparking uncertainty.
H4 Chart:

XAU/USD Daily Chart Analysis! Detailed ExplainationMarket Overview:
Gold (XAU/USD) is currently trading around $2,910, showing a slight decline of -0.05% on the daily timeframe. The market has been in a strong uptrend, breaking previous structures and forming higher highs and higher lows. However, the current price action suggests a potential pullback before another bullish continuation.
Key Technical Observations:
1. Resistance & Strong Resistance Zone ($2,950 - $3,000+)
The price has reached a strong resistance zone near the $3,000 psychological level, where selling pressure is evident.
A weak high has been marked, indicating that buyers may attempt to break this level, but sellers could push the price down before any significant breakout.
If price successfully closes above this resistance, it could trigger further bullish momentum towards $3,100 or higher.
2. Support and Demand Zone ($2,750 - $2,800)
The demand zone between $2,750 and $2,800 has historically acted as a strong support level.
This zone aligns with previous price accumulation and a key structural support level.
A pullback to this area could present buying opportunities, as institutional buyers may step in.
3. Market Structure and Breaks of Structure (BOS) & Change of Character (ChoCH)
Multiple Change of Character (ChoCH) points have been noted, signaling shifts in momentum.
The Break of Structure (BOS) suggests a continuation of the prevailing bullish trend, with minor corrections along the way.
The most recent ChoCH indicates a potential short-term bearish retracement before a continuation to the upside.
4. Strong Low and Potential Support Levels ($2,500 - $2,600)
The strong low is marked below $2,500, which acts as a long-term support zone.
If the demand zone at $2,750 - $2,800 fails, the next major support area lies around $2,600.
However, given the overall bullish trend, a drop to these levels would likely be short-lived unless macroeconomic factors shift significantly.
Potential Price Scenarios:
🔵 Bullish Scenario (Primary Outlook)
Price may retrace towards the $2,750 - $2,800 demand zone.
If buyers defend this level, we can expect a bullish reversal towards $2,950 - $3,000 resistance.
A strong breakout above $3,000 would likely trigger further upside momentum towards $3,100+.
🔴 Bearish Scenario (Alternative Outlook)
If sellers take control and push price below the $2,750 support, further downside could follow.
In this case, the next major support levels would be $2,600 - $2,650, where buyers may re-enter.
A breakdown below $2,500 would signal a shift in long-term market structure, invalidating the bullish trend.
Trading Plan & Strategy:
✅ For Long Entries:
Look for bullish price action (e.g., pin bars, bullish engulfing candles) in the $2,750 - $2,800 demand zone.
Target $2,950 - $3,000 as the first take-profit level.
If price breaks above $3,000, hold positions for a move towards $3,100 or higher.
❌ For Short Entries:
If price struggles to break above $3,000, short positions can be considered with stop losses above resistance.
Targets for short trades: $2,800 (first TP), $2,650 (second TP).
Final Thoughts About Trend:
Gold remains in a strong bullish trend, but a short-term retracement could be expected before the next rally. Traders should focus on key levels like $2,750 - $2,800 support and $3,000 resistance to confirm the next move. Watch for confirmation signals before entering trades. 📊🚀

XAU/USD 24-28 February 2025 Weekly AnalysisWeekly Analysis:
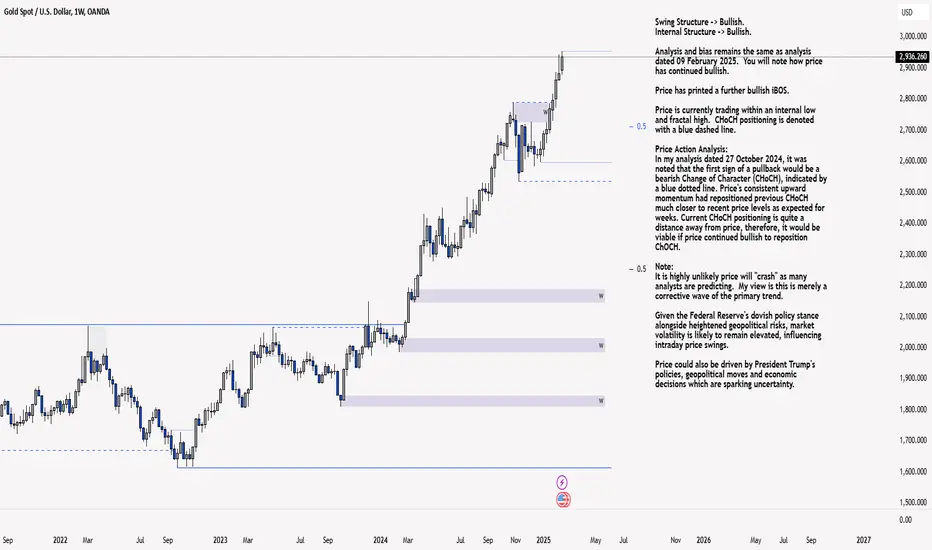
Swing Structure -> Bullish.
Internal Structure -> Bullish.
Analysis and bias remains the same as analysis dated 09 February 2025. You will note how price has continued bullish.
Price has printed a further bullish iBOS.
Price is currently trading within an internal low and fractal high. CHoCH positioning is denoted with a blue dashed line.
Price Action Analysis:
In my analysis dated 27 October 2024, it was noted that the first sign of a pullback would be a bearish Change of Character (CHoCH), indicated by a blue dotted line. Price's consistent upward momentum had repositioned previous CHoCH much closer to recent price levels as expected for weeks. Current CHoCH positioning is quite a distance away from price, therefore, it would be viable if price continued bullish to reposition ChOCH.
Note:
It is highly unlikely price will "crash" as many analysts are predicting. My view is this is merely a corrective wave of the primary trend.
Given the Federal Reserve's dovish policy stance alongside heightened geopolitical risks, market volatility is likely to remain elevated, influencing intraday price swings.
Price could also be driven by President Trump's policies, geopolitical moves and economic decisions which are sparking uncertainty.
Weekly Chart:
Daily Analysis:
Swing -> Bullish.
Internal -> Bullish.
Analysis and bias remains the same as last week's analysis dated 16 February 2025. You will note that CHoCH positioning has been brought closer to current price action. This allows for price to not pull back so deep to indicate bearish pullback phase initiation.
Since my last weekly analysis price has printed a bullish iBOS. Bias and analysis has been accurate over the last few months.
Price is now trading within a fractal high and internal low.
Bearish ChOCH positioning is denoted with a blue shorter dotted line and is very well positioned to print bearish CHoCH which is the very first indication, but not confirmation of bearish pullback phase initiation
Note:
With the Fed maintaining a dovish policy stance and the continued rise in geopolitical tensions, we should anticipate elevated market volatility, which may impact both intraday and longer-term price action.
Price could also be driven by President Trump's policies, geopolitical moves and economic decisions which are sparking uncertainty.
Daily Chart:
H4 Analysis:
-> Swing: Bullish.
-> Internal: Bullish.
Analysis and bias remains the same as analysis dated 21 February 2025.
Price printed as per yesterday's analysis and bias.
Price has printed a bearish CHocH indicating, but not confirming bearish pullback phase initiation.
Price is now trading within an established internal range.
Intraday Expectation:
Price to trade down to either discount of 50% internal EQ, or H4 demand zone before targeting weak internal high, priced at 2,954.955
Alternative scenario:
Given HTF (Daily and Weekly) have also printed bullish iBOS' it would not come as a surprise if price printed a bearish iBOS.
Note:
With the Federal Reserve's dovish stance and persisting geopolitical uncertainties, heightened volatility in Gold is expected to continue. Traders should proceed with caution and adjust risk management strategies in this high-volatility environment.
Price could also be driven by President Trump's policies, geopolitical moves and economic decisions which are sparking uncertainty.
H4 Chart:
XAU/USD 17-21 February 2025 Weekly AnalysisWeekly Analysis:
Swing Structure -> Bullish.
Internal Structure -> Bullish.
Analysis and bias remains the same as analysis dated 09 February 2025.
Price has printed a further bullish iBOS.
Price is currently trading within an internal low and fractal high. CHoCH positioning is denoted with a blue dashed line.
Price Action Analysis:
In my analysis dated 27 October 2024, it was noted that the first sign of a pullback would be a bearish Change of Character (CHoCH), indicated by a blue dotted line. Price's consistent upward momentum had repositioned previous CHoCH much closer to recent price levels as expected for weeks. Current CHoCH positioning is quite a distance away from price, therefore, it would be viable if price continued bullish to reposition ChOCH.
Note:
It is highly unlikely price will "crash" as many analysts are predicting. My view is this is merely a corrective wave of the primary trend.
Given the Federal Reserve's dovish policy stance alongside heightened geopolitical risks, market volatility is likely to remain elevated, influencing intraday price swings.
Price could also be driven by President Trump's policies, geopolitical moves and economic decisions which are sparking uncertainty.
Weekly Chart:
Daily Analysis:
Swing -> Bullish.
Internal -> Bullish.
Since my last weekly analysis price has printed a bullish iBOS. Bias and analysis has been accurate over the last few months.
Price is now trading within a fractal high and internal low.
Bearish ChOCH positioning is denoted with a blue shorter dotted line and is very well positioned to print bearish CHoCH which is the very first indication, but not confirmation of bearish pullback phase initiation
Note:
With the Fed maintaining a dovish policy stance and the continued rise in geopolitical tensions, we should anticipate elevated market volatility, which may impact both intraday and longer-term price action.
Price could also be driven by President Trump's policies, geopolitical moves and economic decisions which are sparking uncertainty.
Daily Chart:
H4 Analysis:
-> Swing: Bullish.
-> Internal: Bullish.
Analysis and bias remains the same as analysis dated 11 February 2025.
As mentioned in yesterday's analysis dated 10 February 2025 that it is highly likely price will print a bullish iBOS is how price printed.
Price is currently trading within an internal low and fractal high.
ChoCH positioning to indicate, but not confirm bearish pullback phase initiation is denoted with a blue dotted line.
Intraday Expectation:
Price to continue bearish and react at either discount of internal 50%, or H4 demand zone, before targeting weak internal high, priced at 2,942.780.
Alternative scenario:
Given HTF (Daily and Weekly) have also printed bullish iBOS' it would not come as a surprise if price printed a bearish iBOS.
Note:
With the Federal Reserve's dovish stance and persisting geopolitical uncertainties, heightened volatility in Gold is expected to continue. Traders should proceed with caution and adjust risk management strategies in this high-volatility environment.
Price could also be driven by President Trump's policies, geopolitical moves and economic decisions which are sparking uncertainty.
H4 Chart:

XAU/USD 10-14 February 2025 Weekly AnalysisWeekly Analysis:
Swing Structure -> Bullish.
Internal Structure -> Bullish.
Price has printed a further bullish iBOS.
Price is currently trading within an internal low and fractal high. CHoCH positioning is denoted with a blue dashed line.
Price Action Analysis:
In my analysis dated 27 October 2024, it was noted that the first sign of a pullback would be a bearish Change of Character (CHoCH), indicated by a blue dotted line. Price's consistent upward momentum had repositioned previous CHoCH much closer to recent price levels as expected for weeks. Current CHoCH positioning is quite a distance away from price, therefore, it would be viable if price continued bullish to reposition ChOCH.
Note:
It is highly unlikely price will "crash" as many analysts are predicting. My view is this is merely a corrective wave of the primary trend.
Given the Federal Reserve's dovish policy stance alongside heightened geopolitical risks, market volatility is likely to remain elevated, influencing intraday price swings.
Price could also be driven by President Trump's policies, geopolitical moves and economic decisions which are sparking uncertainty.
Weekly Chart:
Daily Analysis:
Swing -> Bullish.
Internal -> Bullish.
Since my last weekly analysis price has printed a bullish iBOS. Bias and analysis has been accurate over the last few months.
Price is now trading within a fractal high and internal low.
Bearish ChOCH positioning is denoted with a blue shorter dotted line and is very well positioned to print bearish CHoCH which is the very first indication, but not confirmation of bearish pullback phase initiation
Note:
With the Fed maintaining a dovish policy stance and the continued rise in geopolitical tensions, we should anticipate elevated market volatility, which may impact both intraday and longer-term price action.
Price could also be driven by President Trump's policies, geopolitical moves and economic decisions which are sparking uncertainty.
Daily Chart:
H4 Analysis:
-> Swing: Bullish.
-> Internal: Bullish.
As mentioned in analysis dated 04 February 2025 that price could continue bullish to bring CHoCH positioning closer to recent price action. This is how price printed.
Price proceeded to print a bearish CHoCH which is in-line with previous intraday expectation.
Price is now trading within a confirmed internal range, however, I will be closely monitoring this.
You will note price has targeted weak internal high but failed to close above. This is potential liquidity grab to fuel the bearish pullback phase to facilitate HTF bearish pullback phase initiation.
Intraday Expectation:
Price to continue bearish and react at either discount of internal 50%, or H4 demand zone, before targeting weak internal high, priced at 2,882.310.
Alternative scenario:
Given HTF (Daily and Weekly) have also printed iBOS' it would not come as a surprise if price printed a bearish iBOS.
Note:
With the Federal Reserve's dovish stance and persisting geopolitical uncertainties, heightened volatility in Gold is expected to continue. Traders should proceed with caution and adjust risk management strategies in this high-volatility environment.
Price could also be driven by President Trump's policies, geopolitical moves and economic decisions which are sparking uncertainty.
H4 Chart:

XAU/USD 27-31 January 2025 Weekly AnalysisWeekly Analysis:
Swing Structure -> Bullish.
Internal Structure -> Bullish.
Analysis/Bias remains the same as analysis dated 01 December 2024.
Price Action Analysis:
In my analysis dated 27 October 2024, it was noted that the first sign of a pullback would be a bearish Change of Character (CHoCH), indicated by a blue dotted line. Price's consistent upward momentum had positioned this CHoCH much closer to recent price levels as expected for weeks.
Now, for the first time since 23 November 2020, price has printed a bearish CHoCH. We are currently trading within a defined internal range.
Price is anticipated to trade down towards either the discount of the internal 50% Equilibrium (EQ), highlighted in blue, or the Weekly demand zone before targeting the weak internal high.
Note:
It is highly unlikely price will "crash" as many analysts are predicting. My view is this is merely a corrective wave of the primary trend.
Given the Federal Reserve's dovish policy stance alongside heightened geopolitical risks, market volatility is likely to remain elevated, influencing intraday price swings.
Weekly Chart:
Daily Analysis:
-> Swing -> Bullish.
-> Internal -> Bullish.
Analysis/Bias remains the same as analysis dated 01 December 2024
Price Action Analysis:
Price has shown a reaction from discount of internal 50% EQ. Currently price has been unable to target the weak internal high
Given the current internal range dynamics, price is expected to target weak internal high, priced at 2,790.170 However, considering the signs of a pullback phase on the Weekly timeframe, there remains a possibility of price printing a bearish Internal Break of Structure (iBOS). Price has yet to tap into Daily demand.
Note:
With the Fed maintaining a dovish policy stance and the continued rise in geopolitical tensions, we should anticipate elevated market volatility, which may impact both intraday and longer-term price action.
Daily Chart:
H4 Analysis:
-> Swing: Bearish.
-> Internal: Bullish.
Analysis and bias remains the same as analysis dated 21 January 2025, however, CHoCH positioning has changed, bringing it closer to current price action.
Previous analysis has been met. Following price printing bearish CHoCH, price has printed a further bullish iBOS. This has significantly narrowed the internal range.
Price did not trade into either discount of 50% or H4 demand zone before targeting weak internal high, however, on this occasion I will remain systematic in my approach and revisit later.
Intraday Expectation:
Price to print bearish CHoCH to indicate, but not confirm bearish pullback phase initiation. Bearish CHoCH positioning is denoted with s blue dotted line.
It would be useful to remember that Daily TF swing and internal range are bullish.
Note:
With the Federal Reserve's dovish stance and persisting geopolitical uncertainties, heightened volatility in Gold is expected to continue. Traders should proceed with caution and adjust risk management strategies in this high-volatility environment.
H4 Chart:https://www.tradingview.com/x/tPRFgn8w/

XAU/USD 20-24 January 2025 Weekly AnalysisWeekly Analysis:
Swing Structure -> Bullish.
Internal Structure -> Bullish.
Analysis/Bias remains the same as analysis dated 01 December 2024.
Price Action Analysis:
In my analysis dated 27 October 2024, it was noted that the first sign of a pullback would be a bearish Change of Character (CHoCH), indicated by a blue dotted line. Price's consistent upward momentum had positioned this CHoCH much closer to recent price levels as expected for weeks.
Now, for the first time since 23 November 2020, price has printed a bearish CHoCH. We are currently trading within a defined internal range.
Price is anticipated to trade down towards either the discount of the internal 50% Equilibrium (EQ), highlighted in blue, or the Weekly demand zone before targeting the weak internal high.
Note:
It is highly unlikely price will "crash" as many analysts are predicting. My view is this is merely a corrective wave of the primary trend.
Given the Federal Reserve's dovish policy stance alongside heightened geopolitical risks, market volatility is likely to remain elevated, influencing intraday price swings.
Weekly Chart:
Daily Analysis:
-> Swing -> Bullish.
-> Internal -> Bullish.
Analysis/Bias remains the same as analysis dated 01 December 2024
Price Action Analysis:
Price has shown a reaction from discount of internal 50% EQ. Currently price has been unable to target the weak internal high
Given the current internal range dynamics, price is expected to target weak internal high, priced at 2,790.170 However, considering the signs of a pullback phase on the Weekly timeframe, there remains a possibility of price printing a bearish Internal Break of Structure (iBOS). Price has yet to tap into Daily demand.
Note:
With the Fed maintaining a dovish policy stance and the continued rise in geopolitical tensions, we should anticipate elevated market volatility, which may impact both intraday and longer-term price action.
Daily Chart:
H4 Analysis:
-> Swing: Bearish.
-> Internal: Bullish.
Bias and analysis remains the same as analysis of 17 January 2025.
Price has finally printed a bullish iBOS in accordance with scenario one of my analysis dated 16 December 2024.
Price Action Analysis:
After bullish iBOS, we expect bearish pullback. First indication, but not confirmation of bearish pullback phase initiation is for price to print a bearish CHoCH. Current CHoCH positioning is denoted with a blue dotted line.
Price is now trading within an internal low and fractal high.
Intraday Expectation:
Price to indicate bearish pullback phase initiation by printing bearish CHoCH. This would also establish internal structure.
Note:
With the Federal Reserve's dovish stance and persisting geopolitical uncertainties, heightened volatility in Gold is expected to continue. Traders should proceed with caution and adjust risk management strategies in this high-volatility environment.
H4 Chart:

XAU/USD 13-17 January 2025 Weekly AnalysisWeekly Analysis:
Swing Structure -> Bullish.
Internal Structure -> Bullish.
Analysis/Bias remains the same as analysis dated 01 December 2024.
Price Action Analysis:
In my analysis dated 27 October 2024, it was noted that the first sign of a pullback would be a bearish Change of Character (CHoCH), indicated by a blue dotted line. Price's consistent upward momentum had positioned this CHoCH much closer to recent price levels as expected for weeks.
Now, for the first time since 23 November 2020, price has printed a bearish CHoCH. We are currently trading within a defined internal range.
Price is anticipated to trade down towards either the discount of the internal 50% Equilibrium (EQ), highlighted in blue, or the Weekly demand zone before targeting the weak internal high.
Note:
It is highly unlikely price will "crash" as many analysts are predicting. My view is this is merely a corrective wave of the primary trend.
Given the Federal Reserve's dovish policy stance alongside heightened geopolitical risks, market volatility is likely to remain elevated, influencing intraday price swings.
Weekly Chart:
Daily Analysis:
-> Swing -> Bullish.
-> Internal -> Bullish.
Analysis/Bias remains the same as analysis dated 01 December 2024
Price Action Analysis:
Price has shown a reaction from discount of internal 50% EQ. Currently price has been unable to target the weak internal high
Given the current internal range dynamics, price is expected to target weak internal high, priced at 2,790.170 However, considering the signs of a pullback phase on the Weekly timeframe, there remains a possibility of price printing a bearish Internal Break of Structure (iBOS). Price has yet to tap into Daily demand.
Note:
With the Fed maintaining a dovish policy stance and the continued rise in geopolitical tensions, we should anticipate elevated market volatility, which may impact both intraday and longer-term price action.
Daily Chart:
H4 Analysis:
-> Swing: Bearish.
-> Internal: Bullish.
Analysis/Intraday expectation remains the same as analysis dated 16 December 2024.
Price is clearly unable to target weak internal. This is due to the fact that Daily and Weekly Timeframe remain in bearish pullback phase.
Price Action Analysis:
Technically price is to target weak internal priced at 2,721.420. Price has sweeped liquidity,
for two possible reasons.
1. To assist price to complete bearish pullback phase, react at either discount of internal 50% or H4 demand zone before targeting weak internal high.
2. To assist Daily and H4 TF's to complete bearish pullback phase with price to print a bearish iBOS and target strong internal low priced at 2,536.855.
Intraday Expectation:
Intraday expectation and alternative scenario as per points 1 and 2.
Note:
With the Federal Reserve's dovish stance and persisting geopolitical uncertainties, heightened volatility in Gold is expected to continue. Traders should proceed with caution and adjust risk management strategies in this high-volatility environment.
H4 Chart:

XAU/USD 06-10 January 2025 Weekly AnalysisWeekly Analysis:
Swing Structure -> Bullish.
Internal Structure -> Bullish.
Analysis/Bias remains the same as analysis dated 01 December 2024.
Price Action Analysis:
In my analysis dated 27 October 2024, it was noted that the first sign of a pullback would be a bearish Change of Character (CHoCH), indicated by a blue dotted line. Price's consistent upward momentum had positioned this CHoCH much closer to recent price levels as expected for weeks.
Now, for the first time since 23 November 2020, price has printed a bearish CHoCH. We are currently trading within a defined internal range.
Price is anticipated to trade down towards either the discount of the internal 50% Equilibrium (EQ), highlighted in blue, or the Weekly demand zone before targeting the weak internal high.
Note:
It is highly unlikely price will "crash" as many analysts are predicting. My view is this is merely a corrective wave of the primary trend.
Given the Federal Reserve's dovish policy stance alongside heightened geopolitical risks, market volatility is likely to remain elevated, influencing intraday price swings.
Weekly Chart:
Daily Analysis:
-> Swing -> Bullish.
-> Internal -> Bullish.
Analysis/Bias remains the same as analysis dated 01 December 2024
Price Action Analysis:
Price has shown a reaction from discount of internal 50% EQ. Currently price has been unable to target the weak internal high
Given the current internal range dynamics, price is expected to target weak internal high, priced at 2,790.170 However, considering the signs of a pullback phase on the Weekly timeframe, there remains a possibility of price printing a bearish Internal Break of Structure (iBOS). Price has yet to tap into Daily demand.
Note:
With the Fed maintaining a dovish policy stance and the continued rise in geopolitical tensions, we should anticipate elevated market volatility, which may impact both intraday and longer-term price action.
Daily Chart:
H4 Analysis:
-> Swing: Bearish.
-> Internal: Bullish.
Analysis/Intraday expectation remains the same as analysis dated 16 December 2024.
Price is clearly unable to target weak internal. This is due to the fact that Daily and Weekly Timeframe remain in bearish pullback phase.
Price Action Analysis:
Technically price is to target weak internal priced at 2,721.420. Price has sweeped liquidity,
for two possible reasons.
1. To assist price to complete bearish pullback phase, react at either discount of internal 50% or H4 demand zone before targeting weak internal high.
2. To assist Daily and H4 TF's to complete bearish pullback phase with price to print a bearish iBOS and target strong internal low priced at 2,536.855.
Intraday Expectation:
Intraday expectation and alternative scenario as per points 1 and 2.
Note:
With the Federal Reserve's dovish stance and persisting geopolitical uncertainties, heightened volatility in Gold is expected to continue. Traders should proceed with caution and adjust risk management strategies in this high-volatility environment.
H4 Chart:

XAU/USD 16-20 December 2024 Weekly AnalysisWeekly Analysis:
Swing Structure -> Bullish.
Internal Structure -> Bullish.
Analysis/Bias remains the same as analysis dated 01 December 2024.
Price Action Analysis:
In my analysis dated 27 October 2024, it was noted that the first sign of a pullback would be a bearish Change of Character (CHoCH), indicated by a blue dotted line. Price's consistent upward momentum had positioned this CHoCH much closer to recent price levels as expected for weeks.
Now, for the first time since 23 November 2020, price has printed a bearish CHoCH. We are currently trading within a defined internal range.
Price is anticipated to trade down towards either the discount of the internal 50% Equilibrium (EQ), highlighted in blue, or the Weekly demand zone before targeting the weak internal high.
Note:
It is highly unlikely price will "crash" as many analysts are predicting. My view is this is merely a corrective wave of the primary trend.
Given the Federal Reserve's dovish policy stance alongside heightened geopolitical risks, market volatility is likely to remain elevated, influencing intraday price swings.
Weekly Chart:
Daily Analysis:
-> Swing -> Bullish.
-> Internal -> Bullish.
Analysis/Bias remains the same as analysis dated 01 December 2024
Price Action Analysis:
Price has shown a reaction from discount of internal 50% EQ. Currently price has been unable to target the weak internal high
Given the current internal range dynamics, price is expected to target weak internal high, priced at 2,790.170 However, considering the signs of a pullback phase on the Weekly timeframe, there remains a possibility of price printing a bearish Internal Break of Structure (iBOS). Price has yet to tap into Daily demand.
Note:
With the Fed maintaining a dovish policy stance and the continued rise in geopolitical tensions, we should anticipate elevated market volatility, which may impact both intraday and longer-term price action.
Daily Chart:
H4 Analysis:
-> Swing: Bearish.
-> Internal: Bullish.
Price is clearly unable to target weak internal. This is due to the fact that Daily and Weekly Timeframe remain in bearish pullback phase.
Price Action Analysis:
Technically price is to target weak internal priced at 2,721.420. Price has sweeped liquidity,
for two possible reasons.
1. To assist price to complete bearish pullback phase, react at either discount of internal 50% or H4 demand zone before targeting weak internal high.
2. To assist Daily and H4 TF's to complete bearish pullback phase with price to print a bearish iBOS and target strong internal low priced at 2,536.855.
Intraday Expectation:
Intraday expectation and alternative scenario as per points 1 and 2.
Note:
With the Federal Reserve's dovish stance and persisting geopolitical uncertainties, heightened volatility in Gold is expected to continue. Traders should proceed with caution and adjust risk management strategies in this high-volatility environment.
H4 Chart:

XAU/USD 09-13 December 2024 Weekly AnalysisWeekly Analysis:
Swing Structure -> Bullish.
Internal Structure -> Bullish.
Analysis/Bias remains the same as analysis dated 01 December 2024.
Price Action Analysis:
In my analysis dated 27 October 2024, it was noted that the first sign of a pullback would be a bearish Change of Character (CHoCH), indicated by a blue dotted line. Price's consistent upward momentum had positioned this CHoCH much closer to recent price levels as expected for weeks.
Now, for the first time since 23 November 2020, price has printed a bearish CHoCH. We are currently trading within a defined internal range.
Price is anticipated to trade down towards either the discount of the internal 50% Equilibrium (EQ), highlighted in blue, or the Weekly demand zone before targeting the weak internal high.
Note:
It is highly unlikely price will "crash" as many analysts are predicting. My view is this is merely a corrective wave of the primary trend.
Given the Federal Reserve's dovish policy stance alongside heightened geopolitical risks, market volatility is likely to remain elevated, influencing intraday price swings.
Weekly Chart:
Daily Analysis:
-> Swing -> Bullish.
-> Internal -> Bullish.
Analysis/Bias remains the same as analysis dated 01 December 2024
Price Action Analysis:
Price has shown a reaction from discount of internal 50% EQ. Currently price has been unable to target the weak internal high
Given the current internal range dynamics, price is expected to target weak internal high, priced at 2,790.170 However, considering the signs of a pullback phase on the Weekly timeframe, there remains a possibility of price printing a bearish Internal Break of Structure (iBOS). Price has yet to tap into Daily demand.
Note:
With the Fed maintaining a dovish policy stance and the continued rise in geopolitical tensions, we should anticipate elevated market volatility, which may impact both intraday and longer-term price action.
Daily Chart:
H4 Analysis:
-> Swing: Bearish.
-> Internal: Bullish.
Bias/analysis remains the same as analysis dated 25 November 2024.
Price Action Analysis:
As mentioned in yesterday's analysis dated 24 November 2024, whereby price was expected to print a bearish CHoCH. This is how price printed.
Currently, price is trading within an established internal range.
Intraday Expectation:
Price is anticipated to trade down to either discount of internal 50% EQ, which is marked in blue, or H4 demand zone before targeting weak internal high priced at 2,721.420.
Note:
With the Federal Reserve's dovish stance and persisting geopolitical uncertainties, heightened volatility in Gold is expected to continue. Traders should proceed with caution and adjust risk management strategies in this high-volatility environment.
H4 Chart:

XAU/USD 02-06 December 2024 Weekly AnalysisWeekly Analysis:
Swing Structure -> Bullish.
Internal Structure -> Bullish.
Price Action Analysis:
In my analysis dated 27 October 2024, it was noted that the first sign of a pullback would be a bearish Change of Character (CHoCH), indicated by a blue dotted line. Price's consistent upward momentum had positioned this CHoCH much closer to recent price levels as expected for weeks.
Now, for the first time since 23 November 2020, price has printed a bearish CHoCH. We are currently trading within a defined internal range.
Price is anticipated to trade down towards either the discount of the internal 50% Equilibrium (EQ), highlighted in blue, or the Weekly demand zone before targeting the weak internal high.
Note:
It is highly unlikely price will "crash" as many analysts are predicting. My view is this is merely a corrective wave of the primary trend.
Given the Federal Reserve's dovish policy stance alongside heightened geopolitical risks, market volatility is likely to remain elevated, influencing intraday price swings.
Weekly Chart:
Daily Analysis:
-> Swing -> Bullish.
-> Internal -> Bullish.
Price Action Analysis:
Price has shown a reaction from discount of internal 50% EQ. Currently price has been unable to target the weak internal high
Given the current internal range dynamics, price is expected to target weak internal high, priced at 2,790.170 However, considering the signs of a pullback phase on the Weekly timeframe, there remains a possibility of price printing a bearish Internal Break of Structure (iBOS). Price has yet to tap into Daily demand.
Note:
With the Fed maintaining a dovish policy stance and the continued rise in geopolitical tensions, we should anticipate elevated market volatility, which may impact both intraday and longer-term price action.
Daily Chart:
H4 Analysis:
-> Swing: Bearish.
-> Internal: Bullish.
Bias/analysis remains the same as analysis dated 25 November 2024.
Price Action Analysis:
As mentioned in yesterday's analysis dated 24 November 2024, whereby price was expected to print a bearish CHoCH. This is how price printed.
Currently, price is trading within an established internal range.
Intraday Expectation:
Price is anticipated to trade down to either discount of internal 50% EQ, which is marked in blue, or H4 demand zone before targeting weak internal high priced at 2,721.420.
Note:
With the Federal Reserve's dovish stance and persisting geopolitical uncertainties, heightened volatility in Gold is expected to continue. Traders should proceed with caution and adjust risk management strategies in this high-volatility environment.
H4 Chart:
