XAUUSD BearishGold, Price have been moving side-ways taking out internal highs & lows inside PREMIUM, now we have clean lows that are still intact with equal lows near equilibrium. I would like to see price dropping low to take out liquidity resting below those previous lows and drop into DISCOUNT.
Xauuusd

Gold 22 July 2025 updateGood afternoon, update to last week's post of 21 July on gold, which worked yesterday, new zone to buy, the chart shows everything in detail, so today with the message "brevity is the sister of talent"
#GOLD
BUY LIMIT ZONE 3365-3370
🎯 TP1: 3385
🎯 TP2: 3400
🎯 TP3: 3412
🎯 TP3: 3428
⛔️ Stop loss: 3355
Regards, Totoshka™

SILVER ( XAGUSD ): Still Bullish! Take The Buy Setups!In this Weekly Market Forecast, we will analyze the XAGUSD (SILVER) for the week of July 21-25th.
Silver remains a Strong Buy rating. There is no technical reason to look for shorts. Only buys right now, until we see a bearish break of structure. Then sells can be considered.
That having been said, like Gold, there is a 4H +FVG that we are watching. If it holds, higher prices will ensue. If it fails, the lows become the draw on liquidity.
We'll soon see how it plays out.
Enjoy!
May profits be upon you.
Leave any questions or comments in the comment section.
I appreciate any feedback from my viewers!
Like and/or subscribe if you want more accurate analysis.
Thank you so much!
Disclaimer:
I do not provide personal investment advice and I am not a qualified licensed investment advisor.
All information found here, including any ideas, opinions, views, predictions, forecasts, commentaries, suggestions, expressed or implied herein, are for informational, entertainment or educational purposes only and should not be construed as personal investment advice. While the information provided is believed to be accurate, it may include errors or inaccuracies.
I will not and cannot be held liable for any actions you take as a result of anything you read here.
Conduct your own due diligence, or consult a licensed financial advisor or broker before making any and all investment decisions. Any investments, trades, speculations, or decisions made on the basis of any information found on this channel, expressed or implied herein, are committed at your own risk, financial or otherwise.

Gold's Bullish Momentum: Trading Strategy for TodayTechnically, gold prices continued their strong bullish rally to break new highs last Friday 😎. During the Asian and European sessions, prices broke through the 3320 mark and extended their upward momentum with sustained strength 💹. In the afternoon European session, gold prices kept surging, breaking through and standing above the 3340 mark, accelerating the upward trend 🔥. In the evening US session, the price further accelerated its rally, piercing the 3369 level before pulling back and closing strongly 📈. The daily K-line closed as a fluctuating and high-breaking bullish candle 🌞. On the daily chart, there has been a strong bullish rally breaking new highs for three consecutive trading days, and the overall price has returned to the 3360 mark, re-entering a strong bullish one-sided pattern.
This morning, gold prices opened with a further gap higher, piercing the 3370 mark and continuing to fluctuate strongly 😜. Today's trend should focus on buying on dips 🙌. Although gold gapped up and surged for a while, the momentum is not strong. There must be a pullback for adjustment; otherwise, it will be difficult to maintain the upward momentum 🚶♂️.
From the 4-hour chart analysis, the short-term support below today should focus on the hourly neckline around 3340-45 📍, with key attention to the 3325-30 support level. During the day, we should continue to take the opportunity of pullbacks to go long as the main strategy 😏. The key dividing line for the short-term bullish strength is the 3325 mark. As long as the daily chart stabilizes above this level, we will continue to maintain the strategy of buying on dips to follow the bullish trend. Before breaking below this level, we will keep the strategy of buying on dips to follow the trend 💪
Accurate signals are updated every day 📈 If you encounter any problems during trading, these signals can serve as your reliable guide 🧭 Feel free to refer to them! I sincerely hope they'll be of great help to you 🌟 👇
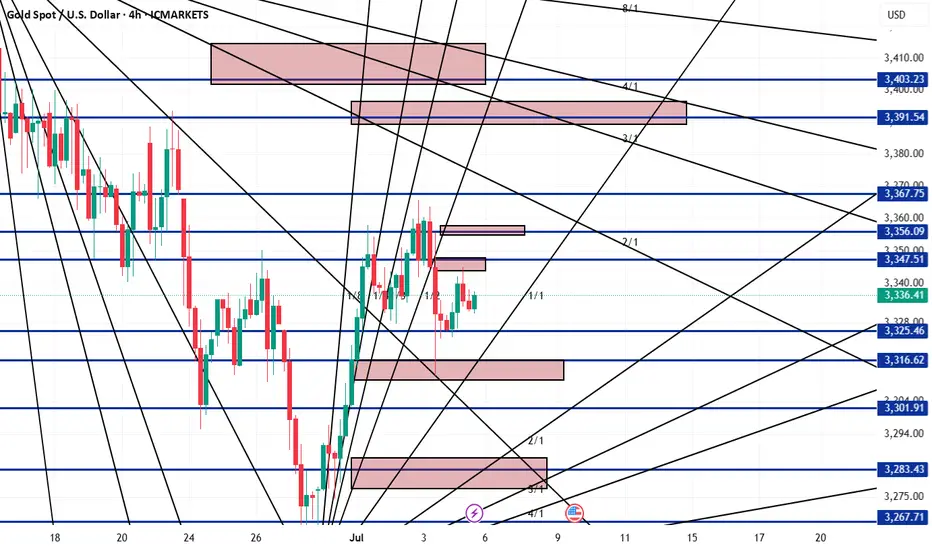
GOLD Analysis 7/7/2025Based on gold analysis using digital analysis , Gold Analysis on 4H frame
Selling Zones :
3389 - 3397
3401 - 3415
buying zones
3286 - 3277
3234 - 3222
Gold Price Analysis June 27Daily Trend Analysis:
The price has reacted strongly at the 3348 level, forming a clear and sustainable bearish structure. The 3296 zone is now a critical level — a confirmed breakout below this area could lead to a deeper decline, especially with limited potential for recovery on Friday.
Today, the bearish trend is likely to face less resistance compared to the bullish side. As such, a move toward the support zones at 3278 and 3255 is highly probable.
Any bullish retracement during the European session should be viewed as a good opportunity to look for SELL setups, targeting 3278 and 3255.
As previously analyzed, SELL zones are clustered around key resistance levels. Traders should closely watch price reactions in these areas for potential entry signals.
🔹 Breakout key level: 3296
🔹 Support zones: 3278 – 3255
🔹 Resistance zones: 3300 – 3312 – 3325 – 3336 – 3348 – 3363

XAUUSD Consolidation Idea As we can see that Gold is on consolidation phase but we can still use the given support and resistance to our advantage
Although further confirmation will be needed in order get into sells or buys
USDJPY Trading RangeUSDJPY saw some corrections late on Friday. Overall, the pair remains sideways in a wide range of 143,000-145,100 and has yet to establish a clear continuation trend.
The wider band in the sideways trend is extended at 146,000 and 142,000.
The trading strategy will be based on the band that is touched.
Pay attention to the breakout as it may continue the strong trend and avoid trading against the trend when breaking.
Support: 143,000, 142,000
Resistance: 145,000, 146,000

US-China Talk Drops Gold Short; Short StrategyToday, Trump announced that China and the U.S. participated in a telephone exchange 🔊! After the market learned this, optimistic sentiment surged rapidly, causing U.S. stock futures to rise sharply in the short term 📈. As a result, spot gold turned lower in the short term ↓. The current situation favors short positions:
Short at current price 📉: Initiate a small short position near 3350 👌, set a unified stop loss above 3360 ⚠️, and target key support levels at 3325-3320 🎯.
Add to shorts on rebound ↕️: If the price rebounds to the 3350-3360 range, increase the short position 📊, maintaining the same target 🎯.
Chase shorts on breakdown 💥: If the price breaks below 3320 support, chase the short trend with a stop loss at 3330 ⚠️, targeting the psychological level of 3300 🧠.
Risk reminder ⚠️: Monitor U.S. stock futures and follow-up developments in U.S.-China relations closely 👀, and be wary of volatility caused by a reversal in market sentiment 🚦. Keep position sizes within 10% ⚖️ and strictly adhere to stop losses ⛔.
Gold Trading Strategies
sell@3350-3355
tp:3325-3320
sell@3315-3320
tp:3305-3300
Professional trading strategies are pushed daily 📊
Lock in precise signals amid market fluctuations 🚀
Confused about market trends? Stuck in strategy bottlenecks?
Real-time strategies serve as your "trading compass" 🌐
From trend analysis to entry/exit points, dissect market logic comprehensively
Refer now 📲
Help you move steadily forward in investments ✨
👇👇👇

Gold Analysis
Last week's movement so far on the chart moved as expected. To continue this week's path, expect another step to correct to two support areas, first the 3264-3255 range, and if lost to the support area 3265-3232. It can be considered that from one of these two supports, the upward movement for the liquidity above it will continue. The resistance/support areas will change their nature if lost.

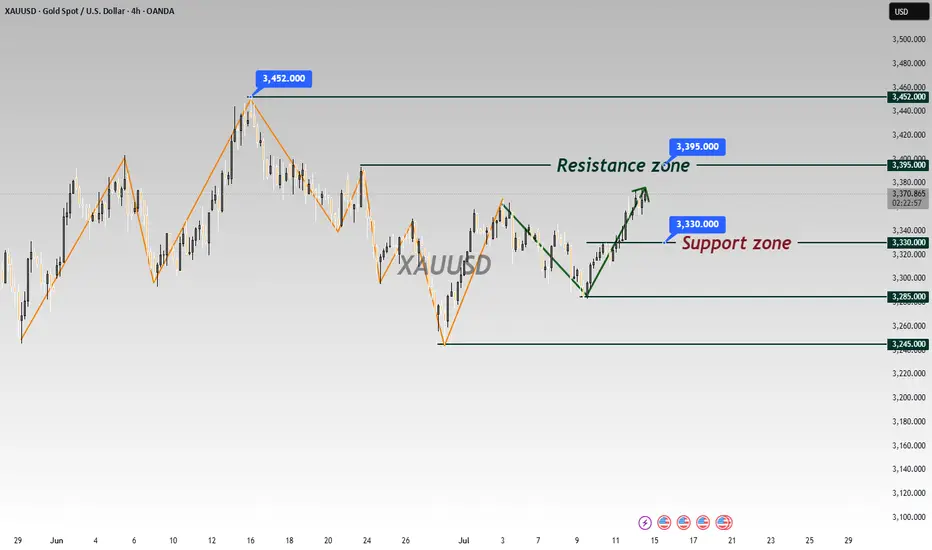
Gold is Heating Up! Breakout + Trendline Support Gold has shown strong bullish continuation after breaking above a key descending resistance line. Once that breakout occurred, price formed a strong rising trendline, which has since been respected as dynamic support.
Additionally, a former resistance zone has now flipped into support, confirming a bullish market structure. Price is currently approaching a major upper resistance zone, where we may see a temporary pause or reaction.
As long as the rising trendline holds, the momentum remains in favor of buyers — and a clean breakout above the upper zone could trigger the next leg higher.


XAU/USD Longs from 3,220 or 3,120 back to ATHMy Analysis this week for gold is for it to keep pushing higher, even though gold has been overbought and we could at any time expect a major correction or distribution. We will be going on. current market structure and currently we have seen another ATH breach as well as multiple break of structures to the upside.
From these demand zones that have been created we will be looking for a small correction a retracement in which price will then re accumulate in one of our POI, to cause another rally to the upside.
Confluences for GOLD Buys are as follows:
- Demand zone on the 4hr and 6hr is near by for potential long setups to formulate.
- Market structure has been very bullish on the lower and higher time frame
- There is asian high above that needs to get taken out as well
- Dollar index has been bearish which means bullish movement for GOLD
P.S. If price breaks through both demand zones i do have an extreme one at 3,020 but if it reaches that low we could expect price to just start moving temporarily bearish.

#XAUUSD #ForexThis chart shows the price action of Gold Spot against the U.S. Dollar (XAU/USD) on the 1-hour timeframe. Here's a quick breakdown:
- **Price Channel**: The price has been moving within an ascending channel (blue lines), indicating a strong uptrend.
- **Breakout**: The current price ($3,343.10) has broken above the upper boundary of the channel with strong momentum.
- **Bullish Bias**: A bullish
continuation is anticipated, as shown by the large blue arrow pointing upward.
- **Target & Stop-Loss**:
- **Target**: Around $3,401.25 (marked in green).
- **Stop-Loss**: Around $3,302.95 (marked in red).
- **Risk-Reward**: The setup appears to offer a favorable risk-reward ratio for a long position.
Do you want an analysis of potential reversal points or a deeper dive into entry/exit strategies?

XAUUSD NEXT MOVE IN 30MI Created This XAUUSD Chart Analysis In 30-M Tf
Entry: BUY from 3220
Support zone : 3220 / 3216
Target Will Be : 3240
OANDA:XAUUSD made parallel Channel and It take support and it went to Uptrend, Let me know your thoughts in comments section

Will gold first fall and then rise today?
The gold 1-hour moving average is still in a bullish arrangement with a golden cross. Now the price is gradually approaching the moving average, but the gold bull trend has not changed for the time being. Patiently wait for the opportunity to adjust. Pay attention to the support near the previous low of 3185. The moving average support has now moved up to the line near 3177. Overall, gold may form a strong support near 3180. For today's gold trend, I personally think it will fall first and then rise.

Gold still has the potential to bounce back to 3070!Gold has been experiencing significant volatility driven by fundamental factors. While bearish sentiment appears to remain dominant, the recent downside move has already priced in much of the negative risk. As such, traders should avoid an overly one-sided bearish bias in the current environment.
After bottoming out near the 2970 level, gold staged a strong rebound. During the ensuing consolidation phase, the 3010–3000 zone has provided consistent support, signaling the emergence of a short-term demand zone. This indicates that the bulls have not completely capitulated and may attempt to stage a corrective rally toward the 3050 level, or potentially even as high as 3070.
From a short-term trading perspective, we may consider initiating long positions within the 3015–3005 range, aiming for an upside target of 3050, with a possible extension toward the 3070 resistance area.
The trading strategy verification accuracy rate is more than 90%; one step ahead, exclusive access to trading strategies and real-time trading settings

Gold (XAUUSD) – Technical Analysis for April 7, 2025 (1H)After a sharp drop, price reached the key demand zone around 3025-3030. This area forms a potential buy zone from which a rebound toward 3080–3100 may occur. The chart suggests a possible W-shaped recovery. A breakout above 3100 could unlock further upside toward 3127 and then resistance at 3167.
However, a breakdown below 3015–3020 could increase bearish pressure and lead to a decline toward 2997 support. Indicators are showing signs of local oversold conditions, hinting at potential technical recovery.
Main scenario – reversal from 3025-3030 with a move toward 3080–3100.
Alternative – breakdown to 2997.

GOLD I think gold is correcting from this price. The market is panicking right now but the geometry is working.

GOLD READY TO EXPLODE? Key Levels You MUST Watch! Gold (XAU/USD) is at a make-or-break point, holding key support while testing resistance. A breakout could send prices soaring—are you ready?
📌 Current Price: $2,913.80
📊 Market Bias: Still bullish, but key zones must hold for continuation.
🔥 Key Levels You NEED to Watch:
🔵 Major Resistance: $2,920 → A clean breakout could push price to $2,945 - $2,960.
🟢 Critical Support: $2,834 → If this level breaks, expect a drop to $2,800 - $2,760.
📈 Trendline Support: Gold is respecting an ascending trendline, keeping the bullish structure intact.
🎯 Trade Setups:
✅ Bullish Scenario: If Gold breaks $2,920, we could see a rapid move toward $2,945+.
❌ Bearish Scenario: If price loses $2,834, sellers may take control, driving price lower.
📌 Why This Matters:
Gold is being fueled by inflation concerns, central bank policies, and investor demand for safe-haven assets. The next breakout could set the tone for the coming weeks.
💬 Will Gold pump or dump from here? Drop your predictions in the comments! 🔥👇

Gold to $3,000? Key Levels to Watch-XAU/USD AnalysisGold has been on a tear lately, pushing up towards $2,942, and the big question now is: Do we see a pullback, or is $3,000+ on the horizon?
Here’s what I’m watching:
🔹 $2,942 – Key resistance level. If we break above, momentum could take us straight to $3,000.
🔹 $2,875 – A potential pullback zone where buyers might step in before another leg up.
Markets are moving fast, and this could get interesting. Are you bullish or bearish on gold right now? Drop your thoughts below! 👇
Kris/Mindbloome Exchange
Trade Smarter Live Better

double zig zag abc wxy wave near $2720 resistance levelbefore last fomc meeting gold collapsed in big but since fomc rate cut last time
gold is constantly going up making higher highs with higher lows a clear up trend
wxy waves subdivided into small degree abc waves has reached big static horizontal resistance level $2720
a blue parallel channel with upper line tested near resistance on last friday
projection for wave Y near resistance level

GOLDzone of 2740$ is very good resistant zone
my opinion GOLD in this zone revers to trendline in zone of 2630$
