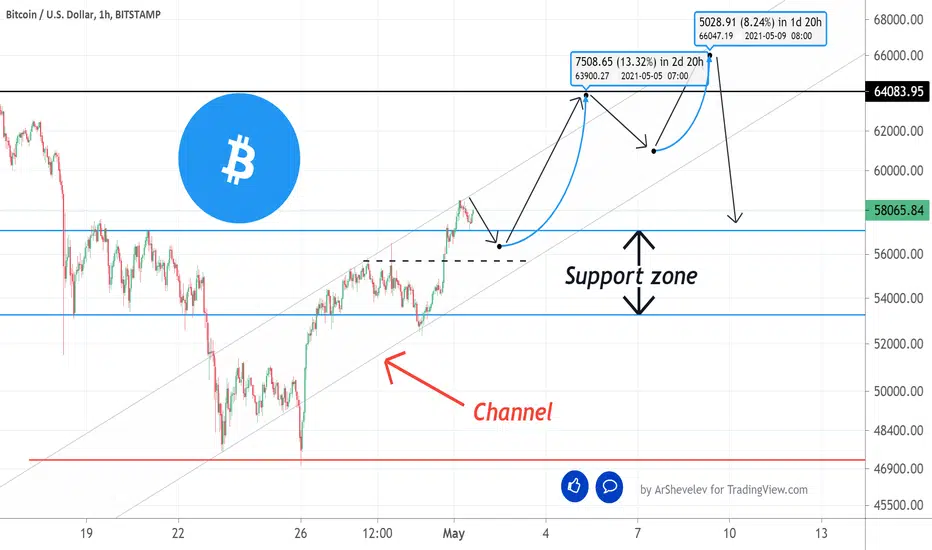
Bitcoin Price action plan 01 May 2021Price of Bitcoin shows impulsive structure and so far I am looking for renew of ATH during first half of May. I keep hold long on futures and spot, mid term stop loss 47k daily closing.
Xbt
BTC ready to bounce- $57kBTC making a rounding top amid a bullish trend. If we hold above the $53,500-53,700 range, BTC should bounce on increasing volume and start a new uptrend to $57k.
If we fail to hold the dashed white line, things could get ugly.
- Sultan of Chart

BTCUSD ~ Correction ContinuationAs per my previous posts, it does look like BTC has rejected the upward channel we previously held for the entire bullrun up to this point.
The re-entry back into the channel also coincides with 10D and 20D MA's which were also rejected.
Now we are most likely to go down and retest 50D MA and 100D MA.
The 100D MA, over the next weeks, will run up and meet what I call the "price-floor" which I gauge to be around 42k area (not exact, and it will surely wick below it).
I am therefor placing BUYS from 45k all the way down to 35k, hoping for some crazy wicks as n00bs panic-sell.
For me its been very easy to find good entry BUYS on nearly all charts, to line up between the same ranges of fibonacci-retracements with what I expect BTC to go to.
So if BTC is going back down to its 0.618 fib for example, and is currently above the 0.5, you can typically also set buys on other coins at the same fibs (and lower fibs as well, since alt coins will dump more than btc will).
In a bull market, only trade or buy with the trend = we are NOT shorting anything.
Shorting a bull market is suicidal, as is longing a bear market.
Therefor I an NOT marking this chart as a short, even though I do expect we go down.
BTC's strength can pump us up anytime, and it might be too strong for us to even reach the price floor we are hoping for.
Just like those dumb greedy hedgefunds overshorted gamestop - dont be that one....


Bitcoin Rejected from Strong resistance so Ready for $50000..?#BITCOIN TA Update:-
$BITcoin currently trading at $54100
And yesterday our last post and I told you If BTC 6H candle closed above $55500 then I will bullish.
But Rejected from Resistance level.
Now..?
I am waiting for $49000-$50000
This is my short term Target.
Not down...?
Bitcoin only bullish if Big time frame candle close above $56000
So I always suggest never trade blindly.
Support:- $49000/$44000/$38000
Resistance :- $56000/$59300/$65000
Please click LIKE button and Appreciate my hard work.
Must follow me for latest crypto real time updates.
Thank you.

ETH, ADA, XBT and XRP: Overbought.The 4hr charts have been good to watch for overbought/oversold indicators lately. Here the Stochastics are all saying it’s time for a pullback.
A little outperformance from ETH and ADA on these charts, but all of these big boys risk some profit taking now.

BTC Bearflag ABC correctionBitcoin fell out from the rising wedge and is now in a ABC bear flag correction phase targeting the 21 weekly Moving Average which also correlates with the 0.382 Fibonacci from the greater move Corona crash till ATH).
The B would also fill the CME gap and if you draw a Fibonacci extension from ATH to A the Golden pocket marks the CME gap perfectly.
all this signs tell me this is the most logical outcome. presuming we close todays daily candle above 50k.
further if you backcheck bullish corrections take about 2 weeks.
so far we have one 1 week behind us.
there is 1 more week till monthly close.
weekend starts today so i would not be surprise we move up this weekend liquidate the shorts up to the gap.
Monday CME opens we print the gap fill and come down for the C to the 0.382 Fib and close the month in RED there making everyone happy that we finally touched the 21 weekly MA again.
then start a fresh monthly green candle with probably oscillators reset nd bullish divergence targeting the range highs again.
when we get there i will update with a new chart to look at further targets.

Bitcoin LTF ready for $50000 or $65000...?#BTCUSDT LTF Update:-
$BTC currently trading at $54900
And now trading at resistance level $55000
If price sustained above $55500 then My target will be $65000
Otherwise ready for $50000
So CryptoPatel Levels:-
Above $55500 = $65000
Below $55000 = $50000
If closed ( any small time frame candle minimum 1H candle ) above $55500 then Target would be
$59398
$62293
$64773
But If not sustained above $55500 then
$50000
$44000
$38000
Please click LIKE button and Appreciate my hard work.
Must follow me for latest crypto real time updates.
Thank you.


Bitcoin Now Bullish or Bearish..? what's your opinion on My IDEA#BTCUSDT TA Update:-
Currently BTC trading at $54700
And i already mentioned in my last Post, if btcusdt hold level of $50800-$50900 then BTC is bullish for short term..
Now...?
Now Trading near at resistance level of $55500-$56500.
If btc manage to hit and cross Resistance level, we can see some upward movement to $59150 or near by.
So keep an eye on below given very important levels:-
Resistance:- $55400/$59174
Support:
$50900/$44808/$37542
Don’t play with fund without any confirmations.
Always keep an eyeon above given levels.
I am mid term bearish but short term bullish,
I already told you about after $50900 , we can see some bullish movement.
So let’s watch for level of $59200.
Please click LIKE button and Appreciate my hard work.
Must follow me for latest crypto real time updates.
Thank you.

BTC there's a strong case for 80KBTC looks as though it has printed its bottom and is recovering nicely.
This ascending channel has held and continues to be the current trade channel. If this holds true this could be the bottom of a very bullish movement.
The charts seem to point to at least 80K and that's a minimum (circled in yellow on the chart). BTC can go as high as the top green trade channel without finding resistance.

Bitcoin & Altcoins slipped into Bear market!In these 6 charts, you see the total cryptocurrencies market cap, the total cryptocurrencies market cap without bitcoin, and the bitcoin price chart.
watching them all together will help you decide better and provide a better picture of the situation!
While many think the Bitcoin crash will be an opportunity for altcoins, numbers don't show this! Actually, altcoins are more vulnerable to bear market! and they experienced a 32% price drop in 7 days!
Anyone who denies this reality will pay for that soon!

BTCUSD Top or Bottom Signal from Near-Far ARBThis chart shows how the ratio between the annualized rolling basis of the near and far futures contracts can spot local tops and bottoms for BTCUSD

Bitcoin Chart without Candles, #Bullish from here!Yes, it may looks interesting, this chart have no candles but the exact target where we headed from here.
Enjoy!
Bitcoin Crazy dump or opportunity?!Price located in good place to buy, looking forward positive move during next week.
Unfortunately alts portfolio down 25% or more, hopefully we going to see recover.

Bitcoin Ready for another dum $37000 or $55000 so read full IDEA#BTCUSDT TA Update :-
#BTCUSDT currently trading at $49380
And I am still bearish but waiting for daily candle close.
No good Volume in BTC so we can say Bullish.
Now $50930 support also broke down in 12 hours time frame and waiting for daily candle close.
Now...?
I am expecting #BTC downfall continue and My target 1 is $44800 and 2nd Target is $37542
Please trade after good confirmations never blindly trade.
Keep an eye on below level:-
Support:- $44808/$37542
Resistance:- $50900/$57100
Please click LIKE button and Appreciate my hard work.
Must follow me for latest crypto real time updates.
Thank you.

BTC - Big Correction? Looks weak tbh
Won't bet on it, but looks like we're going to retest the bottom of the channel (after unsuccessful test of $60k). Long and mid-term still bullish for me. On the other hand, mb, mid-term it looks more like sideways now.
Information is just for educational purposes, never financial advice. Always do your own research.
Hit the "LIKE" button and follow to support, thanks!

₿itcoin: $BTC/USDT Potential Targets 🎯 Bottom Is In!₿itcoin:
$BTC/USDT
Potential Targets 🎯
Bottom Is In!

Correction, Crash, or Burst of a Bubble?A market crash is a rapid and often unanticipated drop in prices. A market crash can be a side effect of a major catastrophic event, economic crisis, or the collapse of a long-term speculative bubble.
A bubble is an economic cycle that is characterized by the rapid escalation of market value, particularly in the price of assets.
This fast inflation is followed by a quick decrease in value, or a contraction, that is sometimes referred to as a "crash" or a "bubble burst."
www.investopedia.com

BTC, 2D Sell printed since October 20202D Sell Confirmed.
Let see how it goes, hopefully its the bottom before new highs
if fails to hold around this area (~50k // March 24 low), then next level to watch is at ~42k
#BTC

This is not March 2020. Don't jump the gun on the left
After breaking the lower trajectory of the upward triangle, bitcoin staged a rally, but only to correct the downward slope.
Now we see that MA6 is suppressing, and there is an upward channel here, and we have to pay attention to whether the support of the lower rail is effective.
Once the channel falls off the rails, it can dip to its former low of about $43,000,
But I think the real purpose of this correction should be to confirm support for the MA144.

Time proves how accurate is the analysis!I asked my followers not to participate in any opening day, why???
because I reviewed all the IPOed stocks in the past 3 years..! 80-85% will go down between 30-90% in a couple of weeks or months..!
Even big names did the same, do not believe ??? continue reading:
this is the result of research-backed trades..!
Interesting? not?
Learn From Past Experiences, History repeats itself in different ways!
don't believe it?
look at this:
Still don't believe?
I can not do anything to convince you not to put your money in the wrong place, you are good prey for the wolves of Wallstreet.

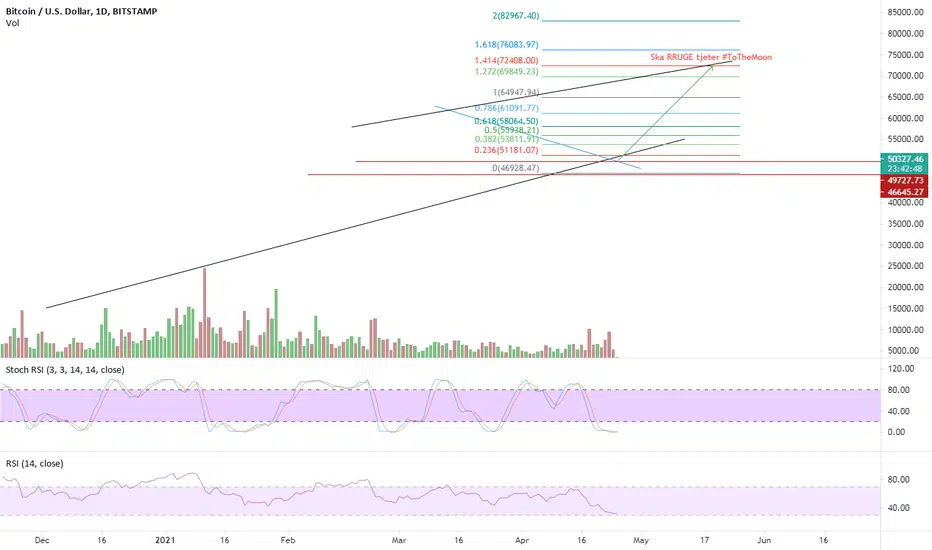
Bitcoin Price Action Outlook 22 April 2021Hey! Btc shows highly complex correction movement, which is not interesting to trade. ANyway price might open new Buy opportunity for mid-term.
On chart side you can see EW map, using Fib channel and wave-5 target I think best buy opportunity for mid term will be near 50-51K
