Bitcoin closed below its 50EMA, the worse has yet to come..!No matter what time frame are you looking at, Monthly, Weekly, Daily, or hourly, all have made Bearish patterns!
In a couple of years, we will see if these cryptocurrencies become a "Ponzi Scheme" or "Tulip Mania"!
do you want to know what is a Ponzi scheme or a Tulipmania?
read these articles!
en.wikipedia.org
en.wikipedia.org
Xbt

BTC: Bears & Their FlagsThis is an excerpt from Kraken Intelligence's "The OTC Daily". To stay up-to-date with the latest market developments, be sure to subscribe to Kraken Intelligence at kraken.com
Since giving up the 50D SMA over the weekend and bouncing off a local low of $51K, the bulls have been struggling to turn the ship around and regain any kind of meaningful ground. As we can see in the 4H chart provided above, BTC has made a valiant effort in closing back above the 50D SMA, but with little luck.
To make matters worse for the bulls, price action over the past few days seems to suggest a bear flag is forming. As the name implies, a bear flag is a technical pattern that provides an extension/continuation to an already existing downtrend. As such, one could expect BTC to break to the downside sometime between now and April 30 (the flag's apex).
Even if BTC continues to bounce between the flag's trendlines and eventually breaks through the flag's support (~$53,300), it's not exactly clear where BTC will then bottom out at. But of the limited historical price action that exists, the case could be made that BTC will find support at $51K. If said level fails to hold, a close eye ought to be kept on the $46,300 - $49,500K region. This is a range that we saw BTC spend a decent amount of time inside of in late February and early March before trending higher. Thus, it's most certainly not out of the realm of possibilities that BTC revisits this range yet again.
Do keep in mind that in prior bull market cycles, BTC has typically corrected anywhere from -30% to -40%. With BTC having yet to correct that severely this market cycle, we should consider what kind of correction BTC will have incurred if/when it revisits any of the aforementioned levels of support:
A move down to $51,000 would imply a -21.5% correction from BTC's all-time high of $65K.
A move down to $49,500 would imply a -24% correction from BTC's all-time high of $65K.
A move down to $46,300 would imply a -29% correction from BTC's all-time high of $65K.
For BTC to have corrected -40% from its all-time high, BTC will have to revisit $39K.

Bitcoin is going to $100,000 in the next 6 monthsBitcoin is going to $100,000 in the next 6 months and there is nothing that will stop it. FTX:BTCUSD


Bitcoin Ready for $44000...?#BTCUSDT TA Update:-
#BITCOIN currently trading at $55830
According to my TA I told you about this scenario and hope you also prepared for this dump.
I clearly told you some days before when BTC break $59000 then ready for $44000
So Now this scenario is applied.
I am bearish below $60000
So guys Keep watch this important level.
Support:- $54500/$44417/$33958
Resistance:- $60000
So guys if BTC break upward $60000 then I will bullish otherwise I am ready for $44000 and $34000
Never trade blindly.
Always open any trade after solid confirmations.
Please click LIKE button and Appreciate my hard work.
Must follow me for latest crypto real time updates.
Thank you.


Bitcoin | Don't Catch the Falling Knife..!!#BTC (Update)
In Daily timeframe Chart, Rising Wedge Broken Downside & Bulls lost the EMA50 Support too.
So Far Bitcoin Looking Horrible so Don't Catch the Falling Knife, We Could See More Downside Move.📉
First time Since OCT 2020, Daily Candle Closed Below the MA50 But Bitcoin is Still Moving Above the Major Trendline.
If Daily Candle Closed Below the Trendline too, Then this Will be Bearish Sign for Bitcoin. (Bitcoin Might Crash More 📉)
Please like the idea for Support & Subscribe for More ideas like this and share your ideas and charts in Comments Section..!!
Thanks for Your Love & Support..!!

There is a positive correlation between Nasdaq and Bitcoin.Having noticed a positive correlation between NASDAQ and Bitcoin, I asked my followers to close all their long position Last Friday..!
I also predicted the tough week and did not publish any buy analysis or recommended portfolio for the coming week.
find the evidence in the related link.

BTC levels of supportBTC has had a correction occur with it breaking out the bottom of it's current price trend. However BTC has two levels of support with the first proving itself a worthy adversary to the current bearish movement.
BTC can go to as low as $53K before finding the first level and as low as $48K before finding the second (marked on the chart with yellow arrows).
I would be buying the dip. Not financial advice. Just personal opinion.

BTC : Nothing to worry aboutWe are still positive
keep holding
don't sell your BTC to MARKET MAKERS
Please like the idea for Support & Subscribe for More ideas like this and share your ideas and charts in Comments Section..!!
Thanks for Your Love & Support..!!

Btc Bearish Case (RSI Bear Dev Fractal)Might skip pandemic crash this time :)
This analysis is totally based on this almost ridiculously the same RSI bearish divergence. It's a weekly fractal. Based on this idea, we might consider 7-8 months of bear market.
Comments welcome..

BTC BITCOIN SIDEWAYS FOR A WEEK IMPORTANT LEVELS BTCUSDT XBTUSDBTC BITCOIN SIDEWAYS FOR A WEEK IMPORTANT LEVELS BTCUSDT BTCUSDC XBTUSD

How to operate after the Bitcoin crash?
Bitcoin's "floating flag" is well established, breaking the lower side of the "triangle" on the downside today, triggering a long unwinding, with $600 million of holdings disappearing in one day at OKEx and Huobi.
Here's a reference. The CME exchange is closed from Saturday to Sunday, so when it opens on Monday, the movement of the CME's bitcoin contracts will have a big impact on the currency market.
So far, the CME's bitcoin contract has left two jumps open at $54,400 and $59,400. According to the logic of gap covering, CME's bitcoin contract will cover the following two gaps.
Now there's a problem. If the price of bitcoin is above $54,400 before the market opens on Monday, it means that the impact of long positions being unwound when the CME opens will directly drive the price down.
In other words, the higher the rally now, the more bearish it will be Monday morning.
So let's hope the bouncers here are cautious enough. Stop being cannon fodder for the dealer.


Bitcoin is Still Moving above the Trendline..!!#BTC (Update)
In Daily timeframe Chart, Bitcoin is Still Moving Above the Trendline, So No need to Worry About it.
Corrections Are Necessary for Healthy Uptrend. Let's Send Bitcoin to ATH 🚀📈
Please like the idea for Support & Subscribe for More ideas like this and share your ideas and charts in Comments Section..!!
Thanks for Your Love & Support..!!

Bitcoin Ready for $37000 guys or still you think toward $75000#BTCUSDT TA Update:
$BTCUSDT currently trading at $59700
I know many people now panic from BTC dumped.
What will do now...?
BTC now Trading at Very strong level.
As I always post this support level in my BTC updates.
There are 2 scenarios.
Scenario 1:-
Now BTC still bullish above $57436
Why..?
Because last support is to hold BTC 59300
But If wick down then last support is $57436
So Personally I am bullish above $57400
Scenario 2:-
If hold this level then again btc ready for new All time high.
But if bounce back from here then my first target will be $66500
Support:- $59300/$57400
Resistance:- $66500
Please click LIKE button and Appreciate my hard work.
Must follow me for latest crypto real time updates.
Thank you.

Bitcoin: Are the buyers about to regain full control?Bitcoin recently took out its 62,000$ Resistance creating a new all time high, and right now from a Technical Analysis standpoint we are coming to a crucial point. On the Chart, even the price has already broken out two times downwards from this Upwards Sloped Channel, I think it is still quite important.
---------------------------------------------------------------------------------------------------------
Parallel Channels
Parallel Channels are quite common in Cryptocurrency aswell as other financial markets. In this pattern the price moves upwards or downwards zig zagging between a slopped parallel channel. This signifies a battle between the buyers and sellers until eventually we see a breakout above or below the "trendlines" which are the lines formed when the price makes 2 obvious "swings" or touches on each side of the pattern, forming the sloped structure.
When price finally "breaks out" of the structure, below or above; we can see a continuation in that said direction, unless the price quickly moves back inside the pattern, in which then traders who were looking to capitalize on the breakout are quickly taken out of their trade as the price reverses the other direction inside the pattern again, a successfull breakout is usually marked with a retest, which is a confirmation of the change of trend after breakout of the pattern.
Parallel Channels are made up of these key characteristics:
-Minimum 2 Touches on Each Side with obvious swing points
-Should form Straight Edges
-Upwards sloping channel shows a Bullish Trend until broken
-Downwards sloping channel shows a Bearish Trend until broken
---------------------------------------------------------------------------------------------------------
Market Trend
The dictionary definition of trend: a general development or change in a situation or in the way that people are behaving.
In financial markets the direction the price of a asset is moving is referred to as the trend.
Markets are made up of several different kinds of trends, and it is the recognition of these trends that will largely determine the success or failure of your long and short-term investing.
There are 3 key trends in a Markets:
1. Bullish (upwards, buyers in control) (higher lows, higher highs (HL, HH)
The Mark Up phase is an uptrend or bullish trend.
2. Bearish (downwards, sellers in control) (lower highs, lower lows (LH, LL)
The Mark Down phase is an downtrend or bearish trend.
3. Consolidation /Sideways (sideways, direction & control undecided temporarily)
Re accumulation & Re distrubution phases are consolidation phases or "pauses" in the market before continuation of trend.
This upwards slanting Parallel Channel is a great example of a Bullish Market Trend, in a Bull Market the characteristics of the trend usually show obvious Higher Lows and Higher Highs consecutively, showing us that Bitcoin is still in a strong upwards trend as long as we keep printing the HL, HH (Higher Lows & Higher Highs).
---------------------------------------------------------------------------------------------------------
Conclusion
To put it simply, if the price can Find Support (Stay Above and Bounce Off) the 61200-61900 area we may see the price confirm that it is back inside the upwards sloped channel, if this occurs many buyers may flock in for a speculated push to the $70,000-$80,000 region or higher, if we were to lose this area though Bitcoins fast paced upwards movement may be cut short as the Upwards Channel breaks down.
Thank You, I hope you found the analysis informative, feel free to leave your comments.

Bitcoin Is ready for $75000 or $42000 what is next move..?#BTCUSDT TA Update:-
$Bitcoin Currently trading at $61100
And this is very good support so I can expect bounce back from here.
Now...?
I personally can expect Upward move from here and Target is $70k-80k
But If break down $59000 then I will Very bearish.
Support:- $59000/$42800
Resistance:- $65000/ Moon 🚀
Please click LIKE button and Appreciate my hard work.
Must follow me for latest crypto reap time updates.
Thank you.

One Possible Danger: Bitcoin Will doom lots of newbie tradersBitcoin seems like losing strength and buying volume, and how about its clear that it making 5th wave of bull trend, the correction of this trend will be 50% of its price and 30k is possible target for preparing bears.


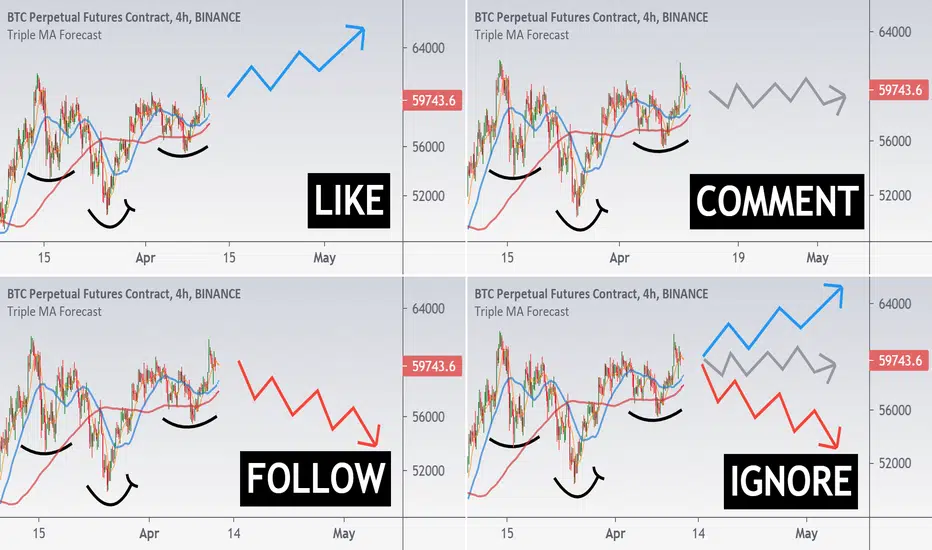
Bitcoin — What is your choice... ? 😏Traders can share this chart in instagram or other social media
To save this chart as a pic:
Right-click the illustration below, and then click Save as Picture.
Bitcoin Exclusive Update and Target is $75000#BTCUSDT TA Update:-
#BTCUSDT currently trading at $61200
And Our last #Bitcoin Update was when BTC price $54500
Hope you still holding with huge Profit.
But now...?
Keep in mind My 2 support level.
Support 1 & Support 2
If both support break down then Ready for $42000
But
Now #Bitcoin is Supper bullish above $58000
Now Targets:- $65000/$68000/$75000
🚨 I strictly Recommend if BTC price below $54500 then Exit and convert in USDT. I also if this happened. ( not Financial advice )
Support:- $58000/$54500
Resistance:- 61500 / Moon 🚀
Please click LIKE button and Appreciate my Hard-work.
Must follow me for latest crypto real time updates.
Thank you.
