BITCOIN (BTCUSD): Pullback From Key Level ₿
Bitcoin dropped to a key daily structure support on Friday.
Analyzing the reaction of the price to that, I spotted a double bottom formation on 4H time frame.
The price broke its neckline, and now we see its retest.
I believe that the market will bounce at least to 22300 level soon.
❤️If you have any questions, please, ask me in the comment section.
Please, support my work with like, thank you!❤️
XBTUSD

Bitcoin (BTC) - August 22Hello?
Welcome, traders.
By "following", you can always get new information quickly.
Please also click "Like".
Have a good day.
-------------------------------------
(US 100 CFD (Nasdaq) 1D Futures Chart)
The key is whether you can support and rise in the 12932.3-13743.5 section.
(ETH.D 1W chart)
For ETH to maintain its uptrend, Dominus needs to be supported and rise in the 18.54-20.13 section.
If not, you need to be careful as the ETH price could plummet.
---------------------------------------------
(BTCUSDT 1W Chart)
Consolidating in the uptrend channel between #2 and #4, we need to see if the price is holding above the 3rd point in the week of September 5th.
If that happens, it is expected to lead to an attempt to break through the MS-Signal indicator.
Below 2, if it falls below 60 SMA, there is a possibility of touching the 1st segment.
(1D chart)
The key is to keep the price above 214750.02 for the period around August 21st - around September 9th.
Holding the price above 214750.02 is expected to lead to an attempt to break through the 23312.42-23810.98 zone.
If the breakout is successful, it is expected to move higher than 25700.0.
If you fail to get support above 21475.02, you can touch the 19946.21-20573.89 section, so be careful.
- You should see if the RSI, Stoch RSI, CCI(9) indicators are starting to break out of the oversold zone.
When you break out of the oversold zone, you should check to see if support is found above 21475.02.
If it fails to move above 22579.68-2275.10, you need to be prepared for it as it could lead to further declines as a bearish rebound.
---------------------------------------
To see support and resistance, you need at least 1-3 days to check the flow.
So, it will take some time to see how it is supported by 21475.02.
Therefore, it is currently the first attempt to rise above 21475.0, so an aggressive buy is possible, but there is a possibility that it may fall below 21475.0, so there must be a countermeasure.
If the 214750.0-21838.98 section is supported and rises, it is expected to rise to the 22579.68-22753.10 section, but it is not known whether it will rise immediately or touch the 214750.0-21838.98 section again and rise again.
So, "Can you support and rise in the 214750.0-21838.98 section?" Asking this is just a subjective opinion.
Even if an analyst is good at matching ups and downs, it's of no use if he can't craft his own trading strategy to follow.
Therefore, you need to practice making your own trading strategies and develop the determination and patience to execute those trading strategies.
Aggressive buying is already buying enough that you won't be hurt by a sharp drop.
Stop Loss is a must for this aggressive buy.
------------------------------------------------------------ -------------------------------------------
** All descriptions are for reference only and do not guarantee a profit or loss in investment.
** The MRHAB-T indicator, which is inactive on the chart, contains indicators that indicate support and resistance points.
** Background color of Long/Short-S indicator: RSI oversold and overbought sections
** Background color of CCI-C indicator: When the short-term CCI line is below -100 and above +100, oversold and overbought sections are displayed.
** The OBV index was re-created by applying a formula to the DepthHouse Trading index, an index disclosed by oh92. (Thanks for this.)
(Short-term Stop Loss can be said to be a point where profit and loss can be preserved or additional entry through split trading. It is a short-term investment perspective.)
---------------------------------

Bitcoin (BTC) - August 21Hello?
Welcome, traders.
If you "follow", you can always get new information quickly.
Please also click "Like".
Have a good day.
-------------------------------------
(BTCUSDTPERP 1D Chart)
As it fell below 23257.6, the MS-Signal indicator turned into a bearish indicator.
For the MS-Signal indicator to turn into an uptrend, it must rise above the 22540.6-22751.0 section.
The key is whether we can move higher than 21481.1, which is starting to show this uptrend.
- The RSI, Stoch RSI, and short-term CCI indicators are all in the oversold zone.
Therefore, it is necessary to check if support is found above 21481.1 when it breaks out of the oversold zone.
If not, you should check to see if it is supported near the 19930.6 point.
------------------------------------------------------------ -------
In order to trade, you must have a trading strategy that suits your investment style.
You must create this trading strategy yourself.
This is because, if you trade with someone else's trading strategy, there is a high possibility that you will close the trade without being able to endure psychological anxiety due to price volatility.
What is important when creating a trading strategy
1. You need to set the investment period.
The trading method differs depending on the investment period, so it is important to think about it before you start buying.
If you cannot set an investment period, you need to set a stop loss point that closes the trade when it falls below a certain point.
And, you must observe the stop loss point.
In this way, you need to prepare an alternative to the loss first and start trading in order to get a steady profit.
To set a stop loss point or a period according to the wave, you should at least be able to see the support and resistance lows on the chart.
There are various indicators necessary to confirm these support and resistance points, so if you find it difficult to set your own points, it is recommended to use the indicators.
(For reference, if you enable the non-use setting of the MRHAB-T indicator used in this chart, indicators that can confirm support and resistance points are displayed.)
2. You need to determine the size of the investment funds.
Once you have decided on the investment period, you need to determine the size of the investment funds.
Therefore, it is important to decide how much of your total investment funds will be invested.
Because it is not an investment in one coin (token), the operation of funds is important.
In addition, it is important to know how much cash you will have in addition to the funds to carry out the transaction.
If you start a trade and keep buying more if the price goes down, or if you use all your money to buy from the beginning, you can easily close the trade because the price fluctuations amplify your psychological anxiety.
Therefore, it is recommended that all trades proceed as split trades.
Therefore, if the price rises after buying, it is necessary to fix the profit by selling in installments at a suitable point.
In order to know where to sell, you can either find the support and resistance points mentioned above, or sell in installments based on the yield (10%, 20%, 30%, ...).
3. You need to decide how to trade.
Once the above-mentioned 1. investment period and 2. investment fund size have been determined, it is necessary to decide how to proceed with the transaction.
therefore,
- How to make money;
- You need to create a split transaction method, etc.
- How to make money
This method has to decide whether to earn cash income or increase the number of holding coins (tokens).
It's usually good to get a cash return, but you need to think carefully when you're in the same price range you're in right now, i.e., the lows and the bottoms.
If you sell (100%) in order to unconditionally make a profit in cash, you are more likely to lose money because you will chase the price when it rises higher and buy it.
Therefore, 1. Depending on the investment period, I think it is good to increase the number of coins (tokens) held when it is not a short-term transaction.
If you can wait for the price to drop after selling 100%, it is good to make a profit in cash, but it is something to think about as most people will have a lot of trouble buying again.
Therefore, the recommended way to increase the number of coins (tokens) I have is to sell at the price including the purchase principal + transaction fee (x2 to x20) when the price rises for each unit price purchased in installments, resulting in a small amount of cash profit and coins (tokens) How to increase the number.
- Split trading method
You need to decide at which point to buy in installments or sell in installments.
To do this, you need to know the points of support and resistance.
You should buy or sell in installments depending on whether you find support or resistance at the support and resistance points.
At this time, what is important is the number of split transactions.
You need to think about this part because you have to decide how many times you want to trade in installments.
This is because if you continue to buy more whenever the price goes down, you run out of cash, which can lead to huge losses.
To do this, it is recommended to purchase additional funds and sell the additionally purchased funds to secure cash when the price rises above the average purchase unit price.
Also, you can use the method of increasing the number of coins (tokens) you have, as mentioned in 3. How to generate revenue in the transaction method.
The reason you trade on the coin market is to make money.
However, the irony is that if you trade for a bigger profit, it is more likely to lead to a big loss.
If you want to make a big profit, you need to find a way to reduce your losses and then start trading.
Since individual investors have limited funds, they have to be very careful about managing their funds.
If your funds don't keep moving, you're losing money somewhere.
- Loss due to retention period;
- Loss of missing new opportunities due to stagnant funds;
- etc
------------------------------------------------------------ -------------------------------------------
** All descriptions are for reference only and do not guarantee a profit or loss in investment.
** The MRHAB-T indicator, which is inactive on the chart, contains indicators that indicate support and resistance points.
** Background color of Long/Short-S indicator: RSI oversold and overbought sections
** Background color of CCI-C indicator: When the short-term CCI line is below -100 and above +100, oversold and overbought sections are displayed.
** The OBV indicator was re-created by applying a formula to the DepthHouse Trading indicator, an indicator disclosed by oh92. (Thanks for this.)
(Short-term Stop Loss can be said to be a point where profit and loss can be preserved or additional entry through split trading. It is a short-term investment perspective.)
---------------------------------

Bitcoin (BTC) - August 20Hello?
Welcome, traders.
If you "follow", you can always get new information quickly.
Please also click "Like".
Have a good day.
-------------------------------------
(BTC.D 1W Chart)
We are approaching the critical section 39.56-40.44.
Therefore, you should be aware of large volatility.
(USDT.D 1D Chart)
The key is whether we can find resistance near 6.80 and move down.
---------------------------------------------
(BTCUSDT 1W Chart)
Consolidating in the uptrend channel between #2 and #4, we need to see if the price is holding above the 3rd point in the week of September 5th.
If that happens, it is expected to lead to an attempt to break through the MS-Signal indicator.
Below 2, if it falls below 60 SMA, there is a possibility of touching the 1st segment.
(1D chart)
The key is whether we can move towards the 21475.02-21838.98 zone, the last support zone to sustain the uptrend.
For that, the movement between around August 21st and September 5th is important.
If you do not quickly ascend to the 21475.02-21838.98 section, you should be cautious as it may fall to the vicinity of 19946.21.
If it rises to the 21475.02-21838.98 section and is supported, the key is whether it can rise above the 23312.42-23810.98 section.
As I said before, the 21475.02 point is the midpoint of the 15916.68-27033.35 section.
Therefore, in order to obtain the upward force, it must be supported in the section 13137.51-15916.68.
Otherwise, if it rises near 21475.02, it is judged that a long sidewalk section is necessary because the power is weak.
- The RSI indicator, the short-term Stoch RSI indicator, and the short-term CCI indicator are all in the oversold zone.
So, the key is whether it is moving above 21475.02, breaking out of the oversold zone.
I think it's better to wait and see until we get out of the oversold zone.
- Among spot trading, we are facing new opportunities from a mid- to long-term investment perspective.
You must have cash to take this opportunity.
- During spot trading, it can be a crisis from a short-term investment perspective.
It is also necessary to have cash to get out of this crisis.
- Those who have entered the 'SHORT' position during margin and futures trading are facing a good opportunity.
Those entering the 'LONG' position or planning to enter the 'LONG' position should proceed with short trades.
In order to set the 'LONG' position as the main position, it is confirmed that it is supported in the section 21475.02-23838.98.
- Cash is required to keep all transactions.
Therefore, it is always important to manage your funds so that you do not run out of cash.
- You trade in the investment market, that is, the coin market in order to get a big profit.
However, ironically, if you trade to make a big profit, you often end up at a loss.
This is because you trade only with the intention of earning big profits.
In order to get a big profit, you must create a countermeasure to reduce the loss and start trading.
Then, naturally, you can earn big profits.
- A full-fledged uptrend is expected to begin when it rises above 29812.52.
So, until then
- From a mid- to long-term point of view, transactions that increase the number of coins (tokens) held are necessary.
- From a short-term perspective, it is better to make profits by shortening the trading period.
- Most of the coins (tokens) are in the low-low range.
Since this trough section is close to the section corresponding to the bottom section, Stop Loss selling 100% is likely to incur a larger loss.
Considering this, it is necessary to make an effort to lower the average purchase price through trading.
------------------------------------------------------------ -------------------------------------------
** All descriptions are for reference only and do not guarantee a profit or loss in investment.
** The MRHAB-T indicator, which is inactive on the chart, contains indicators that indicate support and resistance points.
** Background color of Long/Short-S indicator: RSI oversold and overbought sections
** Background color of CCI-C indicator: When the short-term CCI line is below -100 and above +100, oversold and overbought sections are displayed.
** The OBV indicator was re-created by applying a formula to the DepthHouse Trading indicator, an indicator disclosed by oh92. (Thanks for this.)
(Short-term Stop Loss can be said to be a point where profit and loss can be preserved or additional entry can be made through split trading. It is a short-term investment perspective.)
---------------------------------

Like, why would you buy #crypto now? $BitcoinI mean, if you want to make money, you just don't buy crypto. At least not right now.
You can say whatever you like, but price never lies and this ratio is screaming the truth.
OTC:GBTC / SP:SPX is clearly in a downtrend. At least it needs to breakout from that downward resistance line to even consider go looking for cryptos to buy.
Sure, INDEX:BTCUSD just bounced from resistance $20.000, but if the SP:SPX is outperforming, isn't better just to own stocks? or just being in cash.
This week's actions says it all, crypto needs more work to be done for me to get in.
Is better to wait out this fight and get in when the dust settles and a new uptrend emerges.

Bitcoin Bear Trap!Personal experience tells me we are more then likely to bear trap before any significant dump. The price is more then likely to have retest 25k+ an impulsive swing up possibly before a swing down. Good Luck!

Bitcoin (BTC) - August 19Hello?
Welcome, traders.
If you "follow", you can always get new information quickly.
Please also click "Like".
Have a good day.
-------------------------------------
(BTCUSDTPERP 1D Chart)
If the price is maintained at or above the 23257.6-23804.3 range, it is expected to rise above 25459.8.
Therefore, the main position is 'LONG'.
However, if it falls in the 23257.6-23804.3 section, it may turn into a downtrend, so you need to be careful.
The current uptrend has three support zones.
23257.6-23804.3,
22570.6-22751.0,
21481.1-21826.1
Therefore, I think it is advantageous to trade the 'SHORT' position with a short cut.
- The Stoch RSI indicator is entering the oversold zone.
So, when you break out of the oversold zone, you need to check to see if you're finding support at the 23257.6-23804.3 zone.
(1h chart)
** On the 1h chart, a sharp move is likely to occur, so a short-term response is recommended.
Important sections and points
21481.1-21826.1,
22570.6-22751.0,
23257.6-23804.3,
25459.8
Thus, you can switch positions depending on whether you find support or resistance at this critical point.
In order to ascend, there must be a wiggle up and down in the section 23257.6-23804.3.
You need to check the flow of 1-3 days to confirm that you are getting support and resistance.
So, making sure you get support and resistance takes patience.
------------------------------------------------------------ -----------------------------------------------------
** All descriptions are for reference only and do not guarantee a profit or loss in investment.
** The MRHAB-T indicator, which is inactive on the chart, contains indicators that indicate support and resistance points.
** Background color of Long/Short-S indicator: RSI oversold and overbought sections
** Background color of CCI-C indicator: When the short-term CCI line is below -100 and above +100, oversold and overbought sections are displayed.
** The OBV indicator was re-created by applying a formula to the DepthHouse Trading indicator, an indicator disclosed by oh92. (Thanks for this.)
(Short-term Stop Loss can be said to be a point where profit and loss can be preserved or additional entry through split trading. It is a short-term investment perspective.)
---------------------------------

BITCOIN - WEDGE = CHANNEL, BOTTOM AT 20 KWhen everybody see break down of the rising wedge I see potential channel with bottom around 20 k.
If we get there strong higher low then it would be very bullish in long term. We should consolidate to the upper band and break to the upside starting parabolic growth.

BITCOIN (BTCUSD): Sudden Breakout & Important Update ₿
So it turned out that Bitcoin broke and closed below a rising trend line yesterday.
The broken trend line turned into a vertical resistance now.
I believe that the market may go lower now.
Next support - 22670
❤️If you have any questions, please, ask me in the comment section.
Please, support my work with like, thank you!❤️

Bitcoin (BTC) - August 18hello?
Welcome, traders.
If you "follow", you can always get new information quickly.
Please also click "Like".
Have a good day.
-------------------------------------
(BTCUSDT 1D Chart)
Primary resistance: around 25K
Secondary resistance: 27K-29K
1st support: 23312.42-23810.98
2nd support: 22579.68-22753.10
If support is found in the 23312.42-23810.98 section, an attempt to rise above 25700.0 is expected to continue.
If it falls below the 22579.68-22753.10 section, it may turn into a downtrend, so you should think about countermeasures.
(1h chart)
** On the 1h chart, a sharp move is likely to occur, so a short-term response is recommended.
The important points are:
21475.02-21838.98,
22579.68-22753.10,
23312.42-23810.98,
24305.25,
25700.0
The 23312.42-23810.98 section is the 3rd support section to maintain an uptrend, so if it is supported, it is expected to have the strength to rise above 25700.0.
However, you need to be careful as you can temporarily touch around 22753.10.
At this point, if it fails to move above 23312.42 quickly, it could lead to further declines.
------------------------------------------------------------ -------------------------------------------
** All descriptions are for reference only and do not guarantee a profit or loss in investment.
** The MRHAB-T indicator, which is inactive on the chart, contains indicators that indicate support and resistance points.
** Background color of Long/Short-S indicator: RSI oversold and overbought sections
** Background color of CCI-C indicator: When the short-term CCI line is below -100 and above +100, oversold and overbought sections are displayed.
** The OBV indicator was re-created by applying a formula to the DepthHouse Trading indicator, an indicator disclosed by oh92. (Thanks for this.)
(Short-term Stop Loss can be said to be a point where profit and loss can be preserved or additional entry can be made through split trading. It is a short-term investment perspective.)
---------------------------------

BTC Wyckoff AccumulationHey guys as you can see Btc is forming a Wyckoff Acculumation !!
IMO Buying from here now is totally safe ...
We can also notice that Btc formed the same structure in the end of 2018 so there is a big similarity in two charts and here is the link to 2018 Wyckoff event
That's what I see for BTC and remember always DYOR

Bitcoin (BTC) - August 17Hello?
Welcome, traders.
By "following", you can always get new information quickly.
Please also click "Like".
Have a good day.
-------------------------------------
(BTCUSDTPERP 1D Chart)
The highs are being updated.
Therefore, if the price is maintained at or above the 23257.6-23804.3 range, it is expected to rise above 25459.8.
If it declines in the 23257.6-23804.3 section, there is a possibility that it will turn into a downtrend.
However, if it is supported in the 23257.6-23804.3 section, it is expected to rise above 25459.8.
Therefore, the main position is 'LONG'.
Therefore, if you enter the 'SHORT' position, I think it is advantageous to trade short.
(1h chart)
** On the 1h chart, a sharp move is likely to occur, so a short-term response is recommended.
the important point is
21826.1,
22570.6,
23257.6,
23804.3,
25459.8
Thus, you can switch positions depending on whether you find support or resistance at this critical point.
------------------------------------------------------------ -------------------------------------------
** All descriptions are for reference only and do not guarantee a profit or loss in investment.
** The MRHAB-T indicator, which is inactive on the chart, contains indicators that indicate support and resistance points.
** Background color of Long/Short-S indicator: RSI oversold and overbought sections
** Background color of CCI-C indicator: When the short-term CCI line is below -100 and above +100, oversold and overbought sections are displayed.
** The OBV indicator was re-created by applying a formula to the DepthHouse Trading indicator, an indicator disclosed by oh92. (Thanks for this.)
(Short-term Stop Loss can be said to be a point where profit and loss can be preserved or additional entry can be made through split trading. It is a short-term investment perspective.)
---------------------------------

BTCUSDT - showing bearish signs..BTCUSDT
price is contracting between two trendlines, if price price makes a bearish break of the structure then after a pullback if price shows rejection, I expect the price to move lower..
Trade Wisely
*The content on this analysis is subject to change at any time without notice, and is provided for the sole purpose of assisting traders to make independent investment decisions.

Bitcoin Remains BearishIf daily candles close red we can expect a stronger probability of a continued bear trend. The price will likely take a much more extended period to recover and the bottom will be obvious, there is no strong reason to FOMO bullish just yet. Trade at your own risk.

BITCOIN (BTCUSD): Key Resistance Ahead! Your Plan:
As I predicted, Bitcoin successfully reached 25.000 level.
Being a solid resistance, the next bearish wave may initiate from that structure.
Even though the market is bullish this summer, remember that it is trading in a global bearish trend.
To catch a bearish trend continuation, watch a bearish flag pattern on a daily time frame.
Its bearish breakout (daily candle close below its support) will trigger a strong selling reaction.
Alternatively, a bullish breakout of the underlined resistance may trigger a further bullish continuation.
The next resistance on focus will be 28000 - 28900 area.
Good luck!
❤️If you have any questions, please, ask me in the comment section.
Please, support my work with like, thank you!❤️

Bitcoin (BTC) - August 16Hello?
Welcome, traders.
If you "follow", you can always get new information quickly.
Please also click "Like".
Have a good day.
-------------------------------------
(BTCUSDT 1W Chart)
The key is whether it can rise to the diagonal Fibonacci section.
- When the Stoch RSI indicator and the short-term CCI indicator are out of the overbought zone, it is necessary to check where support and resistance are found.
The interval 27033.35-29812.52 is the interval that determines the trend.
Therefore, if it rises to this section and falls without support, it is likely to show a downtrend.
(1D chart)
It is rising with higher highs and lower lows.
However, you need to be careful as the fluctuations are decreasing during the uptrend, which may cause large volatility that is different from before.
So, if it goes up with volatility, I would expect it to rise above 25700.
A prerequisite for this rise is to hold the price at or above the 23312.42-23810.98 range.
1st resistance: around 25K
2nd resistance: 27K-29K
1st support: 23312.42-23810.98
2nd support: 22579.68-22753.10
If it falls below the 22579.68-22753.10 section, it may turn into a downtrend, so you should think about countermeasures.
------------------------------------------------------------ -------------------------------------------
** All descriptions are for reference only and do not guarantee a profit or loss in investment.
** The MRHAB-T indicator, which is inactive on the chart, contains indicators that indicate support and resistance points.
** Background color of Long/Short-S indicator: RSI oversold and overbought sections
** Background color of CCI-C indicator: When the short-term CCI line is below -100 and above +100, oversold and overbought sections are displayed.
** The OBV indicator was re-created by applying a formula to the DepthHouse Trading indicator, an indicator disclosed by oh92. (Thanks for this.)
(Short-term Stop Loss can be said to be a point where profit and loss can be preserved or additional entry can be made through split trading. It is a short-term investment perspective.)
---------------------------------

Bitcoin (BTC) - August 15hello?
Welcome, traders.
If you "follow", you can always get new information quickly.
Please also click "Like".
Have a good day.
-------------------------------------
(BTCUSDTPERP 1D Chart)
The highs are being updated.
Therefore, if the price is maintained at or above the 23257.6-23804.3 range, it is expected to rise above 25459.8.
If the price holds above the 22570.6-22751.0 interval or moves along an uptrend line, it is expected to maintain an uptrend.
Therefore, the main position is 'LONG'.
(1h chart)
** On the 1h chart, a sharp move is likely to occur, so a short-term response is recommended.
the important point
21826.1,
22570.6,
23257.6,
23804.3,
25459.8
Thus, you can switch positions depending on whether you find support or resistance at this critical point.
However, since I mentioned that the main position is 'LONG' in the 1D chart description, it is recommended to trade short when selecting the 'SHORT' position.
------------------------------------------------------------ -------------------------------------------
** All descriptions are for reference only and do not guarantee a profit or loss in investment.
** The MRHAB-T indicator, which is inactive on the chart, contains indicators that indicate support and resistance points.
** Background color of Long/Short-S indicator: RSI oversold and overbought sections
** Background color of CCI-C indicator: When the short-term CCI line is below -100 and above +100, oversold and overbought sections are displayed.
** The OBV indicator was re-created by applying a formula to the DepthHouse Trading indicator, an indicator disclosed by oh92. (Thanks for this.)
(Short-term Stop Loss can be said to be a point where profit and loss can be preserved or additional entry can be made through split trading. It is a short-term investment perspective.)
---------------------------------

Bitcoin (BTC) - August 14Hello?
Welcome, traders.
If you "follow", you can always get new information quickly.
Please also click "Like".
Have a good day.
-------------------------------------
(BTCUSDT 1D Chart)
Primary resistance: around 25K
Secondary resistance: 27K-29K
1st support: 23312.42-23810.98
2nd support: 22579.68-22753.10
If the price is maintained above the 22579.68-22753.10 range, it is expected to maintain an uptrend.
If support is found at or above the 23312.42-23810.98 zone, I would expect a break above 25K.
If it falls below the 22579.68-22753.10 section, it may turn into a downtrend, so you should think about countermeasures.
------------------------------------------------------------ -------------------------------------------
** All descriptions are for reference only and do not guarantee a profit or loss in investment.
** The MRHAB-T indicator, which is inactive on the chart, contains indicators that indicate support and resistance points.
** Background color of Long/Short-S indicator: RSI oversold and overbought sections
** Background color of CCI-C indicator: When the short-term CCI line is below -100 and above +100, oversold and overbought sections are displayed.
** The OBV indicator was re-created by applying a formula to the DepthHouse Trading indicator, an indicator disclosed by oh92. (Thanks for this.)
(Short-term Stop Loss can be said to be a point where profit and loss can be preserved or additional entry can be made through split trading. It is a short-term investment perspective.)
---------------------------------

Bitcoin (BTC) - August 13hello?
Welcome, traders.
If you "follow", you can always get new information quickly.
Please also click "Like".
Have a good day.
-------------------------------------
(BTCUSDTPERP 1D Chart)
If the price holds above the 22570.6-22751.0 interval or moves along an uptrend line, it is expected to maintain an uptrend.
Therefore, the main position is 'LONG'.
(1h chart)
** On the 1h chart, a sharp move is likely to occur, so a short-term response is recommended.
the important point
21826.1,
22570.6,
23257.6,
23804.3,
25459.8
Thus, you can switch positions depending on whether you find support or resistance at this critical point.
However, since I mentioned that the main position is 'LONG' in the 1D chart description, it is recommended to trade short when selecting the 'SHORT' position.
------------------------------------------------------------ -------------------------------------------
** All descriptions are for reference only and do not guarantee a profit or loss in investment.
** The MRHAB-T indicator, which is inactive on the chart, contains indicators that indicate support and resistance points.
** Background color of Long/Short-S indicator: RSI oversold and overbought sections
** Background color of CCI-C indicator: When the short-term CCI line is below -100 and above +100, oversold and overbought sections are displayed.
** The OBV indicator was re-created by applying a formula to the DepthHouse Trading indicator, an indicator disclosed by oh92. (Thanks for this.)
(Short-term Stop Loss can be said to be a point where profit and loss can be preserved or additional entry through split trading. It is a short-term investment perspective.)
---------------------------------

Bitcoin (BTC) - August 12Hello?
Welcome, traders.
If you "follow", you can always get new information quickly.
Please also click "Like".
Have a good day.
-------------------------------------
(BTCUSDT 1D Chart)
Primary resistance: around 25K
Secondary resistance: 27K-29K
1st support: 22579.68-22753.10
2nd support: 21475.02-21838.98
If the price is maintained above the 22579.68-22753.10 range, it is expected to maintain an uptrend.
- The RSI indicator entered the overbought zone, but the Stoch RSI did not enter the overbought zone.
Accordingly, it is necessary to check at which point the RSI finds support and resistance when it moves out of the overbought zone.
If support is found at or above the 23312.42-23810.98 zone, I would expect a break above 25K.
If it falls below the 22579.68-22753.10 range, it may turn into a downtrend, so you should think about countermeasures.
(1h chart)
** On the 1h chart, a sharp move is likely to occur, so a short-term response is recommended.
The sections marked with ovals and the sections marked with square boxes are support and resistance sections.
Therefore, a rebound or reversal is likely to occur during this period.
the important point
21838.98,
22579.68,
23312.42,
It is 23810.98.
The main position is 'LONG' as it is maintaining an upward trend on the 1D chart.
When deciding on a position, it is important what criteria you use to decide.
These standards should include countermeasures against forced liquidation.
Therefore, holding cash is important even in perpetual futures trading.
If you have used all your funds without holding cash, it is important to secure cash by selling quickly in installments.
I mentioned that in spot trading, a trading strategy that can reduce losses is more important than trading for profit.
The same is true for perpetual futures trading.
However, the only difference is that leverage and forced liquidation exist, so a more aggressive strategy is required.
Therefore, a quick decision is required to close a position, convert, or stop loss.
A way to complement this decision is leverage ratio adjustment and investment size.
If you continue to face the threat of forced liquidation after entering a position, we recommend adjusting your leverage ratio and adjusting your investment size.
------------------------------------------------------------ -------------------------------------------
** All descriptions are for reference only and do not guarantee a profit or loss in investment.
** The MRHAB-T indicator, which is inactive on the chart, contains indicators that indicate support and resistance points.
** Background color of Long/Short-S indicator: RSI oversold and overbought sections
** Background color of CCI-C indicator: When the short-term CCI line is below -100 and above +100, oversold and overbought sections are displayed.
** The OBV indicator was re-created by applying a formula to the DepthHouse Trading indicator, an indicator disclosed by oh92. (Thanks for this.)
(Short-term Stop Loss can be said to be a point where profit and loss can be preserved or additional entry through split trading. It is a short-term investment perspective.)
---------------------------------

CRYPTO - TOTAL MARKET CAP 2It's truly amazing how total market cap excluding btc runs in perfect channels.
So far we can see we are trnding up and first natural target is the main trend line which is aso the upper line of descending channel.
There I expect longer september correction which can lead us to the second touch of the lower band of our huge channel.
Making hgher low there would be imo very bullish for the nearest future.

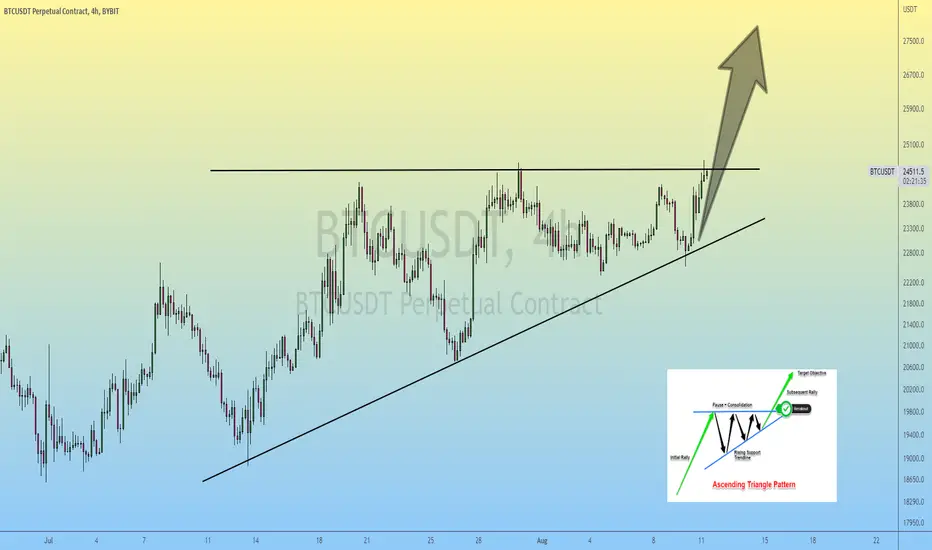
Bitcoin | Ascending Triangle Formation..!!
#BITCOIN is forming Ascending Triangle in 4H timeframe.
If 4H Candle Closed above the $24,560, Expecting +20-25% Bullish Rally.
C'moon Bulls, Send it 🚀🚀
Please like the idea for Support & Subscribe for More ideas like this and share your ideas and charts in Comments Section..!!
Thanks for Your Love & Support..!!
Bitcoin (BTC) - August 11Hello?
Welcome, traders.
If you "follow", you can always get new information quickly.
Please also click "Like".
Have a good day.
-------------------------------------
(BTCUSDTPERP 1h Chart)
** On the 1h chart, a sharp move is likely to occur, so a short-term response is recommended.
The box section is the support and resistance section.
You should hold the price above 23804.3 and see if it can move higher than 24099.8.
- In the CCI-C indicator, if the CCI line is maintained above the EMA line, it is likely to rise.
If it declines from 23804.3,
1st support: 23257.6
2nd support: 22570.6
The main position is 'LONG' as it is maintaining an upward trend on the 1D chart.
To convert into a downtrend on the 1D chart, it should break below 22570.6 and the MS-Signal indicator should turn into a bearish indicator.
------------------------------------------------------------ -------------------------------------------
** All descriptions are for reference only and do not guarantee a profit or loss in investment.
** The MRHAB-T indicator, which is inactive on the chart, contains indicators that indicate support and resistance points.
** Background color of Long/Short-S indicator: RSI oversold and overbought sections
** Background color of CCI-C indicator: When the short-term CCI line is below -100 and above +100, oversold and overbought sections are displayed.
** The OBV indicator was re-created by applying a formula to the DepthHouse Trading indicator, an indicator disclosed by oh92. (Thanks for this.)
(Short-term Stop Loss can be said to be a point where profit and loss can be preserved or additional entry through split trading. It is a short-term investment perspective.)
---------------------------------
