Bitcoin | Just Buy the DIP..!!
Bitcoin Bears have been in Complete Control Since November 2021 (+60% Correction so far)
Seems like Bitcoin is Bottomed out & this is the last DIP Before #BullRun2022 🚀
Bitcoin has been Consolidating in Falling Wedge Since January 2021.
Bitcoin Bulls need to Reclaim the 38k Resistance to Confirm the Wedge Breakout..🆙
Keep in mind that Always wait for Breakout & Candle to Close for Confirmation..
Bitcoin RSI is Printing Massive Bullish Divergence (Which is Bullish Sign) in Daily timeframe Chart.
Bitcoin Bulls Have been Defending the Crucial Support Are (28-30k) from last few Days & Bitcoin Could Bounce Back anytime so Keep Buying the Dips & Just HODL Bitcoin .. (You'll Thank me Later)
Please like the idea for Support & Subscribe for More ideas like this and share your ideas and charts in Comments Section..!!
Thanks for Your Love & Support..!!
XBTUSD

btc 5-24 update ~good evening,
---
main idea is still in tact,
currently working on a little b wave;
---
>1h hidden bear confirmed,
>decreasing vol,
~typical wave-b behavior.
---
looking for one more little dip down to 27.9k, before the larger move up come to end this month.

Bitcoin (BTC) - May 26hello?
Traders, welcome.
If you "follow", you can always get new information quickly.
Please also click "Like".
Have a nice day.
-------------------------------------
(BTCUSDTPERP 1D Chart)
Primary resistance: around 32275.6
Secondary resistance: around 35280.2
Support: 27054.1-29840.6
The 27054.1-29840.6 zone is an important support and resistance zone.
The key is whether the 27054.1-29840.6 zone can support and move up.
In particular, you should see support at the 28951.7-29840.6 section and see if it rises above 30437.0.
This is because the MS-Signal indicator is approaching the 30437.0 point.
Volatility is expected as it is expected to touch the MS-Signal indicator in the near future.
I think this volatility will create a trend.
The next volatility period is around June 5th.
(1h chart)
** A short-term response is recommended as sharp movements are likely to occur on the 1h chart.
The section 28951.7-29840.6 passes the CCI -100 point.
Therefore, it is important to keep the price above the 28951.7-29840.6 interval.
However, since the 27054.1-29840.6 section is a strong support section, it may temporarily touch the 27054.1 area and rise, so careful trading is required.
------------------------------------------------------------ -----------------------------------------------------
** All indicators are lagging indicators.
Therefore, it is important to be aware that the indicator will move accordingly as price and volume move.
However, for convenience, we are talking in reverse for the interpretation of the indicator.
** The MRHAB-T indicator used in the chart is an indicator of our channel that has not been released yet.
** The OBV indicator was re-created by applying a formula to the DepthHouse Trading indicator, an indicator disclosed by oh92. (Thanks for this.)
** Support or resistance is based on the closing price of the 1D chart.
** All descriptions are for reference only and do not guarantee a profit or loss in investment.
(Short-term Stop Loss can be said to be a point where profit and loss can be preserved or additional entry can be made through split trading. It is a short-term investment perspective.)
---------------------------------

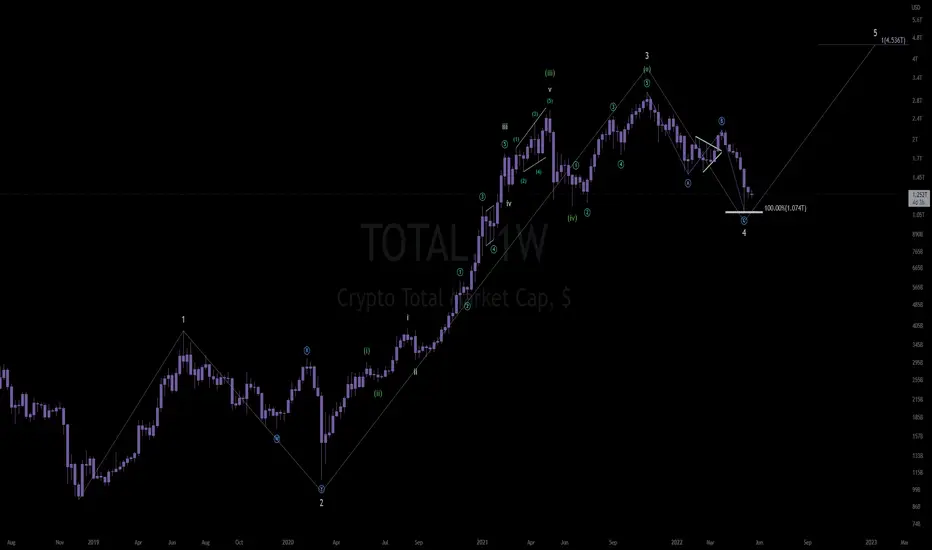
it's going to take some time,it's going to take some time, but i think we're in the process of forming a significant bottom in the crypto market.
we can certainly go lower, and i am pretty much expecting it (so is everyone else),
but i think there's a possibility that the bottom could be in.
there's no real way to know, but i have this feeling.
----
everyone wants 20k, but what if we don't get it?
think about it.
✌
Wave 5 target = $136k

a completed count.the total crypto market cap suggests that a long term bottom could be in.
this doesn't mean that it can't go lower; but history suggests that this could be the bottom.
if a bottom is indeed in, we're going to see a significant bull run in the months ahead, which takes the total market cap up to around 4.5 trillion $.
---
we're going to need some kind of catalyst to make this happen, and it won't come overnight, but i've started to position myself into longer term holds.
still about 80% cash, and i'm ready for lower prices just in case.
Bitcoin (BTC) - May 25hello?
Traders, welcome.
If you "follow", you can always get new information quickly.
Please also click "Like".
Have a nice day.
-------------------------------------
(BTCUSDT 1W Chart)
Resistance: around 38150.02
Strong support: 27033.35-29812.52
The key is whether you can get support in the section 27033.35-29812.52.
From a mid- to long-term perspective, it needs to rise above 38150.02 to continue the uptrend.
(1D chart)
Primary resistance: around 32259.90
Secondary resistance: around 35045.0
Strong support: 27033.35-29812.52
- 28923.63-29812.52
- Around 27033.35
The key is to find support at the 28923.63-29812.52 zone and move higher than 30444.93.
If it moves lower from 28923.63, they should check to see if support is found near 27033.35.
The MS-Signal indicator is expected to touch down in the not-too-distant future.
When you touch the MS-Signal indicator, volatility is expected to occur, so it is recommended to think of a strategy in advance.
The next volatility period is around June 5th.
------------------------------------------------------------ -----------------------------------------------------
** All indicators are lagging indicators.
Therefore, it is important to be aware that the indicator will move accordingly as price and volume move.
However, for convenience, we are talking in reverse for the interpretation of the indicator.
** The MRHAB-T indicator used in the chart is an indicator of our channel that has not been released yet.
** The OBV indicator was re-created by applying a formula to the DepthHouse Trading indicator, an indicator disclosed by oh92. (Thanks for this.)
** Support or resistance is based on the closing price of the 1D chart.
** All descriptions are for reference only and do not guarantee a profit or loss in investment.
(Short-term Stop Loss can be said to be a point where profit and loss can be preserved or additional entry can be made through split trading. It is a short-term investment perspective.)
---------------------------------

(short term bear theory)i've been talking about this idea for quite awhile now, and it still remains on the table as btc flags down here.
every attempt to move up, btc gets overbought right away \ price gets pushed back down.
price is starting to contract, indicative that we could in theory be in a triangle for this sub-wave 4.
currently working on wave e (the final leg).
---
bearish invalidation(for this triangle idea): 30654.5
bearish confirmation upon a breakdown.

Bitcoin is Ready to Bounce Back..!!
#BTC (Midterm Analysis)
Bitcoin Bears Have been in Complete Control since NOV 2021.. (+60% Correction so far)
Seems like Bitcoin has Already bottomed out & is Ready to Bounce Back..
Expecting a New All Time High in Q3 ✍️
Please like the idea for Support & Subscribe for More ideas like this and share your ideas and charts in Comments Section..!!
Thanks for Your Love & Support..!!

Btc 5-23 updategood afternoon;
---
btc looks to be playing out a double combo in this general region.
a double combo is a series of three wave moves which are labeled as a w-x-y.
each leg in a double combo consists of either an abc, or a wxy. (it could also contain a triangle, but they're a bit more rare).
---
i'd be expecting a 3 wave move which takes btc down to around 27.8k to complete wave (x)
followed by another 3 wave move which takes us up to 33k to complete wave (y)
after which, i do believe it falls off a cliff again.
---
the new moon lands on may 30th this month;
historically speaking, the new moons have called every single top in this bear market to date.
it may have missed one, so 95% accuracy thus far.
👇
---
ps. it's also possible btc simply just dumps it from here, so watch the reaction from the level on my chart. if it starts flipping it to resistance, watch for a move down to around 24k - as talked about in my previous post:

Bitcoin (BTC) - May 24hello?
Traders, welcome.
By "following", you can always get new information quickly.
Please also click "Like".
Have a nice day.
-------------------------------------
(BTCUSDTPERP 1D Chart)
Primary resistance: around 32275.6
Secondary resistance: around 35280.2
Support: 27054.1-29840.6
The 27054.1-29840.6 zone is an important support and resistance zone.
The key is whether the 27054.1-29840.6 zone can support and move up.
It needs to move above 32275.6 to find support in order to turn into an uptrend.
It is showing a failure to rise above the 30437.0 point, which is the MACD-P indicator.
Accordingly, if it rises above 30437.0, it is expected to rise above 32275.6.
In the current flow, I think it is meaningful to find support in the 28951.7-29840.6 section.
The reason is that the -100 point (29274.3) of the CCI is marked.
(1h chart)
** A short-term response is recommended as sharp movements are likely to occur on the 1h chart.
Section 28951.7-29840.6 passes CCI-100 point.
Therefore, it is important to keep the price above the 28951.7-29840.6 interval.
However, since the 27054.1-29840.6 section is a strong support section, it may temporarily touch the 27054.1 area and rise, so careful trading is required.
------------------------------------------------------------ -----------------------------------------------------
** All indicators are lagging indicators.
Therefore, it is important to be aware that the indicator will move accordingly as price and volume move.
However, for the sake of convenience, we are talking in reverse for the interpretation of the indicator.
** The MRHAB-T indicator used in the chart is an indicator of our channel that has not been released yet.
** The OBV indicator was re-created by applying a formula to the DepthHouse Trading indicator, an indicator disclosed by oh92. (Thanks for this.)
** Support or resistance is based on the closing price of the 1D chart.
** All descriptions are for reference only and do not guarantee a profit or loss in investment.
(Short-term Stop Loss can be said to be a point where profit and loss can be preserved or additional entry can be made through split trading. It is a short-term investment perspective.)
---------------------------------

Bitcoin Analyze (Short Term, Timeframe 15min)!!!Bitcoin Was able to Complete wave C By Ending Expanding Diagonal . My chart shows microwave 5 of wave C made in my TRZ (Time Reversal Zone) & PRZ (Price Reversal Zone). Also, We can see Regular Divergence ( RD- ) between MACD Indicator and Price .
As a result, I expect that when BTC breaks my Ascending Channel , it will go DOWN at least to 29650$ .
Bitcoin Analyze ( BTCUSDT ) Timeframe 15 Min⏰
Do not forget to put Stop loss for your positions (For every position you want to open).
Please follow your strategy , this is just my idea, and I will be glad to see your ideas in this post.
Please do not forget the ✅' like '✅ button 🙏😊 & Share it with your friends; thanks, and Trade safe.

Bitcoin (BTC) - May 23hello?
Traders, welcome.
By "following", you can always get new information quickly.
Please also click "Like".
Have a nice day.
-------------------------------------
(BTCUSDT 1W Chart)
Resistance: around 38150.02
Strong support: 27033.35-29812.52
The key is whether you can get support in the section 27033.35-29812.52.
From a mid- to long-term perspective, it needs to rise above 38150.02 to continue the uptrend.
(1D chart)
Primary resistance: around 32259.90
Secondary resistance: around 35045.0
Strong support: 27033.35-29812.52
- 28923.63-29812.52
- Around 27033.35
It needs to move above 32259.9 to turn into an uptrend.
Accordingly, the increase in trading volume (over 88.696K) should continue.
We should see if there is an attempt to move higher above 32259.90 while holding the price above 29812.52.
Currently, the price is rising as the volume is decreasing.
In this case, if the selling price increases even a little, a sharp decline can occur, so careful trading is required.
The next volatility period is around June 5th.
------------------------------------------------------------ -----------------------------------------------------
** All indicators are lagging indicators.
Therefore, it is important to be aware that the indicator will move accordingly as price and volume move.
However, for the sake of convenience, we are talking in reverse for the interpretation of the indicator.
** The MRHAB-T indicator used in the chart is an indicator of our channel that has not been released yet.
** The OBV indicator was re-created by applying a formula to the DepthHouse Trading indicator, an indicator disclosed by oh92. (Thanks for this.)
** Support or resistance is based on the closing price of the 1D chart.
** All descriptions are for reference only and do not guarantee a profit or loss in investment.
(Short-term Stop Loss can be said to be a point where profit and loss can be preserved or additional entry can be made through split trading. It is a short-term investment perspective.)
---------------------------------

This idea remains highly probable.If this was to take place, it could be counted as a completed third leg in the wedge which I've been discussing recently.
I'm really not satisfied with the price action over this last week; and it really does look to me like a phase of re-distribution -> which is why I've put myself on the sidelines for the time being.
Until I can conclusively eliminate this idea, I'll be 100% cash.
----
w5 target = 24k.
----
ps. i have this little indicator which has been calling out every single top in this downtrend.
Whenever it clusters the way that it's doing right now, it has led to a fairly large descent in the days which followed.
✌

Bitcoin (BTC) - May 22 (RSI Indicator)hello?
Traders, welcome.
By "following", you can always get new information quickly.
Please also click "Like".
Have a nice day.
-------------------------------------
(BTCUSD 1M Chart)
The RSI line is approaching an all-time low.
(1W chart)
The RSI line is falling below the low of the week of March 9, 2020.
(1D chart)
The lowest RSI since BTC price hit ATH was January 20, 2022.
If the current price moves sideways, we expect the 1W chart to break out of the RSI oversold zone in the near future.
I think this movement can be interpreted as a movement to get out of the floor section.
However, it is important to check whether the RSI finds support in the 27K-29K range, as the RSI may fail to move higher after exiting the oversold zone and may lead to further declines.
------------------------------------------------------------ -------------------------------------------
** All indicators are lagging indicators.
Therefore, it is important to be aware that the indicator will move accordingly as price and volume move.
However, for the sake of convenience, we are talking in reverse for the interpretation of the indicator.
** The MRHAB-T indicator used in the chart is an indicator of our channel that has not been released yet.
** The OBV indicator was re-created by applying a formula to the DepthHouse Trading indicator, an indicator disclosed by oh92. (Thanks for this.)
** Support or resistance is based on the closing price of the 1D chart.
** All descriptions are for reference only and do not guarantee a profit or loss in investment.
(Short-term Stop Loss can be said to be a point where profit and loss can be preserved or additional entry can be made through split trading. It is a short-term investment perspective.)
---------------------------------

btc 5-21 update ~hello's
if the spx500 is indeed working on a diagonal, as shared in my last post(view at the bottom of this thread);
then i think this is the highest probability path for bitcoin to take.
a choppy 3 wave move which goes on for a few weeks, before seeing the final leg down to 22~23k.
---
wave 4 could go a bit higher than my current projection, but it would need to maintain the structure of a contracting wedge, and it would also have to get into the territory of wave 2 for it to play out as planned.
(i'm able to move the upper portion of the wedge out a bit to rhyme with the 0.50% retracement at around 35k.)
will continue to monitor it as the days go by.
---
ps. if i'm right about this idea, the corrective phase could come to an end at 22k by the end of july.
---
spx500 diagonal 👇

Bitcoin Manipulation
I think I got this correction set out.
Looks like an accumulation for a bull trap and a move down.

Bitcoin | Bullrun 2022 is loading..!!
#Bitcoin (Price Analysis)
Since 9th November 2021, Bitcoin Bears Have been in Complete Control & till now, Bitcoin Price has Dropped +50% since All time High.
Now, Seems like Bitcoin has Bottomed out & Getting Ready for Another Bullrun like Jul-Nov 2021..
Bitcoin RSI is Printing Massive Bullish Divergence (Which is Bullish Sign) in Daily timeframe Chart.
Bitcoin Bulls Have been Defending the Crucial Support Are (28-30k) from last few Days & Bitcoin Could Bounce Back anytime so Keep Buying the Dips & Just HODL Bitcoin.. (You'll Thank me Later)
BullRun2022 is Loading so Don't sell Your Bitcoin to Whales..
In the Weekly timeframe Chart, Bitcoin Bulls defending the Crucial Support line (29k).
In daily timeframe Chart, MACD Just Confirm the Bullish Cross..
Please like the idea for Support & Subscribe for More ideas like this and share your ideas and charts in Comments Section..!!
Thanks for Your Love & Support..!!

late night thoughts,🌙
take a peak at this weekly channel:
notice all of the points of confluence, and pay attention to how the previous levels of support have turned into resistance levels.
now that bitcoin has successfully fallen out of the weekly channel,
the lower portion of it has in theory now become a significant level of resistance.
order books are stacked to the brim with sell orders all around that little red line.
there's a really good chance bitcoin continues to consolidate for awhile before it tests it \ drops lower.
keep an eye on the line, it is an important one.

Bitcoin (BTC) - May 21hello?
Traders, welcome.
If you "follow", you can always get new information quickly.
Please also click "Like".
Have a nice day.
-------------------------------------
(BTCUSDTPERP 1D Chart)
Primary resistance: around 32275.6
Secondary resistance: around 35280.2
Support: 27054.1-29840.6
The 27054.1-29840.6 zone is an important support and resistance zone.
The key is whether the 27054.1-29840.6 zone can support and move up.
To convert into an uptrend, it needs to move above 32275.6 to find support.
The volatility period is around June 5th.
(1h chart)
** A short-term response is recommended as sharp movements are likely to occur on the 1h chart.
The section 28951.7-29840.6 passes the CCI -100 point.
Therefore, it is important to keep the price above the 28951.7-29840.6 interval.
However, since the 27054.1-29840.6 section is a strong support section, it may temporarily touch the 27054.1 area and rise, so careful trading is required.
------------------------------------------------------------ -----------------------------------------------------
** All indicators are lagging indicators.
Therefore, it is important to be aware that the indicator will move accordingly as price and volume move.
However, for convenience, we are talking in reverse for the interpretation of the indicator.
** The MRHAB-T indicator used in the chart is an indicator of our channel that has not been released yet.
** The OBV indicator was re-created by applying a formula to the DepthHouse Trading indicator, an indicator disclosed by oh92. (Thanks for this.)
** Support or resistance is based on the closing price of the 1D chart.
** All descriptions are for reference only and do not guarantee a profit or loss in investment.
(Short-term Stop Loss can be said to be a point where profit and loss can be preserved or additional entry can be made through split trading. It is a short-term investment perspective.)
---------------------------------

"The Bear Case Part 2"My previous post was a very optimistic outlook.
The market might turn into full savage mode \ not even give the longs a chance to exit their positions, but instead create a massive liquidation event instead.
Right now, longs are leveraged at levels unseen before.
Historical highs on long leverage.
If I was market maker 😏,
I'd liquidate every last one of them,
just so I could get the best possible price for the next bull run.
😈
Some say buy when everyone is fearful,
others say short the ponzi.
---
Primary Tech macro 👇

"The Bear Case"Real quick,
If the top is indeed in(which i'm not saying it is), I would expect a decline to around 10k on Bitcoin (could go as low as 3k).
The path that it takes to get down there is still unclear, but it will become very clear as more data presents itself.
---
I'll be 100% honest with you all, i can care less about which direction the market goes. I make money in either direction, and have 0 attachment to either side.
There is an infinite amount of possibilities in the market, and this is just one of thousands.
Don't use this post to make any kind of financial decision, for I am not a financial advisor, and this is not financial advice.
Do your own research, make your own decisions, and approach the market with your own unique strategy.
Just because i am bearish right now, does not mean that you too should be bearish.
This is merely a theory, based on a hundred different factors that are currently at play in the world.
🥂

Bitcoin Analyze (Double Three Correction)!!!Hi, Bitcoin wants to complete its main wave 4 by Double three Correction. It was able to pass microwave W & X with Zigzag Corrections. The Structure of microwave Y can be Flat/ Triangle / Zigzag. Also, I tried to show you the targets of the end of microwave Y or main wave 4 in my chart.
Bitcoin Analyze ( BTCUSDT ) Timeframe 1H⏰
Where is the end of main wave 4 ❗️❓
🎯Target🎯: 32270$ until 31700$ (More Possible)
🎯Target🎯: 33880$ until 33320$
🟢Heavy Support zone: 30580$ until 29100$ (Support + Cluster of Fibs + Important Support Line)
Do not forget to put Stop loss for your positions (For every position you want to open).
Please follow your strategy, this is just my idea, and I will be glad to see your ideas in this post.
Please do not forget the ✅' like'✅ button 🙏😊 & Share it with your friends; thanks, and Trade safe.

Bitcoin (BTC) - May 20hello?
Traders, welcome.
By "following", you can always get new information quickly.
Please also click "Like".
Have a nice day.
-------------------------------------
(BTCUSDT 1W Chart)
Resistance: around 38150.02
Strong support: 27033.35-29812.52
The key is whether you can get support in the section 27033.35-29812.52.
From a mid- to long-term point of view, it needs to rise above 40K to continue the uptrend.
(1D chart)
Primary resistance: around 32259.90
Secondary resistance: around 35045.0
Strong support: 27033.35-29812.52
- 28923.63-29812.52
- Around 27033.35
In order to transition into an uptrend, it needs to find support and move upwards at the 32259.9-35045.0 section.
Accordingly, the increase in trading volume (over 88.696K) should continue.
The next volatility period is around June 5th.
------------------------------------------------------------ -----------------------------------------------------
** All indicators are lagging indicators.
Therefore, it is important to be aware that the indicator will move accordingly as price and volume move.
However, for the sake of convenience, we are talking in reverse for the interpretation of the indicator.
** The MRHAB-T indicator used in the chart is an indicator of our channel that has not been released yet.
** The OBV indicator was re-created by applying a formula to the DepthHouse Trading indicator, an indicator disclosed by oh92. (Thanks for this.)
** Support or resistance is based on the closing price of the 1D chart.
** All descriptions are for reference only and do not guarantee a profit or loss in investment.
(Short-term Stop Loss can be said to be a point where profit and loss can be preserved or additional entry can be made through split trading. It is a short-term investment perspective.)
---------------------------------
