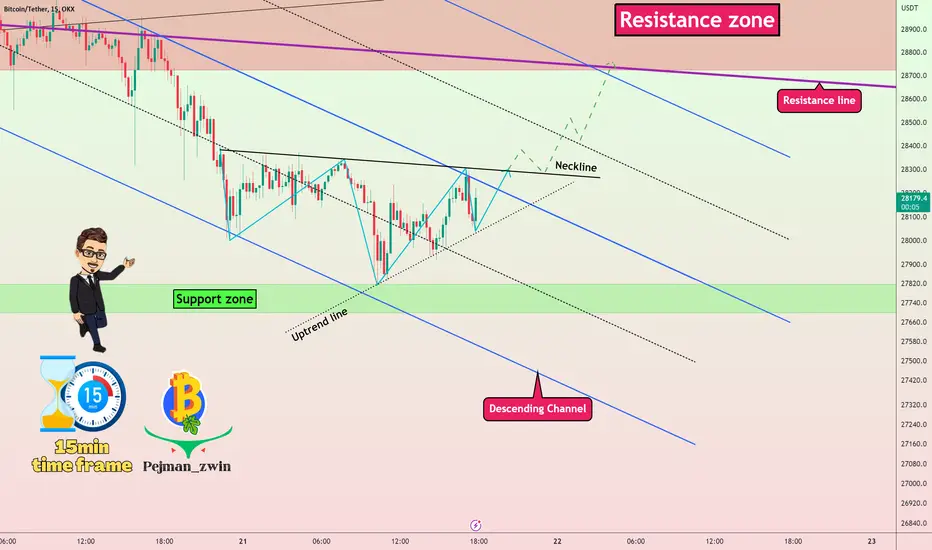
Bitcoin Analyze (Short Term,15-minute Time Frame,05/01/2023)Bitcoin lost its support zone with a long-bodied red candlestick (currently acting as a🔴 resistance zone($ 29,030-$ 28,880) 🔴.
The corrective zigzag structure(ABC/5-3-5) is expected to play the role of a pullback to the lost support zone, and then Bitcoin will fall again to the next 🟢 support zone($ 28,800-$ 27,800 )🟢.
💡The sign of the end of wave B can be the Hammer Candlestick Pattern, Fibonacci levels, etc.💡
Bitcoin Analyze ( OKX:BTCUSDT ), 15-minute time frame ⏰.
Do not forget to put Stop loss for your positions (For every position you want to open).
Please follow your strategy, this is just my Idea, and I will be glad to see your ideas in this post.
Please do not forget the ✅' like '✅ button 🙏😊 & Share it with your friends; thanks, and Trade safe.
XBTUSD

Bitcoin Analyze (Short Term,15-minute Time Frame,04/23/2023)🌊According to Elliott's wave theory, The end of wave 4 ended in the 🟡 Price Reversal Zone(PRZ) 🟡, and one of the signs of the end of the wave was the breaking of the resistance line upwards, and wave 5 can continue until the end of the 🔴resistance zone($ 27,900-$ 27,700)🔴.
After the confirmation of the end of wave 5, Bitcoin is expected to fall to the 🎯target🎯 I have specified in the chart or the 🟢support zone($ 27,260-$ 27,120)🟢.
In addition, We can also see the Regular Divergence(RD-) between the end of wave 3 and wave 5 in the RSI indicator and the probability that one of the valid RSI ⬇️SELL⬇️ signals, namely Bearish Failure Swing , will be seen in the next hour is very high.👇
Bitcoin Analyze ( OKX:BTCUSDT ), 15-minute time frame ⏰.
Do not forget to put Stop loss for your positions (For every position you want to open).
Please follow your strategy, this is just my Idea, and I will be glad to see your ideas in this post.
Please do not forget the ✅' like'✅ button 🙏😊 & Share it with your friends; thanks, and Trade safe.

How can we confirm Bull Run❗️❓Hi everyone👋
Today I want to show you how to confirm the Bull Run for Bitcoin and other cryptocurrencies. ( Reading time less than 6 minutes⏰ )
One of the indicators that clearly show the possibility of confirming the Bull Run for Bitcoin is the 2-Year MA Multiplier indicator, which was created by Philip Swift in 2017.
There are secrets hidden in the 2-Year MA Multiplier indicator, which I will reveal to you in this post.🔎
So stay with me.🤝
--------------------------------------------------------------------------------------------------------------------------------------------------------------------------------
🔔First, let's see what the indicator 2-Year MA Multiplier is.
The 2-Year MA Multiplier is a Bitcoin chart intended to be used as a long-term investment tool.
It highlights periods where buying or selling Bitcoin during those times would have produced outsized returns.
To do this, it uses a moving average (MA) line, the 2yr MA, and also a multiplication of that moving average line, 2yr MA x5.
Note: the x5 multiplication is of the price values of the 2yr moving average, not of its time period.
Buying Bitcoin when the price drops below the 2yr MA (green line) has historically generated outsized returns. Selling Bitcoin when the price goes above the 2yr MA x 5 (red line) has been historically effective for making a profit.
Why This Happens❗️❓
As Bitcoin is adopted, it moves through market cycles. These are created by periods where market participants are over-excited, causing the price to over-extend, and periods where they are overly pessimistic, where the price over-contracts. Identifying and understanding these periods can be beneficial to the long-term investor.
The 2-Year MA Multiplier indicator is a simple and effective way to highlight those periods.
--------------------------------------------------------------------------------------------------------------------------------------------------------------------------------
How we can confirm Bull Run and Secrets .😉
--------------------------------------------------------------------------------------------------------------------------------------------------------------------------------
🔎 How can we confirm Bull Run❗️❓
Bitcoin has always been able to break the Downtrend lines upward before the start of the Bull Run = Mission accomplished✅
To start the new phase of the Bull Run, Bitcoin must go below the 2 Years Moving Average, and then the green candle closes above the Moving Average (in the monthly time frame⏰).= Bitcoin has already completed the first phase of the Bull Run, i.e., the 2 Years Moving Average,✅ and to complete the confirmation of the Bull Run, the green candle above the 2 Years Moving Average needs to be closed.🔄(LOADING)
To start a Bull Run, Bitcoin needs to create 4 green monthly candles (in a row) in the green area of the 2-Year MA Multiplier indicator = currently, Bitcoin has managed to create 3 green candles in a row, and the candle The month of April will close in about 15 days, and if it is positive or green, we can confirm this sign.🔄(LOADING).
Crossing of the 6-Simple Moving Average (6-SMA) above the 12-Simple Moving Average (12-SMA) (Buy signal)= 🔄(LOADING). Please check the post below.👇
--------------------------------------------------------------------------------------------------------------------------------------------------------------------------------
🎉 Secrets:
First, I must say that to avoid clutter, I did not specify the percentages in the chart.😊
The percentage of Bitcoin price decline from an All-Time High(ATH) between two consecutive halvings has been around ➖80%.
The recent movement of Bitcoin in these months is very similar to the movement of Bitcoin in the green zone between the halvings of 2012 and 2016, so that the duration of Bitcoin's presence in the green zone in these two movements can be exactly the same, i.e. 335 days. (If the candle of this month and the next month is green).
If Bitcoin can create a green monthly candle above 2 Years Moving Average, it can grow by ➕50% before the halving of 2024, so it seems that the maximum price of Bitcoin can be around $ 50,000 before the halving in 2024.
In previous periods, the green monthly candle closed above the 2-year moving average between 213 and 305 days before the next halving, so if Bitcoin wants to move like the previous two periods, we can expect the May or August candle to close above 2 Years Moving Average.
If you find a secret in the Bitcoin chart, be sure to share it with me in the comments. Thank you for being with me so far.❤️🌹🙏
--------------------------------------------------------------------------------------------------------------------------------------------------------------------------------
Bitcoin Analyze ( BTCUSD ), Monthly time frame ⏰.
Do not forget to put Stop loss for your positions (For every position you want to open).
Please follow your strategy, this is just my Idea, and I will be glad to see your ideas in this post.
Please do not forget the ✅' like'✅ button 🙏😊 & Share it with your friends; thanks, and Trade safe.

Bitcoin➡️Low volume📊 ➕ Heavy resistance zone🔴 ➕ Wave count🌊Hi everyone👋( Reading time less than 3 minutes ⏰).
First of all, I must say that the financial markets always have surprises for us, so we should not be disappointed and stick to our principles, observe the important points of trading, including capital management, and most importantly, trading psychology, do not make emotional decisions and follow your strategy (even simple) enter and exit🔁.
After moving in a range for about 1 month, Bitcoin broke this range to the top yesterday. Now you might ask yourself if it is time for Bitcoin to fly to the 🌘moon🌘 or not❗️❓
Let's take a look at the news in the cryptocurrency market. Is there more good news than bad news❗️❓
In my opinion, there is no good news in the market; if you remember when Bitcoin started growing from the range of $ 28,000 and reached $ 69,000, the good news was still the rumor of paying with Bitcoin in Amazon, the controversial interview of Elon Musk and the Bitcoin ETF (in the range of $ 44,000 ) contributed a lot to the growth of Bitcoin, but now there are mostly bad news in the market, the Binance and the Luna_FTX cases, the release of Mt.Gox Bitcoins, etc. Of course, a series of on-chain factors show us the signs of Bitcoin's growth.
I tried to have an overview of the important events of these few months; maybe they will give you a better view in the continuation of the analysis.
--------------------------------------------------------------------------------------------------------------------------------------------------------------------------------------------------------
Technical analysis
Bitcoin is moving in the 🔴 heavy resistance zone ($ 32,400-$ 28,120) 🔴, and as I said in previous posts, I personally do not expect this resistance zone to be broken with one test , and we need at least a correction and the formation of a major pivot in the daily time frame.
Also, the growth of Bitcoin after the range area of the last month has not been impressive, and we can see the Regular Divergence(RD-) between price and Volume & RSI indicators in the chart.👇
According to the theory of Elliott waves , Bitcoin is in the main wave 5, so that microwave 1 of the main wave 5 is bigger (It happens less often) than all the waves.
I expect Bitcoin to start falling after rising to the 🟡Price Reversal Zone(PRZ)🟡 and the upper line of the ascending channel to fill the 🔵 CME GAP($ 28,720-$ 28,265) 🔵.
Bitcoin Analyze ( BTCUSDT ), 4-hour time frame ⏰.
Do not forget to put Stop loss for your positions (For every position you want to open).
Please follow your strategy, this is just my Idea, and I will be glad to see your ideas in this post.
Please do not forget the ✅' like'✅ button 🙏😊 & Share it with your friends; thanks, and Trade safe.

Bitcoin Analyze (Short Term,15-minute Time Frame,04/24/2023)🌊According to the previous analysis, Bitcoin correctly completed wave A in the zone I expected (Sniper).🔫🎯👇
It seems that Bitcoin has formed a descending channel to complete wave B, which is the structure of microwave B of wave B is a Double Three Correction(WXY) .
The general structure of wave B is Zigzag(5-3-5/ABC).
I expect wave B to complete near the midline of the descending channel or 🟢 support zone($ 27,260-$ 27,120) 🟢.
Bitcoin Analyze ( OKX:BTCUSDT ), 15-minute time frame ⏰.
Do not forget to put Stop loss for your positions (For every position you want to open).
Please follow your strategy, this is just my Idea, and I will be glad to see your ideas in this post.
Please do not forget the ✅' like'✅ button 🙏😊 & Share it with your friends; thanks, and Trade safe.

Bitcoin was Sandwiched & Black Crows took the Sandwich🥪Hi, everyone👋 (Reading time less than 3 minutes⏰).
Today I want to use one of the simplest and, of course, the most widely used technical analysis tools to analyze Bitcoin, the name of this analysis tool is " Candlestick Patterns ".😉
In general, candlestick patterns are used to enter and exit the trade and to understand the price trend in the chart. And the more these patterns are formed in higher time frames, the more valid they are.
-----------------------------------------------------------------------------------------------------------------------------------------------------------------------------------------------------------
➕Bitcoin was moving in an ascending channel for about 24 days but was broken down by a 🥪 Bearish Stick Sandwich Candlestick Pattern 🥪 on the daily time frame of this ascending channel.
➕Also, the last 3 daily candles together formed the ⚫️ Three Crows Candlestick Pattern ⚫️, which shows us a reversal pattern as well as a continuation of the downward trend (The black crow has been a sign of sadness and bad events since ancient times).
➕In addition, if we look at the RSI indicator , we can see that the 🗻 Double Top pattern 🗻 has worked well and has broken the 50% line downwards. We can expect the RSI to fall to the 30% line at least.👇
🔔Another reason that shows that Bitcoin is likely to break the 🟢 support zone($ 26,890-$ 26,430) 🟢 is the duration of Bitcoin's rise and fall. If you look carefully at the chart, the number of days that Bitcoin needed to grow was 18 days, but Bitcoin lost its growth in about 7 days and fell. This shows that the strength of the sellers in the market is more than the buyers and most likely the 🟢support zone($ 26,890-$ 26,430)🟢 will be broken and Bitcoin will go to the 🟢 heavy support zone($ 25,300-$ 23,890) 🟢(❗️ a very sensitive and decisive zone for Bitcoin ❗️).
Bitcoin Analyze ( OKX:BTCUSDT ), Daily time frame ⏰.
Do not forget to put Stop loss for your positions (For every position you want to open).
Please follow your strategy, this is just my Idea, and I will be glad to see your ideas in this post.
Please do not forget the ✅' like'✅ button 🙏😊 & Share it with your friends; thanks, and Trade safe.

Is the Head and Shoulders pattern Trigger for Bitcoin to Fall❗️❓Bitcoin seems to have broken the ascending and descending channels & 🟢support zone($ 29,200-$ 28,730) 🟢 by the Head and Shoulders pattern .
Of course, the decline in the price of Bitcoin was expected by me based on my previous posts in the daily time frame: (I suggest you view my previous posts).
About the Head and Shoulders pattern, there are several points that add to the validity of this pattern:
1- If the neckline slope is negative.
2- The slope of the right shoulder towards the neckline should be greater than the slope of the left shoulder.
3- The volume of the right shoulder is greater than the volume of the left shoulder.
✅ All of the above factor into this Head and Shoulders pattern created in Bitcoin.
Bitcoin seems to have broken the lower lines of the ascending and descending channel and the neckline of the Head and Shoulders pattern (now BTC is pulling back) and it is expected that at least Bitcoin will fall to the Price Reversal Zone (PRZ) and 🔵CME GAP($ 28,720-$ 28,265)🔵 and react to the important support line.
Bitcoin Analyze ( OKX:BTCUSDT ), 4-hoour time frame ⏰.
Do not forget to put Stop loss for your positions (For every position you want to open).
Please follow your strategy, this is just my Idea, and I will be glad to see your ideas in this post.
Please do not forget the ✅' like'✅ button 🙏😊 & Share it with your friends; thanks, and Trade safe.

Bitcoin is ready to break the Descending channel(Short term)🚀Bitcoin has been moving in a Descending Channel for about 3 days.
The formation of the Inverse Head and Shoulders pattern near the 🟢support zone($ 27,820-$ 27,700)🟢can be a good sign of breaking the upper line of the descending channel.
I expect Bitcoin to start growing after breaking the upper line of the descending channel.
The increase of Bitcoin can be as vast as the descending channel and up to the 🔴resistance zone($ 29,200-$ 28,730) 🔴.
Bitcoin Analyze ( OKX:BTCUSDT ), 15-minute time frame ⏰.
Do not forget to put Stop loss for your positions (For every position you want to open).
Please follow your strategy, this is just my Idea, and I will be glad to see your ideas in this post.
Please do not forget the ✅' like'✅ button 🙏😊 & Share it with your friends; thanks, and Trade safe.
Bitcoin is completing a pullback and Falling again😉(Short term)Bitcoin reacted to the bottom of the descending channel and the 🟢heavy support zone($ 29,200-$ 28,730) 🟢, and the bottom of the ascending channel in the 4-hour time frame after falling from the Top of the descending channel with the Double Top pattern, but due to the momentum and volume of the breakout candle, I expect Bitcoin after That the pullback to the lost support zone, which is now the resistance zone, will make a renewed 👊attack👊to break the support zone and the bottom line of the ascending channel.
If you want to see the 4-hour time frame Bitcoin analysis, visit the post below.👇
Bitcoin Analyze ( OKX:BTCUSDT ), 30-minute time frame ⏰.
Do not forget to put Stop loss for your positions (For every position you want to open).
Please follow your strategy, this is just my Idea, and I will be glad to see your ideas in this post.
Please do not forget the ✅' like'✅ button 🙏😊 & Share it with your friends; thanks, and Trade safe.

Bitcoin runs Descending Channel within an Ascending Channel!!!▶️Bitcoin reacted well to the 🟢support zone($ 29,200-$ 28,730) 🟢 over the past day, although I expected Bitcoin to penetrate further into this zone.
With today's move, Bitcoin seems to form a descending channel within the main ascending channel.
Also, currently, Bitcoin is moving near the 🔴resistance zone($ 30,620-$ 30,450)🔴 and the cross of the resistance lines; since Bitcoin is forming a double top pattern in the 1-hour time frame, I expect Bitcoin to at least fall to the 🟡Price Reversal Zone(PRZ)🟡and the middle line of the descending channel and the support line.
Bitcoin Analyze ( OKX:BTCUSDT ), 4-hoour time frame ⏰.
Do not forget to put Stop loss for your positions (For every position you want to open).
Please follow your strategy, this is just my Idea, and I will be glad to see your ideas in this post.
Please do not forget the ✅' like'✅ button 🙏😊 & Share it with your friends; thanks, and Trade safe.

Bitcoin breaks the support zone and the middle line👇Hi everyone👋
Bitcoin is moving in an ascending channel.
Bitcoin managed to break the 🟢support zone($ 29,880-$ 29,660)🟢 and the middle line of the ascending channel by the candle 4 hours ago. (The volume of the breakout candle was acceptable).
Bitcoin's next destination after the pullback to the middle line and support zone will be the next 🟢 support zone($ 28,900-$ 28,600) 🟢.
You may ask yourself whether Bitcoin will be able to break the ascending channel downwards or not.
🔔To answer this question, I got help from 3 indicators in the daily time frame :
The MACD indicator shows Regular Divergence(RD- ) .👇
The RSI indicator shows Regular Divergence(RD-) and is forming a Double Top pattern , which means that if the neckline breaks, the probability that the ascending channel of Bitcoin will break downwards is very high.👇
The Stochastic RSI indicator shows us the end of the movement well.👇
Bitcoin Analyze ( OKX:BTCUSDT ), 4-hoour time frame ⏰.
Do not forget to put Stop loss for your positions (For every position you want to open).
Please follow your strategy, this is just my Idea, and I will be glad to see your ideas in this post.
Please do not forget the ✅' like'✅ button 🙏😊 & Share it with your friends; thanks, and Trade safe.

Ending Bitcoin's Pullback by Expanding Flat(Short term)!!!😏First, I must say that in order to have a better understanding of this post, I suggest you look at the following post in the 4-hour time frame.👍👇
Bitcoin's pullback to the broken 🟢support zone($ 29,880-$ 29,660)🟢 seems to follow the corrective structure of the Expanding Flat (3-3-5/ABC/most common), so that the end of wave C is at 🟡 Price Reversal Zone(PRZ) 🟡.
I expect Bitcoin to fall at least until the next 🟢 support zone($ 28,900-$ 28,600) 🟢.
Bitcoin Analyze ( OKX:BTCUSDT ), 15-minute time frame ⏰.
Do not forget to put Stop loss for your positions (For every position you want to open).
Please follow your strategy, this is just my Idea, and I will be glad to see your ideas in this post.
Please do not forget the ✅' like'✅ button 🙏😊 & Share it with your friends; thanks, and Trade safe.

Bitcoin Analyze (Short Term,15-minute Time Frame,04/15/2023)🌊
Bitcoin has been able to go through 5 main waves at $ 31,043, and now it seems that you have started corrective waves.
Bitcoin is currently moving near the resistance line and 🟡Price Reversal Zone(PRZ)🟡.
I expect Bitcoin to finish microwave 4 near the PRZ and microwave 5 to continue at least to the 🟢support zone($ 29,880- $ 29,630)🟢 and support line.
Bitcoin Analyze ( OKX:BTCUSDT ), 15-minute time frame ⏰.
Do not forget to put Stop loss for your positions (For every position you want to open).
Please follow your strategy, this is just my Idea, and I will be glad to see your ideas in this post.
Please do not forget the ✅' like'✅ button 🙏😊 & Share it with your friends; thanks, and Trade safe.

Bitcoin is starting to fall🌊(Short term/15-minute)!!!First, I must say that if you are looking for a better understanding of this post, I recommend you to look at the following post for a few seconds.👇😉
It seems that with the break of the 🟢 support zone($ 30,326-$ 30,260) 🟢, Bitcoin will enter microwave 3 from the main wave 5, and I expect this fall to continue until the 🟢 support zone($ 29,880- $ 29,630) 🟢.
Bitcoin Analyze ( OKX:BTCUSDT ), 15-minute time frame ⏰.
Do not forget to put Stop loss for your positions (For every position you want to open).
Please follow your strategy, this is just my Idea, and I will be glad to see your ideas in this post.
Please do not forget the ✅' like'✅ button 🙏😊 & Share it with your friends; thanks, and Trade safe.

BTCUSD: Shocking Similarity From Last CycleHello all,
The market has been silent for nearly the past month. BTC & ETH broke out of their ranges over the last week. Many people were caught off guard from the break of 30k that occurred yesterday. This was heavily predicted and expected based on many indications.
Simply put, many indications pointed to the market being in a very similar spot as April 2019 (the month before BTC broke 6k and rallied to 14k). One of the main technical indications that led me to believe BTC was going to break 30k was the fact BTC was consolidating under a large resistance for nearly a month.
This was not a usual pattern based on BTC's price history. Essentially BTC printed 3 dojis on the 1 week chart (under a massive resistance). Many expected BTC to not be able to break that massive resistance level as it didn't have any large pullbacks since its swing low at 19.5k
However, I looked at this in terms of supply & demand. One of the most powerful ways to identify strong supply & demand zones are by looking for a strong price reaction from that level.
Example Chart:
The zone I have been referring to is from 28.5k - 30.1k. As seen above, this zone has been respected for a long time. Each time price bounced hard off this zone, it continued to trend higher for some time. When BTC came back down to this zone in May of 2022, price did not have any hard bounce off the zone, and fell -50%, proving the demand was lower.
Fast forward to today, and we can flip this logic and look at this area as a supply zone. When BTC reached this level last month, we never saw a hard rejection from this zone, proving the supply (liquidity is another way to look at it) was higher. Now after a month of consolidating below, BTC is above the zone.
Now we ask, what is next? Well, as seen in the posted chart, BTC is showing very similar price action as to April/May 2019.
A major level was respected each cycle (shown in gray). Both times, price broke this level, dropped -50%, bottomed, came back to the gray level, broke the 200MA, consolidating below the gray level for a few weeks and then broke it.
Along with a few other technical points, BTC seems to have more fuel in the tank to push price higher. If at anytime BTC falls back under this zone, we cannot consider any bullish thesis.
Thanks for reading and I hope you all enjoyed!
Please COMMENT & LIKE!

Bitcoin Analyze (Short Term,15-minute Time Frame,04/13/2023)🌊Bitcoin seems to have passed its fifth impulsive wave in the 🟡Price Reversal Zone(PRZ)🟡.
To confirm the count, we have to wait for the uptrend line to break down.
If the uptrend line breaks downward, Bitcoin can touch the support line.
Bitcoin Analyze ( OKX:BTCUSDT ), 15-minute time frame ⏰.
Do not forget to put Stop loss for your positions (For every position you want to open).
Please follow your strategy, this is just my Idea, and I will be glad to see your ideas in this post.
Please do not forget the ✅' like'✅ button 🙏😊 & Share it with your friends; thanks, and Trade safe.

Bitcoin Analyze (Short Term, 15-minute Time Frame,04/12/2023)!!!It seems Bitcoin was able to make a Head and Shoulders Pattern near the 🟡 Price Reversal Zone(PRZ) 🟡. So that there is a noticeable Regular Divergence(RD-) between the two shoulders.
I expect Bitcoin to drop to at least the support line.
Bitcoin Analyze ( OKX:BTCUSDT ), 15-minute time frame ⏰.
Do not forget to put Stop loss for your positions (For every position you want to open).
Please follow your strategy, this is just my Idea, and I will be glad to see your ideas in this post.
Please do not forget the ✅' like'✅ button 🙏😊 & Share it with your friends; thanks, and Trade safe.

What happens when Bitcoin touches $30,000❗️❓🤏Bitcoin is still moving in the 🔴resistance zone ($ 32,400-$ 28,120)🔴 also, several times, Bitcoin is attacking the Important Resistance line.
If you want to understand the importance of the important resistance line, look at the following post.👇
In addition, the Fibonacci cluster near the number of $ 30,000 is very compact.
Also, the growth of Bitcoin happens with the Regular Divergence(RD-) between the price and the RSI Indicator, and it is expected that the RSI will reach 70% in the daily time frame and fall again.👇
So, I expect Bitcoin to close to $ 30,000, which is also a round number, after a small correction and then move toward the resistance line. In general, I don't expect to break the heavy support zone with just one test on the daily time frame; at least a major pivot should be created on the heavy resistance zone, so Bitcoin needs to correct and attack the heavy resistance zone again.
We have to wait until Bitcoin fills the 🔵CME GAP($ 28,720-$ 28,265)🔵.🤔
Bitcoin Analyze ( BTCUSDT ), 4-hour time frame ⏰.
Do not forget to put Stop loss for your positions (For every position you want to open).
Please follow your strategy, this is just my Idea, and I will be glad to see your ideas in this post.
Please do not forget the ✅' like'✅ button 🙏😊 & Share it with your friends; thanks, and Trade safe.

Bitcoin (BTCUSD): More Growth is Coming ₿
Bitcoin was accumulating for 3 weeks within an ascending triangle formation.
The price set multiple higher lows and equal highs.
The neckline of a triangle was finally broken yesterday.
The broken neckline and a trend line now compose the zone from where I would recommend
buying Bitcoin.
Taking into consideration that we are trading in a strong bullish trend, I believe that probabilities will be high
that the market will keep growing.
Next goal - 31300
❤️Please, support my work with like, thank you!❤️

Bitcoin time analysis cycle based on machine learningcycle Analysis this Should Happen in the Coming Years i will update it every week until the cycle in black color end good luck .

60 thousand dollars.Good evening!
Our group reached a milestone of 70 members last night, and I'm excited to share a bullish idea with the world.
Bullish momentum continues to build as increasing pressure mounts on the financial world.
For many, Bitcoin appears to be "the way out," or so the simple narrative goes.
However, I'm not here to discuss narratives; I'm here to analyze market structure.
The market seems poised for a breakout, and I believe it could be massive.
While most people expect a 32k 🎯,
my target was 39k since last august.
I've raised my target to 60k as of this evening for this particular bull case.
It is only after reaching 60k that I predict Bitcoin will fall to revisit the November 2023 lows.
---
Key levels:
🔨 60k (Target)
🔺 10k (Support)
---
Stay vigilant and trade wisely!

Bitcoin Analyze (Short Term, 1-hour Time Frame,04/08/2023)!!!While Bitcoin seems to be completing Wave B, or even past it, there is a possibility that wave B may follow higher Fibonacci levels or even form a contracting triangle pattern.
At the same time, Bitcoin managed to form a symmetrical triangle pattern in the RSI indicator in the 4-hour time frame, which can be considered as a key for the next big move.👇
I expect Bitcoin to decline toward the 🟢support zone (26,980-26,580)🟢 after breaking the support line.
❗️ Note ❗️: If BTC goes over HKEX:29230 Scenario will change.
Bitcoin Analyze ( BTCUSDT ), 1-hour time frame ⏰.
Do not forget to put Stop loss for your positions (For every position you want to open).
Please follow your strategy, this is just my Idea, and I will be glad to see your ideas in this post.
Please do not forget the ✅' like'✅ button 🙏😊 & Share it with your friends; thanks, and Trade safe.

Bitcoin will fall by Contracting Triangle❗️❗️❗️As I said in the previous post, it seems that the corrective structure of wave B can be in the form of a contracting triangle.
Bitcoin managed to break the lower line of the contracting triangle, and it also seems to be the sign of the end of Bitcoin's pullback to the broken triangle of the evening star candlestick pattern.
After breaking the support line, I expect Bitcoin to go down toward the 🎯targets🎯 I have specified on the chart.
Bitcoin Analyze ( BTCUSDT ), 1-hour time frame ⏰.
Do not forget to put Stop loss for your positions (For every position you want to open).
Please follow your strategy, this is just my Idea, and I will be glad to see your ideas in this post.
Please do not forget the ✅' like'✅ button 🙏😊 & Share it with your friends; thanks, and Trade safe.
