XHB
rising channel on daily, bullish homebuilder sectorThe homebuilder sector etf was up .75% on friday, despite rest of market being red. BZH has rising channel on daily, resistance would be $14.44 in this channel. Over 4000 $14 calls sitting in OI for 10/16. Fibonacci .618 is $15.4. Everything is dependant on Trumps health. Happy trading
$LEN Bullish Descending Megaphone$LEN Bullish Descending Megaphone
$LEN has formed a beautiful descending broadening wedge or descending megaphone into its earnings report Monday after close. This pattern retested previous highs and bounced, showing support on a perfect retest of $71.30. First target is previous highs around $79.50 which I am looking for Monday into Earnings. I am looking to stay long LEN & homebuilders in general through earnings but will take some profits at first target.
$XHB on the whole looks decent
Component $DHI looks good
$TOL broke out & looks fantastic
BTO $LEN 9/18 $80c
ITB channel breakoutHomebuilders have been behaving well in a channel since the market low of march 23rd.
Tuesday after memorial day was the first break out of the channel, and today's participation continues to give the sector a more positive view.
Next tested resistance which is all time highs around $49.5
Next strong support is the 200sma (red line)
RSI is taking us to overbought level (relative bear)
OBV trending higer (bull)
We are seeing some sort of rotation to more cyclical sectors. I am checking out for IYT, IYF, XLI.
WARNING: Why US Real Estate Bubble Is About to Implode!Dear Friends
You know how D4rkEnergY is here to help you! That's his mission - he is here to make everyone happy. He will warn you about buying your dream home
now. Here is why!
XHB index, the Homebuilder Index, is where we want to look if we want to get an idea about the real estate market in US. It's a really good leading indicator, and are composed of sectors like: homebuilding, construction supply, home improvement, electrical components and home furnishing etc.
It predicted the market crash in 2007-2008 - notice how the index already crashed in 2006 before the real crash happened. Also notice how 2018 has been a huge bloodbath. This could very well be a sign of an coming crash, IF we continue down.
And down we will go - most likely. We already survived one Head and Shoulder pattern due to help from the EMA50. But we are now below this critical area, and the EMA now working against us as resistance.
So here is D4rkEnergYs advice to you:
Don't buy a house now - wait a year or 2 and you can get your dream home on sale!
D4 Loves You <3
Please leave a LIKE! Thanks in advance
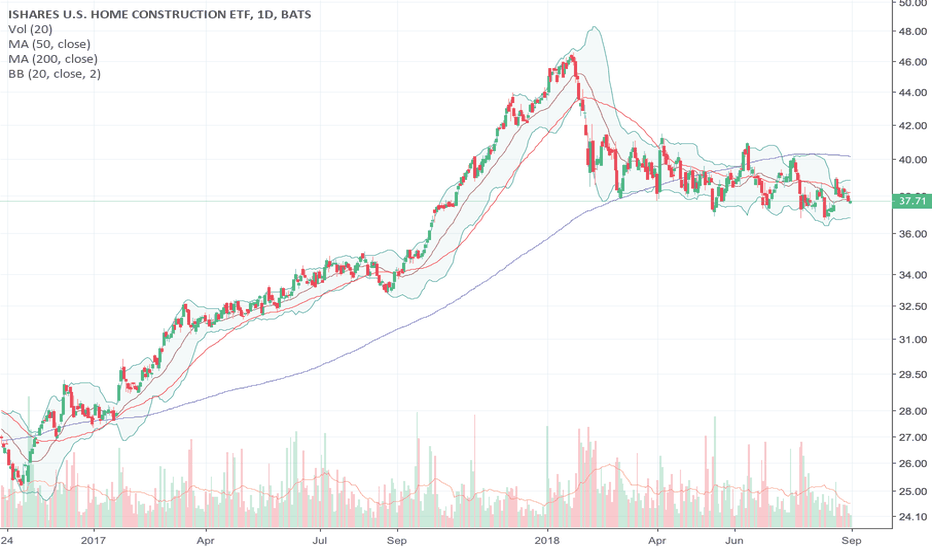
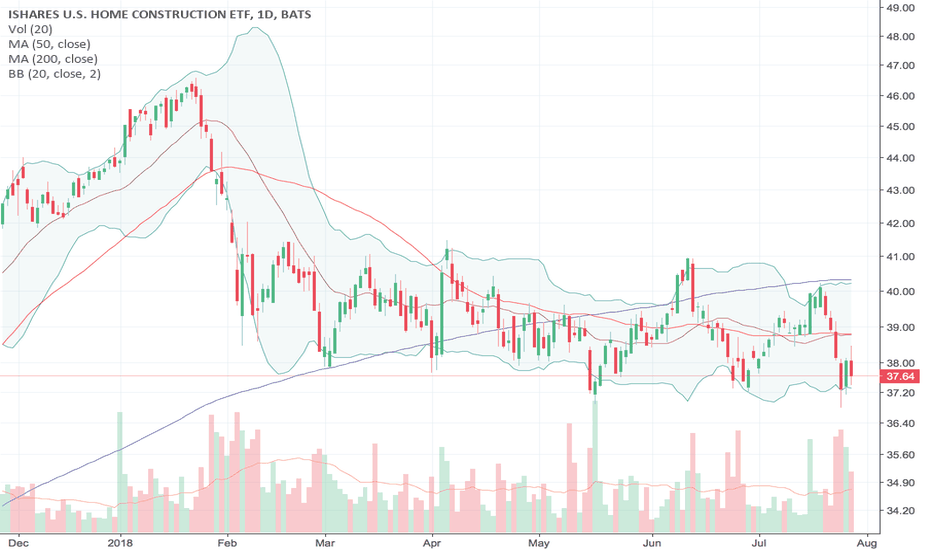
Housing Market Review – A Wobbly Edifice As Builders Break Down Alongside bearish trading action in builder stocks, July’s housing market data may have delivered confirmation of persistent investor fears.
"Housing Market Review – A Wobbly Edifice As Builders Break Down And Data Weaken" drduru.com $ITB $DHI $MTH $KBH $PHM $TOL $TPH #housingmarket #housingwatch #homebuilders #stockmarket #economy #gdp
Housing Market Review (May, 2018) - A Fresh Flicker of LifeHousing Market Review (May, 2018) - A Fresh Flicker of Life As Sentiment Turns Without A Change in Data. The housing data continue to plod along but the market for home builder stocks is suddenly warming up all over again.
drduru.com $ITB $CCS $DHI $PHM $LEN $FPH $LGIH $MTH $XHB
THE WEEK AHEAD: TSLA EARNINGS, EEMAlthough AAPL and GILD announce earnings next week, the only earnings announcement that interests me from a premium selling standpoint is TSLA, with a background implied volatility of over 65%.
The 73% probability of profit May 11th 255/330 short strangle is paying 5.83 at the mid (off hours quotes) with its defined risk counterpart, the 68% probability of profit May 11th 250/255/330/335 iron condor paying 1.06, which is less than I'd like to see out of a 5-wide.
On the exchange-traded fund front, most of the most liquid funds are sub-35% implied volatility, which generally makes for less than compelling premium selling plays. For what it's worth, however, the top five ranked by implied volatility are: XOP (30.4%), OIH (30.2%), EWZ (27.4%), GDXJ (25.5%), and FXI (23.1%). I'm already in XOP and GDX plays, so I might consider having another go at "the Brazilian" in the June cycle -- the June 15th 39/47 short strangle (18 delta) is paying .77. Naturally, more aggressive delta strikes pay more, and it may be amenable to a short straddle/iron fly, depending on your account size, risk appetite, and patience for managing an underlying that seems to whip all over the place on occasion ... .
Alternatively, I might go with another net credit double diagonal due to setup flexibility over a static one-off play, this time in the fairly broad market EEM, which has been closely tracking FXI of late, but is of greater liquidity: the June/Sept 44/47/47.5/50.5 double net credit diagonal is .26 at the mid for a three-wide, and I'd probably look to bail on it at 20% the width of the 3.00 wings ... .
I'll also look at bullish directional shots in IYR, XLI, XHB, and/or XLP, which appear to be the weakest of the sectors currently. Pricing those out in non-New York hours tends to be non-productive since the deep-in-the-money back months show wide bid/ask in off hours, so it's tough to tell how much you're going to have to commit buying power wise to play ... .


