XLE


XLE Iron FlyTrade Setup:
-1 XLE Apr 21 65/69.5/69.5/74 Iron Fly @ $2.33
DTE: 30
Max Win: $233
Max Loss: $217
Breakevens: $67.17 & $71.83
Trade Management: 25% profit; Full loser, possibly roll the ITM side out in time if my bias is the same near expiration.
Green is profit zone; vertical black bar is expiration.


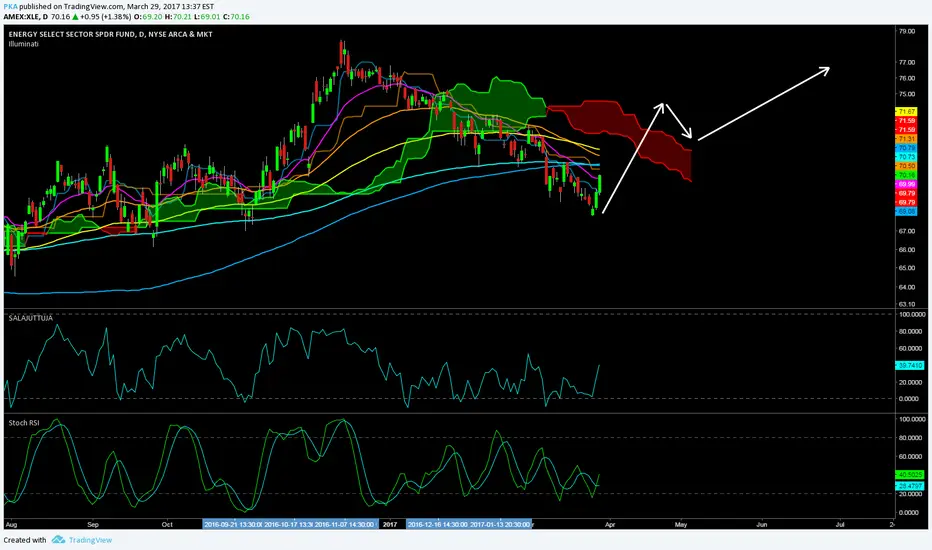
XLE about to prepare for a spurt to the north? See how price reacts at the centerline/slding/AR-Lines ?
The SWAP in Nov. 16 marked the range and of course it has to come back to breath out.
Lastly the weak hands got scared out by a very hard and final drop (red bar).
Now I can imagine that time is right to collect some premium on the downside.
Even a RiskReversal my be a good trade.
P!


XLE for SaleXLE is in a larger uptrend from last February
- it has pulled back to a consolidation range
- there is large volume on the recent down move, these are buyers to me
- this sector is lagging the over all market
- we are entering seasonally bullish period for oil
I'm a buyer here, now that can be buying the underline, leveraged buying the underline, or selling volatility in the underline. The way of getting long is up to the individual. This is not a short term position (multi year).

Energy Stocks/Oil Trend line set up 2013-2015 continued to provide support in Oct2015 but at the start of this year has broken down.
Looking to short a rally.

Crude to 58-60Been holding the weekly 100 ema on multiple tests.
20 ema about to cross up 100 ema on weekly. Cloud is also bullish.

Long RowanBullish price structure. Ideal stop below 17. 4x ev/ebitda.
Healthy cash flow and balance sheet.
Joint venture with Saudi Aramco.


Long RDCRowan has a joint venture with Saudi Aramco. Cash flow is healthy and enough backlog to sustain through 2020 imo. 3.5x ev/ebitda.

$72.00level holding. (XLE) entering the buy zone.The pivot level at $72 is being tested and holding, for now.
I feel the line of least resistance is higher. I am looking for $84 eventually.
I will be looking to buy dips b/w 72-65.
A move under 65 and I would rethink my position.
No position at the moment.

$72.50. Important level for (XLE)Currently testing and holding the $72.50 level.
The line of least resistance appears to be higher.
A move under the $65 would change my mind.
No position at the moment, will update if one is taken.


Energy stocks might be overvalues against oil pricesThe break of the pennant within the possible head and shoulders complex could be the deciding factor. In terms of risk/rewad I prefer to short energy stocks against oil. But the way the chart is forming on a daily metric leads me to believe the trend of stronger energy stocks against oil prices will continue in the long term.

Another oil etf busting $XOPThis track is on repeat. We are seeing oil stock prices breaking out of consolidation. The time is nigh.


Long Term Sector RotationSPX vs Major Sectors. I added IBB to cover Biotech.
Please comment. My understanding at this point is to stay in sectors which have good fundamentals and have been relative laggards. The 3 bottom ones at this point seem to be Financials, Technology and XLU / XLP.
Since utilities is a risk-averse sector, so in a pro-growth environment I may want to go with the other 3. XLB is like the coyote / fox from Mickey mouse that runs a few meters off the cliff thinking its still running on solid ground before realizing that there's nothing below it and then falls like a rock. Great if you can time it right.

long XLE @ 15 min @ trading capability for this 52nd week `16This is only a trading capability - no recommendation !!!
Next wkk i`ll confirm or change my opinion about this SetUp :)
Buying/Selling or even only watching is always your own responsibility ...
Best regards
Aaron
