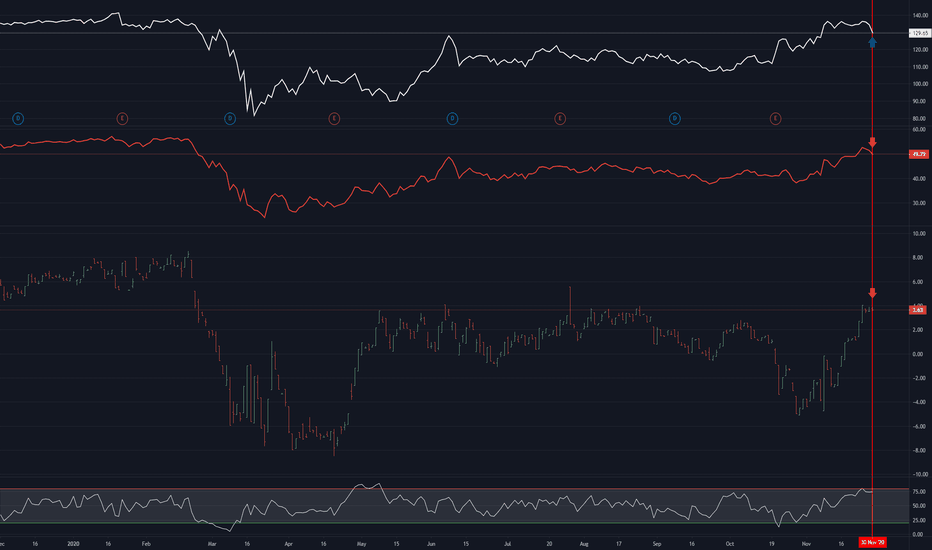
XLF
Sector Winners and Losers week ending 11/13Energy (XLE +17.11% WoW) was the clear winner of the week. Straight out of the gait, Energy benefited from the news that an effective vaccine could be available soon. The Energy sector would benefit from the economic recovery of several of sectors including Transportation, Travel and Leisure.
Financials (XLF +8.29% WoW) followed in a distance second. Banks have a lot to benefit from an economic recovery including higher yields in bonds as investors move back into equities.
Those two sectors stood tall above the rest who all performed more closely to the S&P 500 performance.
Technology (XLK -0.31% WoW) was the only sector to end the week with losses. A clear metric of what we already knew - that investors rotated out of popular technology stocks that benefited from the pandemic lockdowns.
Tech sector showing weakness despite gains on election dayWhen comparing tech focused ETFs/indexes, namely $NDAQ and $XLK, we can see that $SPY has recently been outperforming them. My theory is that this is an unusual case and a sign that tech stocks are near tops.
Given that I did not receive the dip I wanted, I have difficulty putting on a short position on tech. There is also the factor that the highs have not been truly swept yet.
Just something to keep an eye on.
$NDAQ/$SPY
$XLK/$SPY
For options plays, it would appear leaps for $NDAQ would be ideal, while short term plays on $XLK would work out. $NDAQ is quite illiquid.
Sector Winners and Losers week ending 10/23This week it was all about Communication Services (XLC) with the positive earnings beat from Snap (SNAP) driving growth in many of the social platform company stock prices.
Utilities (XLU) continues to be a safe bet for investors as a sector that is consistently performing well over the past few weeks.
Financials (XLF) also had a great week as bond yields are increasing which is usually a good sign for performance of banking stocks.
Consumer Discretionary (XLY) started the week on top but backed off a bit before coming back with some good gains on Friday.
Energy (XLE) had a huge Thursday that put it at the top of the the sectors, but it could not hold the lead, backing off a bit on Friday.
It's not often that we find Technology (XLK) at the bottom of the list for weekly sector performance. Keep an eye on it as many technology companies will have earnings in the next two weeks.
Energy and Financials Adding To SPX Strength In ATH RunSPX with a key back test of the 3389 level overnight as it's trying to break up over the 3411 level. If it can over 3411 it should trigger a test of the key 3425 level. This is a key level from our double top back in September.
SPX is opening stronger than NAS and this is mainly because of energy and financials. If energy and financials are able to join this rally, SPX will run to ATH's and beyond. October is shaping up to be a very bullish month with the potential for a very large rally.
XLF- Mac-D serving as an early buy signal.AMEX:XLF has seen some channel trading from 2018 too early this year. Finding its range peak in February of 2020 it crashed hard and has been working it's way up since. In red and green (A-D) are the main support and resistance levels and I have noted on the MAC-D where price has reversed, and also accounted for some major financial events such as the Chinese trade war and COVID-19 pandemic. XLF seems to have found its new channel and will either retest its support on the downside and hold the channel or test the SMAs as resistance on the upside and possibly find its way into the former price range leading up to the election. I am going to use MAC-D as my signal to buy as we near a cross.
Sector Winners and Losers week ending 9/25Here are the sector winners and losers for this week. XLK (Technology) was up and down as it took the Nasdaq for quite a ride. XLF (Finance) was down from the beginning of the week due to news of suspicious transfers not being blocked by large international banks. XLE (Energy) continues to be a loser despite the increase in crude oil prices. Good to keep an eye on that.
XLF Getting as tight as it can getPicture perfect chart here.
Only 4% between following key levels:
- Support line has been tested 5 times & now coinciding with 50 dma
- Resistance line has been tested 2 times & has been coinciding with 200 dma
Daily RSI convergence confirming price action
While in the middle of those support / resistance lines, 2 major dma's, we are also stuck between the 50 & 61.8 retracement levels (Pre-Covid high to Covid low)
Is the massive $C breakdown this week to be interpreted as a signal of strength or a look into the future for the financial sector?
With $XLK & $XLV having already posted huge recoveries and subsequent gains on the year, is it $XLF's turn to run hot in the reflation trade?
Can $XLF hold its gains if the rest of the broader market continues to sell off lower, representing what would most likely be dubbed the 'Great Rotation' ?
So many questions, however I think this chart & the $SPX chart is all you're going to need over the next month and a half heading into election.
If (lol) - WHEN this thing breaks out, on notable volume and a huge move in the RSI, I think it'll drag the market along with it, whether to the upside or downside.
** I am currently sitting on a bullish $BAC position, so my bias is bullish but it can easily head the other way.
$XLF FinancialsSimilar to the small caps Financials have had a less enthusiastic rally compared to tech and while they have also rallied from the March lows, the uptrend seems to have broken and is heading likely downward. Look for financials and small caps to be a drag on any rallies that the markets may make in the coming days.
$SPX failures at the top $RUT $XLFBeen a while since i posted - life stuff :)
I think it's fair to say that given all the things that are going around in the US and the rest of the world, the stock market, particularly the tech driven Nasdaq has been "over-exuberant", getting to and fairly swiftly breaking above to new all time highs on the SPX. While market participants had all signs to say that this would correct, many, almost all, maintained that this is still a bull market and the markets have more upside to go.
I've maintained that we have been in a bear market but participants are wishing the continuation of the longest bull market in history, ignoring the March correction, or rather asserting that this is a new bull market. In either case... history has shown that even with crisis driven/led markets, it takes a couple of years for markets to reverse trend and enter/exit bull and bear markets. I think we're in a bear market that is shaking off what remains of the bull market and it's glitters.
The SPX broke above new highs and sputtered quite drastically as it ran out of gas. It didn't put up much of a fight near the 3390 level for support, and after spending a day to get back above this level to mount a bull charge, that effort was quickly extinguished and broke down to 3365 ish level, below the previous all time high support.
From there it mounted another charge to get back above 3393, and this week, once again smothered by sellers, and we remain at 3330, where the last bull charge/stance was made. Will there be another charge to test resistance? Yet to be seen.
Interesting perspective to note here is that, while institutional investors move markets, retail investors can cause a panic rampage. With the Covid pandemic and people having no place to go, no work to go to, staying at home and unattended or unemployed, people are pouring money in to their only source of income and investment, which is the stock market - which by all accounts, rallied from March as the pandemic has gotten worse, at least in the United States. We have to understand that, while someone like myself have been through the dot com bubble and the financial crisis, many of these young investors and traders don't know what a stock market crash is, never mind what a bear market looks like. For them, the stock market seems unbreakable; it's a sure win if everyone sticks with it. No understanding of market psychology or behavior, of how markets move.
That means, potentially, when market takes a downturn, we may see a feverish panic to the likes of which has never been witnessed before. This rally from March is a subtle sign of that on the bullish side. Call it a panic rally, if you will - fear of missing out, there is no alternative, etc., the usual sayings.
Where will the markets go from here? Well, while tech has led the way upward, small caps and financials have not been as enthusiastic about the March bounce, and these groups may drag the markets on the way down like an anchor. I would be looking at those for direction in the coming weeks.