All this just before Fedwire implements ISO20022?#bitcoin #btc price attempted a breakout but today failed with dumps. There "may" be other attempts but while ISO20022 subject is approaching, isn' t it wise to think about #xrp and other ISO20022 licenced coins will overperform the others (BTC, ETH, SOL and all other non iso certified coins) in near future? Not financial advice.
XLM

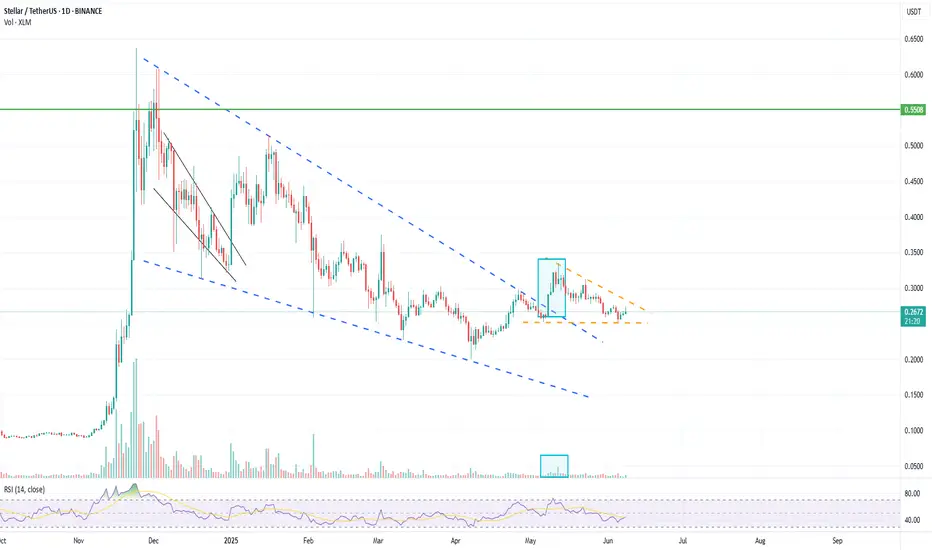
XLM Breakout Alert – Hidden Gem About to Explode?XLM/USDT is showing signs of a potential breakout from a long-term descending trendline that has been in play since November 2024. Price recently rebounded from a key demand zone (highlighted in yellow), suggesting strong buying interest at lower levels.
📉 Descending Trendline Resistance
The pair has consistently respected a strong downward trendline, rejecting all breakout attempts—until now. Price action is tightening near the apex, increasing the probability of an upward breakout.
🟨 Key Demand Zone
The $0.2150 - $0.2410 area has proven to be a strong accumulation zone, providing a solid foundation for a potential reversal. Price has shown multiple bullish reactions from this area.
📈 Upside Targets Upon Breakout Confirmation: If a confirmed breakout occurs, the following resistance levels can serve as potential profit-taking targets:
$0.2573 (breakout confirmation zone)
$0.3040
$0.3512
$0.4903
$0.5603
📌 Ideal Scenario:
Potential long entry after a confirmed breakout and retest of the trendline (~$0.25 - $0.26)
Stop loss below the demand zone (~$0.2150)
Attractive risk-to-reward setup with minimum 30% upside potential.
⚠️ Note: Wait for confirmation before entering the trade. Be cautious of false breakouts, especially under high market volatility conditions.

XLMUSDT Eyes on $0.3109: Breakout Zone Could Ignite Rapid ClimbXLMUSDT is currently forming a bullish reversal structure on the 4-hour chart. After a prolonged downtrend, price has established a support base around the $0.2570 level. This zone has acted as a key support, rejecting downside attempts multiple times, and creating a potential accumulation floor.
The price is now pushing above short-term consolidation, hinting at a possible breakout from the recent range. This range behavior, followed by an early higher low formation, indicates that buyers may be stepping in more aggressively.
Support Zone
The support zone around $0.2570 to $0.2585 is structurally significant. Price dipped into this level twice and was strongly rejected both times. The most recent low around this zone created a long wick, suggesting liquidity grab and potential trend reversal.
This zone now serves as a clear invalidation point for the bullish setup. A break below would likely invalidate the long bias and open the door for a deeper retracement.
Resistance Levels and Take-Profit Targets
The chart identifies two major resistance levels.
The first resistance is around $0.2902, marking Take Profit 1 (TP1). This level acted as resistance multiple times in the past and should be the first area where selling pressure could return.
The second resistance, marked at $0.3109 (TP2), is a higher timeframe resistance zone. It was previously a strong ceiling before the drop in early June. If the momentum is sustained, this area becomes a logical final target for the current bullish swing.
Supertrend Confirmation
The Supertrend indicator has recently flipped green, supporting the bullish bias. The flip occurred after price reclaimed the mid-range, and the price is now consolidating just above the Supertrend baseline.
This is a classic bullish signal on the 4H chart, particularly when it aligns with a structural bottoming pattern and a clean risk-reward setup.
Risk–Reward Setup
The current setup offers a favorable risk-to-reward ratio of 2.49. Entry is positioned near $0.2723, with the stop-loss placed just below the support zone at $0.2570. This limits downside risk to approximately 5.6%.
The upside, on the other hand, stretches up to $0.3109, offering potential gains of around 14%. Even the first target at $0.2902 offers a decent 6.5% return, making this trade attractive for swing traders aiming for a mid-term move.
Momentum Shift and Potential Breakout
What strengthens the bullish case further is the price action attempting to break out of the recent lower high zone. There is a clear effort to reclaim momentum, and a successful 4H candle close above $0.2770 would signal a clean breakout and continuation.
Earlier price action shows signs of accumulation, including a liquidity sweep below $0.2570 followed by strong rejection — a common reversal pattern in crypto markets.

Bidding XLM Under 30c – Easy 2x From here!
Bidding this area under 30c—starting to like how things are shaping up.
Easy setup, especially with BTC aiming for 110k again.
If momentum fades and the market pulls back, I’ll cut and look to re-enter sub 20c on a key retest.
CRYPTOCAP:XLM gets really interesting above 65c—if it breaks that, expect strong follow-through. BINANCE:XLMUSDT

XLM Break out ??Potential break out of falling wedge for XLM
Larger Volume on break a good sign, has retested breakout level.
needs to start moving higher and break that second consolidation zone or risks falling back into old patten.
what do you think? leave a comment.
XLM break out ??Potential break out of falling wedge for XLM
Larger Volume on break a good sign, has retested breakout level.
needs to start moving higher and break that second consolidation zone or risks falling back into old patten.
what do you think? leave a comment.

XLMUSDT short Wait for Good EntryLike & Follow me for more details
GLMR Short,
BTC will break upward trend soon.
Will reach 103k

XLMUSD Huge breakout may happen any moment.Stellar / XLMUSD is testing the 6 month Falling Resistance again, while trading inside a Channel Up.
The 1day RSI is in strong support of this move and may force a 1day candle closing above the Resistance finally.
If it happens, go lonh and target 0.3650 (+32.79%).
Previous chart:
Follow us, like the idea and leave a comment below!!

XLMUSDT 1D AnalysisXLM ~ 1D Analysis
#XLM Buy gradually from here if you still have confidence in this coin with a short term target of at least 10%+ from here.

Stellar (XLM) Update, By Request (New ATH 2025)Definitely bullish, everything points up.
Let's start with the good news. The next wave, the 2025 bull market bullish wave, will be awesome. Why? Because the 2024 initial bullish breakout was really strong, super strong. More than 600% and it reveals what is coming.
Naturally, this breakout is corrected into a higher low. Here with a classic rounded bottom pattern (orange).
This higher low will soon transform into a new bullish wave leading to a new high, higher high and new All-Time High. The new All-Time High can then go crazy and reach even higher, new heights. You will need to scroll up to find the higher targets on the chart.
I am again keeping it simple as I don't see any need to complicate things. Stellar is set to grow. Right now prices are good for trading trading spot and focusing on the long-term. Leverage traders have many other factors to consider, a closer look is needed.
Namaste.

XLMUSD Long - Inverted Head and Shoulders on the daily
- Price is re/testing the neckline of the H&S
- 20ema is now trading above the 50ema (good indication of a possible up trend starting)
- Stop loss below the higher low
- take profit around 0.35 possibly higher

XLMUSDT Potential UpsidesHey Traders, in today's trading session we are monitoring XLM/USDT for a buying opportunity around 0.2730 zone, XLM/USDT is trading in an uptrend and currently is in a correction phase in which it is approaching the trend at 0.2730 support and resistance area.
Trade safe, Joe.

Stellar (XLM/USDT) – Daily Chart Technical Analysis
The chart illustrates a potential bullish setup forming on the daily timeframe of the Stellar/USDT perpetual contract on Binance.
After a prolonged downtrend, the price action has formed a clear double bottom pattern (W-shape), signaling a potential reversal. The neckline of the pattern has been broken and successfully retested, confirming the validity of the formation. Following this retest, XLM has continued to respect the ascending trendline, indicating sustained bullish momentum.
Currently, the price is consolidating just above the trendline, providing a potential long entry opportunity. The designated support area around $0.29725 acts as the key invalidation level. Should the price break and close below the $0.25211 zone, the bullish structure would likely be compromised, potentially leading to a trend reversal.
The target for this setup lies within the resistance zone between $0.38 and $0.40, an area that historically acted as strong supply. This zone is marked as both resistance and a take-profit area. Given the significance of this level, a partial profit-taking strategy is advised once price approaches this zone.
Volume analysis shows moderate participation during the recent leg up, which could suggest the need for higher volume confirmation on any breakout attempts.
The RSI indicator remains in neutral-bullish territory (around 56–58), suggesting that there is still room for upward movement before entering overbought conditions.
Conclusion:
As long as the ascending trendline holds, the structure remains bullish. A break above recent highs with increased volume could pave the way for further upside toward the $0.38–$0.40 region. However, a breakdown below the support zone would invalidate the long thesis and may warrant reassessment or potential short setups.
Risk management and dynamic stop-loss tracking are essential in this volatile range.

Stellar (XLM) Falling Wedge + Inverse Head & ShouldersBINANCE:XLMUSDT has recently broken out of two major bullish patterns:
• Falling Wedge: The breakout above the descending resistance (orange) confirms the wedge setup, with a measured target around $0.70.
• Inverse Head & Shoulders: Breakout confirmed with a measured target around $0.40.
Key Levels to Watch
• $0.30 – 0.618 Fib level. IH&S neckline and current support. A break below it would invalidate the IH&S setup and potentially lead to a retest of the wedge's resistance as support.
• $0.36 – 0.5 Fib level and previous S/R.
• $0.40 – IH&S measured move target.
• $0.50 – 0.236 Fib level and previous resistance / swing high.
• $0.70 – Wedge measured move target.
Volume Analysis
Breakout volume is not as strong as expected, suggesting the need for further confirmation. A continuation with increasing volume would strengthen the bullish case.

XLMUSDT Potential UpsidesHey Traders, in today's trading session we are monitoring XLMUSDT for a buying opportunity around 0.3000 zone, XLMUSDT is trading in an uptrend and currently is in a correction phase in which it is approaching the trend at 0.3000 support and resistance area.
Trade safe, Joe.

XLMUSDT 1D AnalysisXLM ~ 1D Analysis
#XLM Buy on retesting this support block or buy after successfully breaking the resistance line on this pattern with a short term target of at least 10%+.

XLM/USDT Breakdown: Structure Shift & Bearish Retracement Setup🚀 XLM/USDT Trade Outlook 🔎
I've been reviewing the XLM/USDT pair, and it's showing a very familiar setup compared to other majors. 🔁 On the daily timeframe, we've seen a notable shift in structure, with a clear break to the downside. 🧱📉 Dropping into the 4-hour chart, that structural break is even more apparent, adding confidence to a bearish bias. 🔍
Currently, the pair is extended away from value—and I’m anticipating a pullback into the fair value zone, where I’ll be watching closely for a potential short setup. 📐💼
🎯 In the breakdown video, we cover:
The prevailing trend context 🌊
How market structure is unfolding across timeframes 🔂
Price action cues to validate the setup 🎥📈
Key support and resistance areas for both entry and target planning 🎯
For risk management, I’m positioning the stop above the retracement high, using roughly 2x ATR for calculated protection 🛑⚙️. A potential reward could extend to 5–6x ATR, depending on how price reacts around prior structure levels on the left. ⬅️📊
As always, I’m cross-checking with my Fibonacci levels for extra confluence—and the alignment here is looking solid. 🔢🧲
Remember, this is not financial advice. Always do your own due diligence. ⚠️💡📉

XLMUSD: Aggressive surge expected to at least 0.5500Stellar (XLMUSD) just turned bullish on its 1D technical outlook (RSI = 55.377, MACD = 0.005, ADX = 37.056), extending the rebound on its 1W MA50. The long term pattern is a Triangle so for the medium term the upside is limited to 0.55000. Since however the structure from mid 2024 resembles late 2016 onwards (price rising then pulling back to the 0.5 Fib), we expect a rise to the 1.618 Fib (TP = 2.5000) if the price crosses above the LH trendline.
## If you like our free content follow our profile to get more daily ideas. ##
## Comments and likes are greatly appreciated. ##

XLMUSDT 1D AnalysisXLM ~ 1D Analysis
#XLM Buy after successfully penetrating this resistant line with a short -term target of at least 10%+ from here.

XLM/USDT – 3D Long Signal Active 📅 April 29, 2025
The system triggered a long entry at the last 3D bar close.
Currently, the price remains around the same levels.
✅ System conditions for a long are fully met:
MLR > SMA > BB Center > PSAR
Price is trading above the 200 MA on the 3D timeframe.
⚠️ Caution:
On the 1D timeframe, price is still below the 200 MA, which suggests some lingering weakness. Proceed carefully.
📍 Strategy Plan:
Consider entering long at today’s daily close or at the next 3D bar close.
Suggested stop-loss: below the latest PSAR dot for system integrity.
🔔 Keep an eye on updates and thank you for reading! 📈📊

XLM will be one of the big winners during the coming breakout!XLM, which has historically traded closely with XRP, will be one of the big winners during the upcoming breakout in May—potentially continuing into June, July, and even August.
Good luck, and always use a stop-loss!

XLM/USD Main trend. Timeframe 1 week. Channel. Radiant Star of 2218) One of the most “silent” cryptocurrencies. Unlike its fellow clone, pumped up by the community on the ears of pseudo-esoterics (although 589 is not going anywhere, which is, that is, it is not price))))....
Note that past secondary trend reversals are shrinking after significant dips. We are now in the lower zone of the channel, but not at the lowest potential values. Never “catch” the lows and highs, but work most of your position near those values, and you will be happy and relaxed.
I advise you to combine pyramiding (up) + martingale (down), and you won't care where the price goes, because you'll be happy with either direction. It is also rational to protect your profits with stops, but not near intraday volatility.
It is also natural for your peace of mind to forget about two things if you have a mind:
1) Forget margin trading. Work only on spot.
2) Forget the 1 “world's most reliable exchange” (diversification of trading and storage).
Coinmarket: XLM
About the enlightenment: .
1) Instant (less than 3 sec) transactions,
2) Conditionally free transactions $0.000001 (0.00001 XLM micro payments),
3) No network congestion (30 sec refund in case of failed transaction (not to be confused with exchange),
4) Smart contacts and NFT (2022),
5) "Transaction rollback" (this is an advantage, not a disadvantage for real use, not speculation),
6) Support for multi-currency transactions.
7) Interest in XLM blockchain by states.
And much more...
Roughly speaking, all the best worked out solutions from thousands of temporary “faith cryptocurrencies” over the last 10+ years.
Incidentally, many states will be making “transitional” fiat currencies on this blockchain. For example, the long-suffering Ukraine. But then when there will be “total sadness”. Creating a problem—presenting a ready-made solution.
Here's what this important zone looks like on the 1-day timeframe. Key reversal or trend continuation zone.
Breakout of the local symmetrical triangle +10% to the mirror resistance level of 0.2022.

XLM/USDT Secondary trend. 14 04 2025Logarithm. Time frame 3 days. After a big pump "with a stick" (so that the "waiters" who want "a little cheaper" would not have time to buy) +8.5X from the accumulation zone of 2.4 years, now a descending wedge is forming on the rollback, similar to 2017. Breaking through its resistance (breaking the downward trend) - the second wave of price growth:
1) through consolidation and sideways movement (cutting the zone, dumping "in waves").
2) aggressive pump as in 2017 "with a stick" and entry into the main distribution zone (late autumn 2025)
The previous idea of the secondary trend was published on 14 01 2024 Exactly when the position was being collected in the horizontal channel in the 4 zones shown, as well as the reversal zone and the percentage of this first strong pump (under XRP).
XLM/USDT Secondary trend. 14 01 2024
XLM/USD Main trend. Timeframe 1 week. Channel. Publication in 2022.
Local wedge breakout zone.
