XLM/USD - Is Stellar waking up? Stellar day may lead to rally!Stellar Lumens pumped today with a lovely green candle on the daily which has now pushed us right below a major resistance line at $0.42 cents.
The indicators seem primed to take us much higher and break above this key resistance. Can XLM do it?
My bet is on the bulls, as the overall market is heating up. BTC and ETH are just about to break their own ATH... so XLM and the overall altcoin market will start to heat up.
Just a matter of time. If you look for an entry, get in when XLM makes the $0.42 resistance support and ride the pump to $1... which is our current ATH for XLM.
Like and follow if you liked this idea!
XLM

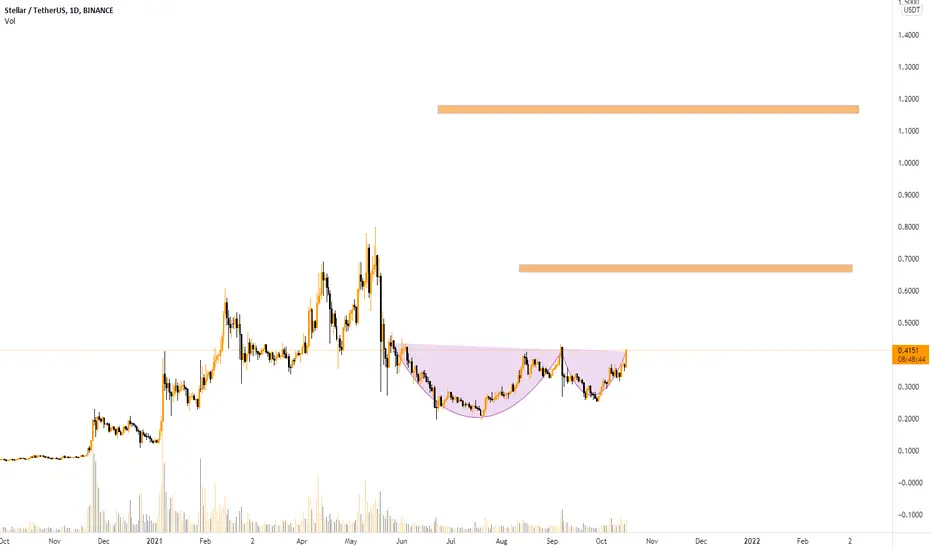
XLM Cup and Handle Pattern is Breaking Out Now!XLM pattern created is Cup And Handle Pattern wich is almost at Breaking out point , my targets are simple new ATH and beyond.! goodluck
Stellar XLM is going up and much further than many thinkIf you aren’t aware stellar is by far the most undervalued high speed (seconds to confirm, pop network. I’ve been accumulating for a long time and it’s not a surprise to see this move up after the Btc pair visit the bottom of range again. Stellar is going well above a dollar soon and I’m just warning you it will happen very fast like ripple. I’d suggest taking a look at lumenswap as well because maybe then normal people can can actually swap coins on a DEX for less than 100 usd. Eth is trash look at how long it’s been since any meaningful upgrade. It’s literally an unusable network to most. Defi is not about the rich getting richer and large entry prices. Stellar can become the center of defi AND the currency coin AND an international transfer of value network.


Ascending Triangle Setup on XLM with 0.4 TargetTrend Analysis
The main view of this trade idea is on the 2-Hour Chart. The cryptocurrency Stellar (XLM) is in an ascending triangle setup, with the resistance line around the 0.326 level and the support trend line making higher lows from 0.26 and 0.3. Expectations are for a breakout, with XLM rallying towards 0.4. This setup will fail if XLM were to decline to below 0.3, towards 0.28.
Technical Indicators
XLM had positive crossovers on its short (50-MA), medium (100-MA) and long (200-MA) fractal moving averages. The cryptocurrency is currently trading above these MAs. The RSI is above 50 and the KSTY recently had a positive crossover. These technical indicators support the bullish view on XLM.
Recommendation
The recommendation will be to go long at market, with a stop loss at 0.28 and a target of 0.4. This produces a risk/reward ratio of 1.59.
Disclaimer
The views expressed are mine and do not represent the views of my employers and business partners. Persons acting on these recommendations are doing so at their own risk. These recommendations are not a solicitation to buy or to sell but are for purely discussion purposes. Currently I have a position in XLM.

XLMUSDT - A littleThis is 1D Chart on ABCD Pattern.
so I think this is a good opportunity for trading .
you can check it and join it after start move.
After BTC Movement , alt coin can start a little move.


$XLMUSDT Elliott Wave Count - It may play this way $XLM - $BTC$XLMUSDT
Elliott Wave Count - I think It may play this way , so lets see
The Stellar network is an open source, distributed, and community owned network used to facilitate cross-asset transfers of value. Stellar aims to help facilitate cross-asset transfer of value at a fraction of a penny while aiming to be an open financial system that gives people of all income levels access to low-cost financial services. Stellar can handle exchanges between fiat-based currencies and between cryptocurrencies. Stellar.org, the organization that supports Stellar, is centralized like XRP (www.coingecko.com) and meant to handle cross platform transactions and micro transactions like XRP. However, unlike Ripple, Stellar.org is non-profit and their platform itself is open source and decentralized.
Stellar was founded by Jed McCaleb in 2014. Jed McCaleb is also the founder of Mt. Gox and co-founder of Ripple, launched the network system Stellar with former lawyer Joyce Kim. Stellar is also a payment technology that aims to connect financial institutions and drastically reduce the cost and time required for cross-border transfers. In fact, both payment networks used the same protocol initially.
Distributed Exchange
Through the use of its intermediary currency Lumens (XLM), a user can send any currency that they own to anyone else in a different currency.
For instance, if Joe wanted to send USD to Mary using her EUR, an offer is submitted to the distributed exchange selling USD for EUR. This submitted offer forms is known as an order book. The network will use the order book to find the best exchange rate for the transaction in-order to minimize the fee paid by a user.
This multi-currency transaction is possible because of "Anchors". Anchors are trusted entities that hold people’s deposits and can issue credit. In essence, Anchors serves as the bridge between different currencies and the Stellar network.
Lumens (XLM)
Lumens are the native asset (digital currency) that exist on the Stellar network that helps to facilitate multi-currency transactions and prevent spams. For multi-currency transactions, XLM is the digital intermediary that allows for such a transaction to occur at a low cost.
In-order to prevent DoS attacks (aka spams) that would inevitably occur on the Stellar network, a small fee of 0.00001 XLM is associated with every transaction that occurs on the network. This fee is small enough so it does not significantly affect the cost of transaction, but large enough so it dissuades bad actors from spamming the network.
Prior to Protocol 12, Stellar had a built-in inflation mechanism conceived to allow account holders to collectively direct inflation-generated lumens toward projects built on Stellar.
As the network evolved and grew, it became increasingly clear that inflation wasn’t working as intended — account holders either didn’t set their inflation destination or joined inflation pools to claim the inflation themselves, and the operational costs associated with inflation payments continued to rise — and so a protocol change to disable inflation was proposed, implemented, voted on by validators, and ultimately adopted as part of a network upgrade.
The inflation operation is now deprecated.

Break the 0.4 weekly resistance ?!as you see the main resistance for long term holders is 0.4$ and if it breaks with a strong candle XLM aim to 2.3 - 4 - 6.5 $
NFA

This is what I see XLM do for the next few weeksThe good old classic XLM bull trap, to bear trap to pump. It has been doing this every single time we are in triangles...

XLM Bullish ! RSI Bullish+capXLM - no resistance to chart and rsi. Great potential for explosive growth.
Cup with handle pattern


XLMBTC Technical Analysis⏳ Spot
💎 XLMBTC is moving along the descending chancel. At the support zone we expect rejection. After the breakout we expect the price to go higher and reaches TPs. The Green candles show that the Bulls are pushing the price higher
🌐 Tradingview
🏁 Short & Medium Term
💵 Invest Only 5% of your Portfolio
🎳 Entry at Market or at 0.00000570
☕️ TP1 0.00000720
🍺 TP2 0.00000850
🍻 TP3 0.00001000
🍾 TP4 ___________
🍷 TP5 ___________
🍸 TP6 ___________
🍹 TP7 ___________
🎁 TP8 ___________
🚫 SL 0.00000535
Good Luck 🎲
Check the Links in Description and If you LIKE this analysis, Please support our page and Ideas by hitting the LIKE 👍 button. ❤️ Your Support is really appreciated! ❤️
Traders, if you have your own opinion about it, please write your own in the comment box. We will be glad for this.
Feel free to request any pair/instrument analysis or ask any questions in the comment section below.
We will have more FREE forecasts in TradingView soon
Have a Profitable Day

XLM Bullish ChannelXLM appears to be in a bullish channel. I wouldn't be surprised if it reached between $0.42 and $0.53 by the end of the year. Its utility for transfer keeps it actively trading. I've been happy to make money using it to transfer other cryptos between exchanges, including fees, because of its upward momentum. Recently announced partnerships are also creating upwards pressure.


XLM LONGBINANCE:XLMUSDT looks like it's heading back towards the resistance area. Long position placed.
Good luck,
Your Ganbu
⚠️ Let me know your feedback and comments below!
⚠️ Follow me if you would like to see more analysis like this
