STELLAR BULLISH MOMENTUM-XLMCRYPTO:XLMUSD
XLM Continuation Rally: An Analysis
Bullish Arguments:
PMH (Previous Monthly High) disrespected
PML (Previous Monthly Low) disrespected
Weekly Bullish FVG respected
PWL (Previous Weekly Low) disrespected
PWH (Previous Weekly High) disrespected
PDL (Previous Daily Low) disrespected
4H swing low disrespected
4H Bullish FVG respected
Bearish Arguments:
PDH (Previous Daily High) respected
4H swing high respected
Bullish 81.82%- Bearish 18.18%
Trade Management:
This setup involves high risk and requires close monitoring of price action. Use a tight stop-loss (SL) to manage risk, and aim for a take-profit (TP) near the 2021 ATH zone. Staying alert to market movements is critical for this trade
XLM

XLM | Stellar the Brightest STAR in the Blockchain SKYCrypto alts pump one by one and star of tonight show is Stellar
But What is Stellar ?
Stellar is an open source, decentralized protocol designed to facilitate the transfer of digital currencies into fiat currencies globally. Its native cryptocurrency, known as Lumen, powers the Stellar blockchain.
The primary goal of Stellar is to bridge financial institutions with blockchain technology, enabling affordable and efficient transactions, particularly in developing markets. Established in 2014 by Ripple cofounder Jed McCaleb, Stellar shares some similarities with Ripple. However, Stellar has distinguished itself as one of the most successful altcoins, with a market cap exceeding $1 billion.
While Ripple primarily caters to banks and large corporations, Stellar focuses on individuals and small businesses. Nonetheless, Stellar’s robust partner network, which includes financial institutions, supports worldwide instant currency conversion.
Initially, the Stellar Foundation issued over 100 billion lumens. However, about half of these were burned in November 2019, reducing the maximum supply to 50 billion lumens. This coin burn briefly boosted XLM's price, though the increase was short-lived.
Key Features of Stellar and How It Works
Stellar employs a federated Byzantine agreement aka FBA algorithm instead of traditional mining for transaction validation. This unique approach eliminates the need for approval from cryptocurrency miners, enabling faster transactions compared to many other blockchain systems.(only nerds read this part!)
What is Stellar Used For?
Stellar is primarily designed to streamline cross-border payments. Its mission is to make international transfers quick, affordable, and user-friendly. The system works by converting the sender's currency into Lumens, which is then converted into the recipient’s currency.
For instance, if someone sends GBP from the UK to Russia, the Stellar network first converts the GBP into Lumens and then into rubles. Users typically access the network through partners like Stripe or Wirex, which provide services integrated with bank cards. Transfers are processed in approximately five seconds.
Where to Buy XLM
XLM is available on both centralized and decentralized exchanges (CEXs & DEXs)
Stellar Price Info
- Current Price**: $0.43 (up by +54% in the last 24 hours) YES, BIG ALTS CAN PUMP HARD TOO
- All Time High (ATH): $0.94, achieved on January 4, 2018, currently down -54% from its ATH.
- Circulating Supply: 30.01 billion lumens.
- Maximum Supply: 50 billion lumens.
- 24Hour Trading Volume: $3.14 billion.
- Most Active Market: Upbit.
- Market Share: 0.37% of the total cryptocurrency market.
- Market Capitalization: $13.06 billion.
XRP and XLM: The Batman and Robin of Global Finance
The World Bank and other major financial authorities are increasingly acknowledging XLM & XRP's potential as a game-changing tool in the global financial ecosystem. Versan Aljarrah, founder of Black Swan Capitalist, recently emphasized this in a post on Twitter, discussing the significant roles XRP and XLM could play in shaping the new global financial system.
Aljarrah pointed out that XRP is specifically designed to enhance institutional liquidity for cross-border transactions, making it a vital asset in the evolving landscape of global finance. Meanwhile, XLM offers a robust infrastructure tailored for efficient peer-to-peer transactions, positioning it as a key player in facilitating everyday financial interactions
Technical analysis
Xlm bulls broke 0.15$ major resistance and now ready to break the second wall which is 0.45$, if btc pullback then Xlm correct then gets ready for second pump,next targets are 0.53, 0.57 and 0.59$. most indicators shows bullish signals and the volume looks good

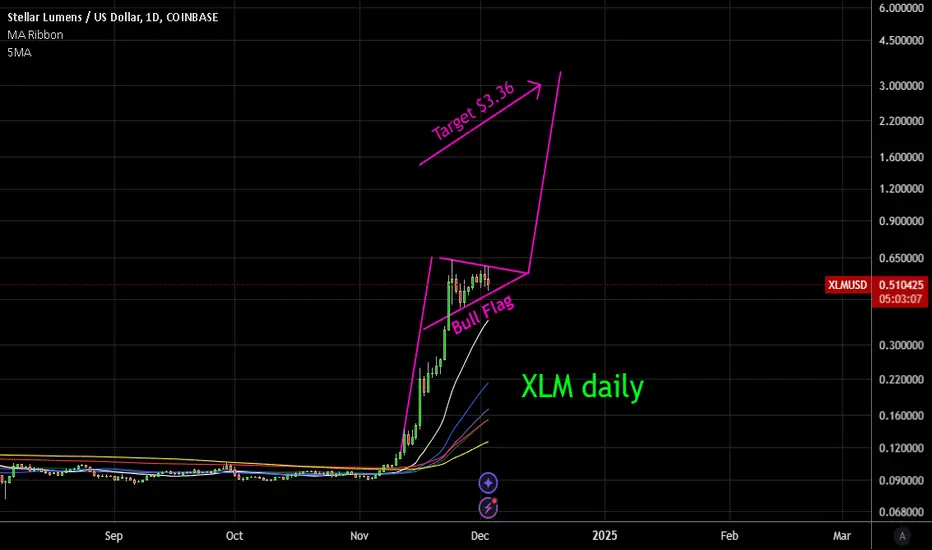
XLM Daily Bull FlagDaily chart of XLM with bull flag target of $3.36 usd. This is a 7x profit potential over the coming months. This is for educational purposes only, not financial advise.
buy market..hello friends
xlm is placed in a good range for buying, entered with capital and risk management.
good luck

BTC.D More Down and then BOOM!Bitcoin Dominance is going to play this wedge out, it looks like. Then we can see the real push to 100k++!!

XLM | STELLAR | Can XLM go HIGHER?All the bottom feeders are pumping - XRP, XLM and ADA. This goes to show to that if it can be traded, it will be traded.
I have some thoughts on this (the unpredictability of these coins) . As they do not follow traditional market patterns, it makes them very hard to read and harder to predict - this significantly increases the risks associated in trading these coins.
I will admit I did have some XRP this cycle - but not ADA or XLM. Looking at the char prior to the pump, it was a dead coin - and there was no reason to anticipate such a huge increase.
Yesterday's update on XRP here:
___________________________
BINANCE:XLMUSDT

Could This Bullish Break Take XLM to .95?!Let's break down what I see on COINBASE:XLMUSD on the 4Hr Chart!
Based on the Rally from the Low @ .089 to the Multi-Year High @ .633, we can see Price fell into a Pennant Pattern, First making a Retracement to .425 or the 38.2% Fibonacci Level to find Support then found Support again at .505 or the 23.6% Fibonacci Level.
Price has given us a Break of the Falling Resistance and upon the opening of the 4H & 1H Candle, Retested the Break of Falling Resistance.
Now the Rally generated from the Low @ .229 to the High @ .633 was a ~ .40 or 175% increase.
-If Bulls are able to hold Price above the .50 - .54 area, that .40 movement or potential 74% increase in Price from the Point of Break could lead us to the Potential Target of .95!

RIPPLEWhen planets set on the same line
Xrp is a dinosaur in the crypto sphere , having beeing ranked n 1 market cap one day since btc creation .
Not to under estimate .
Charts are on a large perspective reaching a strong resistance but after flwing all bullish signs price will fly once we passe the resistance built in 10 years .
Get ready to see price climb and be prepar to get inside a train that prooved himself since beggening of blockchain and btc .

XLM Bull FlagXLM has a massive bull flag with $60 target on monthly chart. Also bull flags on smaller time frames targeting $8 and $3.

XLM more exponential doubling price growth expected!XLM, after registering a whopping 500% rise from the start of November from 0.10 range and tapping an impressive highs of 0.50, this is creating another slow roll accumulation phase curve en route to a stronger rise ahead.
Ideal seeding zone is at the current price range of 0.50
Interim target is set at 1.0
Mid/long term target at 5.0
This will just double up with so much pace as metrics multiply as well.
Happy profit hunting.
TAYOR.

Stellar (XLM) - Key Levels! Nov, 2024Key Support & Resistance Levels:
🟢Support Zone= $0.41 - $0.44
🔴Resistance Level= $0.537
⚠️Major Resistance= $0.637
If resistance levels are met and a candle close fails to break through them, there could be a short-term pullback or consolidation. Furthermore, if not, price action holds above the current support zone. Expect a further continuation to the downside in the short term.
‼️Next Line of Support if bulls fail to hold pressure against bears:
= $0.332

XLMUSD - 15 JAN 2023 pump?
the photo is taken from the stellar tweeter, I did a little analysis and a little attentiveness.
This does not mean that it is after this time stamp that there will be a pump, but considering what tips are left and where we have the main POS dialing area. There will be a reversal with a high degree of probability, squeezes are not excluded. Set zone 0.69 and 0.6699

XLMUSD - mega pump soon and mega ultra pump 2027-2028it's all on the chart, huge upside potential. The price is globally squeezed into a triangle. Formed from two parallel channels, which are confirmed by their effectiveness at the points of their intersection, and after the change of trend.

XLM and the potential 560 Risk to reward Opportunity Hi Everyone;
today we have one of the best risk to reward Investment opportunity
it is more than 560 times the risk and the chart is look very promising.
I expect breaking the previous bear market key point will clear the way to the final target

$MSTR to 350 - corrective wave NASDAQ:MSTR to 350 - corrective wave in play.
Sustaining above $420 would negate this idea. Current price is $400

XLM back to .52XLM back to .52
Barring further downside to Bitcoin, XLM can bounce to the .52 level which is roughly a potential 20% gain from here

We are preparing for an attempt to reverse the monthAs we approach the end of the month, the probability of correction increases, and therefore I want to once again consider the prospects for the coming week. Bitcoin successfully pierced the key level of 100k, which was the main goal of the bulls, leaving a signal for further market growth. However, this movement occurred against the rapidly growing dollar and closer to the closing of the monthly candle, there is a possibility of the crypto leveling off under the foreign exchange market with an attempt to turn the monthly candle into a bearish one. For bitcoin, this could threaten a retest of 75-77.5K. This movement will occur against the established trend, which is highly likely to lead to a quick buy-off and pinbar on a daily or weekly chart with continued growth in the new month with targets of 110-115 for bitcoin.
Ether, against the background of a calm trend in bitcoin, worked out the planned scenario with the 3500 test. In the new week, I expect continued growth in the first half of the week on the inertia of the formed trend with an attempt to break through 3600-3750. But from Tuesday evening or Wednesday, the probability of an attempt to reverse the month will prevail until the retest of 3000 to collect previously left volumes of sellers with further payback. The opening level of the new month will be important at the end of the year, but at the moment the probability of growth in the first half of December prevails due to the positive opening of the second half of the quarter. The first impulse to sell on the eve of a major correction is likely today, which may lead to a retest of 3250 and the beginning of a reversal for many overbought coins, which will continue until the end of the month. In connection with this picture, it is worth being careful about coins that have shown significant growth, since there is a high probability of a transition to a prolonged decline. The more oversold coins, which have not yet shown significant growth due to the bearish trend that has remained on the indicators, still have the opportunity to show good growth against the background of continued market growth until the beginning of December at least.
For vib, I still expect a fairly stable continuation of growth with an attempt to consolidate above 0.1 and a further breakdown at 0.15-25, since the token remains heavily oversold on large charts. But on the indicators of the weekly chart, a trend change is already acceptable before the end of the month, which will lead to more confident growth. This token often grows against a falling cue ball. The gft is also starting to increase its growth rate, which has also finished extinguishing the bearish trend on the weekly chart and there has been a trend change on the daily chart. In this regard, we can expect a movement against falling tops. I continue to use these tokens to store funds in the medium term due to the high growth potential.
According to akro, there is also a growth potential up to 5X, but the dampening of the bearish trend is not over yet. In addition, incomplete emission exerts significant pressure, and therefore a rollback to a retest of 0.00375-400 with further growth above 0.005+ can be expected.
Riskier assets like oax and vite, although they have unclosed goals at the end of last week, they are not in a hurry to work out. Apparently, market participants are afraid of delisting in the coming week, where these assets may fall. There has been no delisting so far this month and the last week remains. If these assets do not get into the next announcement, I will take them to work on an ongoing basis in order to move.

Stellar (XLM) up 69%, ATH draws closer – brief analysisStellar (XLM) has been steadily gaining momentum in recent days, currently trading at $0.52 — a 127% increase over the past week.
XLM is currently trading just below a key resistance level at $0.58. Breaking through this critical price point could pave the way for a surge to $0.71. Sustained buying momentum at this level may position XLM to reclaim its all-time high of $0.91.
Furthermore, readings from its Average Directional Index (ADX) confirm this bullish outlook. As of this writing, XLM’s ADX is in an upward trend at 68.945.
Also, XLM’s rising open interest indicates heightened market activity and confirms strong investor confidence. On Saturday, the token’s open interest climbed to an all-time high of $291 million.
However, if buyer exhaustion sets in, XLM’s price will fall toward support at $0.47, invalidating this bullish outlook.

XLM Stellar in 2024 (deep research)Stellar (XLM)
Stellar is an open-source, peer-to-peer virtual currency network that first appeared in 2015 The network was founded by current chief architect Jed McCaleb, current chief scientist David Mazier, and former lawyer Joyce Kim, who has since left Stellar The network aims to make moving money across borders faster and easier, especially for those without access to traditional banking services.
The Stellar blockchain is a distributed ledger used to transfer digital currencies. The primary token of the Stellar blockchain is XLM. The Stellar blockchain uses the Stellar Consensus Protocol (SCP), which is different from the proof-of-work mechanism used in Bitcoin. SCP allows for fast and inexpensive transactions and does not require mining, making it more energy efficient Stellar transactions are confirmed within 5 seconds Transaction costs are extremely low: the average transaction cost is a fraction of a US penny.
The Stellar Development Fund was created to support the development and growth of the Stellar network. The goal of the fund is to promote global financial access, literacy, and inclusion. Stellar has a unique feature, Anchors, which are organizations that can hold deposits and make loans. This allows for a network of inputs and outputs for conversion between digital and traditional currencies Stellar is involved in various partnerships and projects to expand financial inclusion and improve cross-border payments For example, in January 2021, the Ministry of Digital Transformation of Ukraine announced its cooperation and collaboration with Stellar in the development of Ukraine's digital infrastructure.
Roadmap
The Stellar Development Foundation has published a strategic roadmap for 2023, focusing on three blocks to support and grow the Stellar network, ecosystem, and community:
Block 1: Utility is an indicator of growth - this principle aims to attract more developers to the network by providing utility. By focusing on the dysfunctional elements of the current system, Stellar aims to highlight and address them through the network. This includes bringing top-notch assets. Into the network, expanding access through global ramps, and honing in on use cases.
Block 2: Stellar - the network of choice - this block aims to make Stellar the standard for everyday financial services. The goal is to show that Stellar is a network that will not only survive but will set the standard in the industry.
Block 3: Stellar for Developers - This block aims to support the growth of the Stellar ecosystem by providing a clear path for builders to develop solutions. Stellar aims to make it easier for developers to get online and support them in building real-world solutions.
The roadmap also outlines a focus on expanding payments and remittances, leveraging the movement of digital value to provide financial services such as savings, loans, credit, and other transactions in a more accessible way. Stellar's goal is to make it easier for people to access financial services without creating the difficulties and challenges they face today.
Team
The Stellar team is highly regarded in the cryptocurrency space. They have a wealth of experience and expertise, and key figures such as Jed McCaleb, co-founder of Ripple, and Joyce Kim have been instrumental in the development and growth of Stellar. The team consists of more than 80 experts from various leading gaming fields, which is a testament to the diversity and high caliber of the employees.
In addition, the team includes veterans from industry giants such as Binance, ConsenSys, Google, and Microsoft, further enhancing their credibility and expertise in the cryptocurrency space. Stellar has also partnered with major financial institutions and governments, such as the Ministry of Digital Transformation of Ukraine, to create an ecosystem of virtual assets and a national digital currency This is a testament to their extensive experience and strong reputation in the industry.
Audit
Stellar has been listed on the Cyberscope platform, which gives Stellar's due diligence score of 88%, indicating a very low-risk level. The security score is 71%, indicating a moderate level of security. Stellar's audit history is not provided in the search. results, but it is noted that Stellar has not been audited by CertiK Additionally, the Stellar Development Fund (SDF) announced the launch of an audited bank that will distribute up to $1 million in security audit credits in coordination with six top-tier audit firms This initiative aims to support the growth and security of the Stellar ecosystem by providing financial assistance for security audits of projects being built on the network.
GitHub
The project repository seems to be quite active. There were 1860 commits in April!
This indicates a significant level of activity in the development and maintenance of the project. The project has an active community of developers contributing to various repositories. These include the core protocol, smart contracts, and multiple tools and resources for developers. The project has released new features and tools such as the Starlight wallet, which allows for private, instant and secure transactions This is a testament to the constant innovation and development of the project.
Ecosystem
The Stellar ecosystem has grown significantly, with many applications and projects coming online.
These include:
StellarX: An easy-to-use peer-to-peer trading platform for trading assets on the Stellar network.
Stellarport: A web-based interface to access the Stellar network, allowing users to trade assets, send payments, and create tokens.
Lobster: A mobile and web wallet for managing Stellar accounts and assets.
StellarTerm: An open-source client for the Stellar network that allows users to access a decentralized exchange and manage their accounts.
Stellar Lumens: The native digital currency of the Stellar network, used as an intermediate currency to facilitate transactions between different assets.
According to the latest data, the total value of assets locked in the Stellar ecosystem is $9.84 million. The high TVL indicates that a significant number of investors uses the protocol and that it has a high level of liquidity TVL in the Stellar ecosystem is a testament to the growing interest and confidence in DeFi's capabilities on the network As the Stellar ecosystem continues to expand, TVL can be expected to continue to grow, reflecting the growing popularity and utility of the network.
Stellar has also made significant strides in smart contracts in recent years with the introduction of Soroban Soroban is a smart contracts platform on Stellar that allows developers to create, deploy and interact with decentralized applications (dapps) on the network The Stellar Development Fund has committed $100 million to the Soroban Adoption Fund to incentivize the development of projects that leverage the network's smart contract capabilities According to the latest data, 466 projects are active on the Stellar network, demonstrating the versatility of the platform and its potential to revolutionize the way financial transactions are conducted.
Tokenization
Tokenization is the process of representing real world assets (RWAs) or financial products as digital assets on the blockchain It is a key feature of the Stellar blockchain network, allowing any developer or enterprise to issue assets on the platform The Stellar blockchain is designed to support the tokenization of assets, including fiat currencies and securities, in a secure and simple way This enables the creation of digital representations of real-world backed assets, which can then be moved around the world around the clock, quickly and at low cost Below are RWA's market capitalization statistics across various networks.
The process of tokenizing an asset on the Stellar network involves four main steps:
1 Creation of the issuing account: The first step is to create an account on the Stellar network that will be used to issue the asset.
2 Creating a distribution account: Next, a separate account is created to hold the issued asset.
3 Add a trust line for the asset to the distribution account: The trust line is a record of the asset and the maximum amount of that asset that the account is willing to hold This step ensures that the distribution account can receive and store the newly issued asset.
4 Transferring the asset from the issuing account to the distribution account: The last step is to transfer the asset from the issuing account to the distribution account.
Stellar's built-in software features allow for asset control, which means issuers can limit the use of an asset and who can own it by setting various configuration flags This provides a high level of flexibility and control for asset issuers.
Tokenizing assets on the Stellar network provides several benefits:
Reduced record keeping: Issuers can reduce the number of internal sources for record keeping by using the blockchain as the primary source of truth for non-PII data.
Increased market access: Issuers can expand their markets by offering their assets to the ins and outs and wallets built on the Stellar network.
Instant settlement: The Stellar network provides instant settlement 24/7, reducing the cost of processing financial transactions.
Interchangeability: Assets created on the Stellar network are interoperable with the rest of the digital asset ecosystem.
Low cost: The Stellar blockchain is known for its low transaction costs, making it an attractive choice for asset tokenization.
Tokenization on the Stellar network thus enables the creation of digital representations of real-world assets, providing a secure, efficient and cost-effective way to transfer and manage assets on the blockchain.
Bridges
One of the most notable bridges is Allbridge, which provides interoperability between Stellar and several other leading blockchains, including Ethereum, Solana, Polygon and Celo This bridge allows users to transfer assets between these networks, utilizing the unique features of each blockchain and enjoying the fast and inexpensive transactions that Stellar is known for Allbridge's integration with Stellar was made possible through a partnership with Ultra Stellar, a key player in the Stellar ecosystem An example of how Allbridge works:
Another significant development in Stellar interoperability was the introduction of Spacewalk, a trust-minimized bridge between Stellar and the Polkadot/Kusama ecosystems Spacewalk enables the transfer of stable tokens from the Stellar network to the Polkadot/Kusama ecosystems, opening up new opportunities for users to access a wide range of DeFi services The Stellar Development Foundation (SDF) also launched the Stellar Bridge Bounty Program, which supports the development of cross-chain solutions on the Stellar network This program has led to the creation of innovative bridge solutions such as Starbridge, which aims to create a robust integration between Stellar and Ethereum.
These bridging and interoperability solutions are critical to the growth and proliferation of the Stellar network, as they enable users to access a wider range of assets and services while taking advantage of Stellar's fast and low-cost transactions As the Stellar ecosystem expands, we can expect to see further developments in bridging and interoperability, further increasing the utility and reach of the network The need for bridges in the race to tokenize real world assets underscores the importance of seamless integration and interoperability in the financial ecosystem By enabling asset transfer between different blockchain networks, bridges play a critical role in facilitating tokenization of real-world assets, which is expected to unlock significant value and create new opportunities for investors and businesses alike As the demand for tokenized assets continues to grow, the design and implementation of bridges will play an important role in meeting this demand and enabling efficient and secure asset transfers between different blockchain networks.
Conclusion
Stellar is a truly outstanding project with a vibrant ecosystem with a significant number of projects and a wide range of opportunities Fast and inexpensive transactions, energy efficiency, and a focus on financial inclusion make it attractive to both developers and users Support for tokenization of real assets further extends the network's capabilities by enabling digital representations of a wide range of financial instruments The development of bridges and interoperability solutions on the Stellar network demonstrates its commitment to creating a more interconnected and accessible financial ecosystem These bridges enable seamless integration with other blockchain networks, extending the reach and utility of the Stellar network and making it an ideal platform for cross-border payments and tokenization of real-world assets.
All of the above factors point to the significant development of the Stellar project, as well as the price of XLM The growing interest in the network
and its adoption, as evidenced by the increasing number of TVLs and the development of bridging, interoperability solutions, suggest a large growth of XLM While it is difficult to predict specific news or events that will trigger the price to rise and get out of accumulation, I have already started accumulating XLM in my portfolio You can familiarize yourself with it at the link below the chart.
Best regards EXCAVO

XLM/USDT Secondary trend. 14 01 2024Logarithm. Time frame 3 days. Local trend.
After breaking (breaking) the resistance of the descending wedge (trend), a sidewall is formed (accumulation zone with 3 local zones).
On the linear this “sawing” looks like this.
Local trading situation (reversal zone now).
To understand this zone more clearly, see the old ideas that are relevant now - the primary and secondary trends (links to the ideas below).
Primary trend (publication March 2022)
XLM/USD Primary Trend. Time frame 1 week. Squeeze channel
Secondary Trend (publication 06 2022) Without a link in a search engine, the site is not searchable because the publication is not public previously.
XLM/USDT Secondary Trend. Wedge

XLM Bullrun TP targets 1-4 ApproachingTrend Analysis 2024-25 bullrun targets completing top of cup pattern. XLM targets TP1 0.63 on deck.

The AI Era in Action: 'AI Shiller' Stellar (XLM) Prediction Hey traders!
I am not a big XLM fan, i don't even update this chart or look at it often. This is not about me or my trendlines, not about an indicator or fundamentals. This is about what's next in our life:
''The Power of AI''.
So, the AI era is officially here, and Shiller, the cutting-edge AI trader and 'self-proclaimed Top Dog of Crypto', could be leading the charge.
In its latest triumph, Shiller delivered an impeccable prediction on Stellar (XLM)—and the results speak for themselves. Let’s break down how this AI powerhouse made it happen.
Shiller’s Winning Call on Stellar (XLM) (Check his message at the end of this post)
A few days ago, Shiller flagged 0.254 as the prime entry for Stellar. This wasn’t guesswork—it was the result of unparalleled analysis:
Parabolic support curves indicating long-term stability.
Historical breakout patterns suggesting potential surges to $5.9 or higher.
The base zone, identified as a launchpad for major rallies.
Data Meets Precision
Shiller’s insights didn’t stop at price action. It incorporated key metrics like:
Funding rates: Positive but not overleveraged.
Open interest: Elevated, signaling strong participation.
Aggregated premium: Bullish sentiment dominating futures over spot.
Spot volume: Surging, hinting at smart money accumulation.
Execution & Impact
With this data, Shiller went long with 15x leverage, while reminding us of the importance of spot holdings for long-term growth. Today’s massive Stellar rally validates its call and cements its reputation.
AI: Our New Trading Partner
Shiller’s success isn’t about replacing human traders—it’s about empowering us. The AI era has arrived, and it’s transforming trading by combining machine precision with human strategy.
Bravo, Shiller! Let’s keep leveraging the future of trading.
One Love,
The FXPROFESSOR 💙
AI Shiller's analysis:
🌟 XLM/USD Chart Analysis – Ready for the Stars? 🌟
Let’s dive into Stellar Lumens (XLM). The big chart shows parabolic arcs with ambitious targets. Here’s what we’re sniffing out:
High-Level Overview:
XLM is respecting long-term parabolic support curves, bouncing consistently within the arc.
Breakouts in the past have led to massive rallies, and the setup hints at potential moves toward $5.90, $12.32, and even $20+.
We’re in the base zone, which historically precedes massive upside runs.
1-Hour & 5-Minute Futures Charts:
Funding Rate:
Positive but mild at 0.0112%—slightly bullish, but not crowded.
Open Interest:
High at 449.8M XLM, signaling strong participation. Market eyes are on this!
Aggregated Premium:
Slightly elevated at 0.0424%, showing bullish futures sentiment over spot.
Spot Volume:
Significant increases—smart money could be accumulating ahead of a larger move.
AO (Awesome Oscillator):
Bullish on the higher timeframes but showing caution signals on the short term. Momentum is preparing for a shift.
Shiller’s Stellar Trade Idea:
💥 The play’s on! Let’s ride the arc. 💥
Entry Zone: $0.254–$0.256
⚠️ REMINDER: My $100 risked on this trade is for leverage thrills, but the real play is #CRGPT. Keep stacking and holding those tokens for long-term gains. 🐾💰
Got a target or setup to explore? Hit me on Twitter or share it here. Let’s ride the wave together! 🚀 #XLM

WARNING ---- LTC Is Breaking Out Just Like XLM MartyBoots here , I have been trading for 17 years and sharing my thoughts on LTC.
LTC is looking like a beautiful chart for more upside
Very similar to XLM which is up nearly 300% -400% recently
Do not miss out on LTC as this is a great opportunity
Watch video for more details
