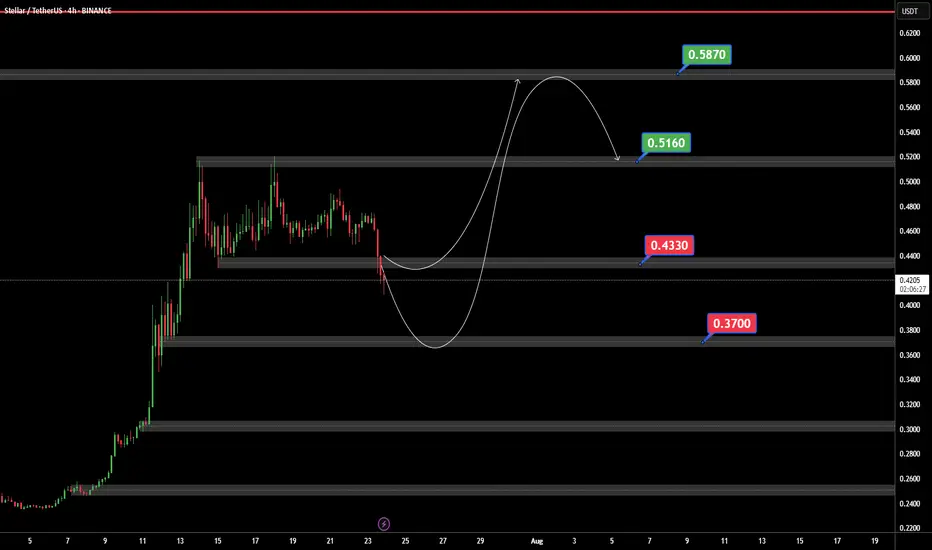
XLMUSDTIf BINANCE:XLMUSDT can support 0.4430 $ ready for jump to 0.5160 and best target in 0.5873 $.
But if XLM can price breaked 0.4330$ support we ready for a bear trend.
Xlmbtc
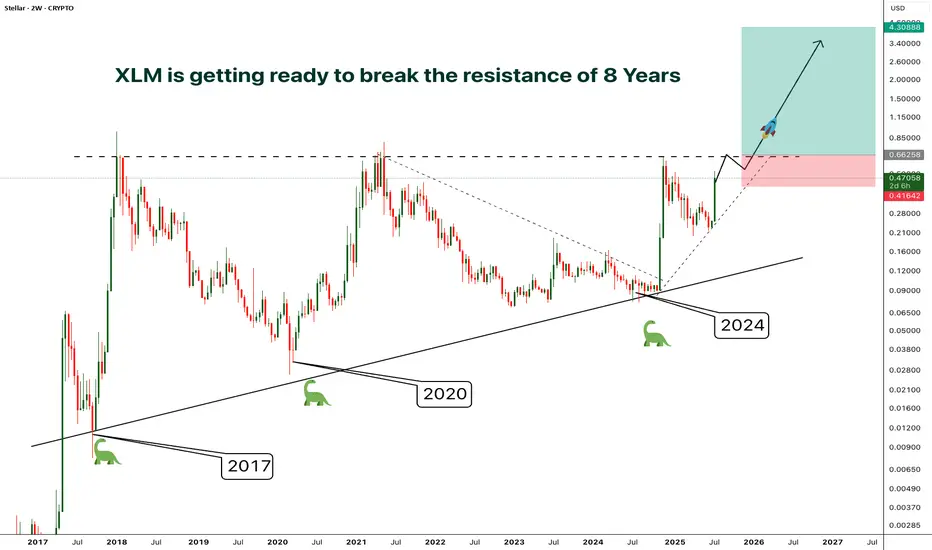
XLM - Resistance/Consolidation of 8 Years- Finally after 8 years of consolidation and getting rejected by the resistance at the same level around 0.65, XLM is preparing to break out from the almost decade old resistance
- A clear breakout from this resistance will phenomenal
- The price surge after the breakout will be unlike anything you've ever seen.
- I'm planning to enter after a confirmed breakout, entry before the breakout will be risky in case if the price gets rejected again.
Entry Price: Candle closeAbove 0.65
Stop Loss: Below 0.41
TP1: 0.88574
TP2: 1.21012
TP3: 1.92545
TP4: 2.68849
TP5: 4.27772
Don't forget to keep stoploss
Cheers
GreenCrypto
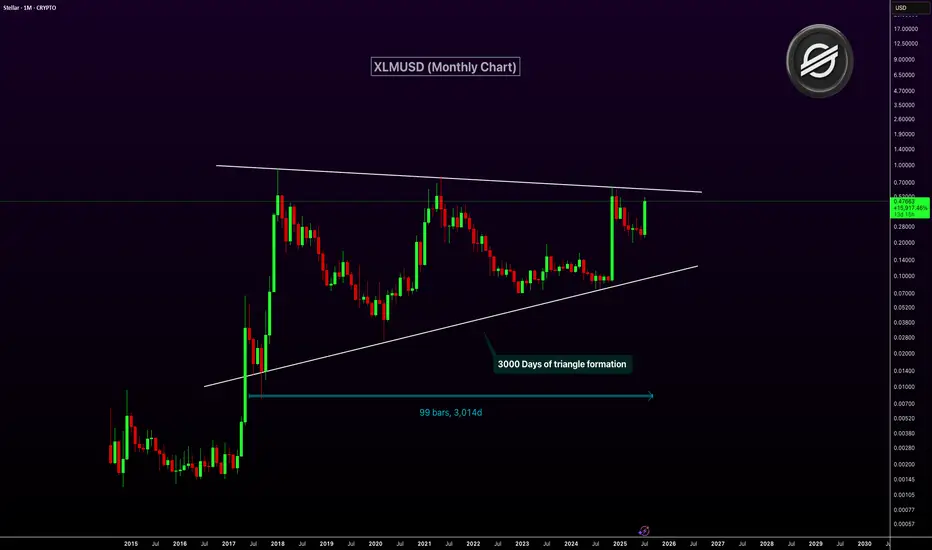
XLMUSD Nearing Breakout After 3,000-Day Triangle FormationXLM has been consolidating inside a massive symmetrical triangle for over 3,000 days. This long-term pattern on the monthly chart dates back to 2017. The price is now approaching the upper resistance trendline of the triangle. A breakout from this structure could ignite a major bullish rally.
The current monthly candle shows strong momentum with over 100% gains. A confirmed breakout above resistance could mark the start of a macro uptrend. This triangle is one of the most significant technical setups in XLM’s history.
Target 1: $1.00
Target 2: $2.50
Target 3: $5.00
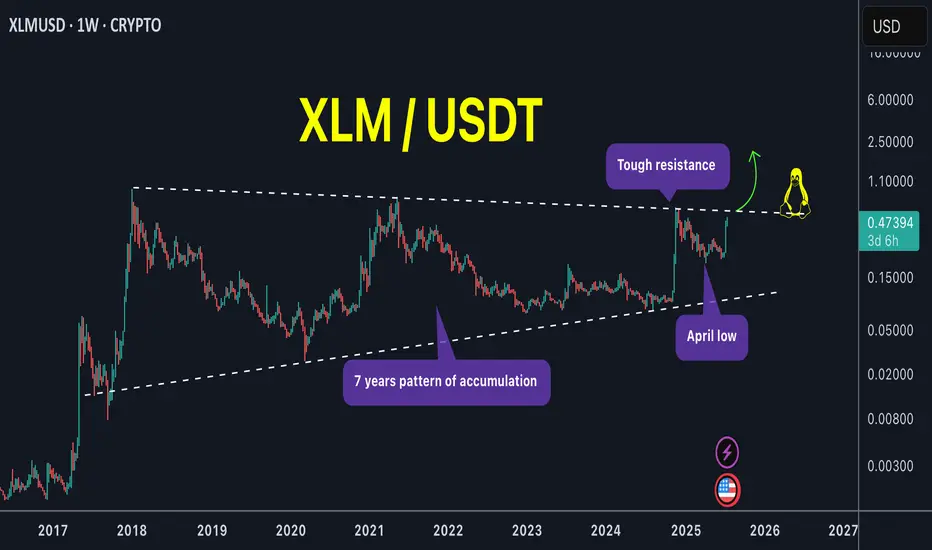
XLM is the pump over or just getting started !XLM / USDT
What a huge weekly candle! We catched its strong move very early around 0.29$ a week ago (75% profits locked in spot)
With a zoom out chart we can see price is setting up nicely with several tests of pattern boundary. Next test of the upper boundary can lead to huge breakout of this mega pattern !
NOTE: Price must not close below april low and should close above upper boundary unless that its just a range
Keep an eye on it closely !
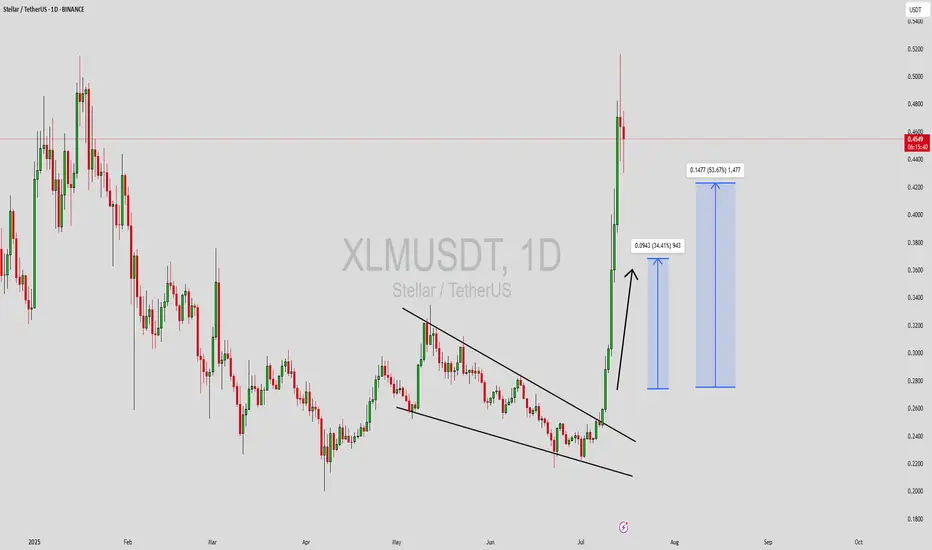
XLMUSDT Forming Falling WedgeXLMUSDT (Stellar) has recently delivered an impressive breakout from a prolonged downtrend, indicating strong bullish momentum following the completion of a falling wedge pattern. This pattern, known for its high probability of signaling a bullish reversal, was confirmed as price exploded upward with increasing volume — a textbook breakout scenario. After a period of consolidation, Stellar surged sharply, catching the attention of both technical analysts and long-term investors.
Volume is playing a key role in this rally. The sharp rise in buying pressure is a strong sign that institutional and retail investors are accumulating XLM, possibly in anticipation of a sustained move. The breakout zone now acts as a major support area, and we may see price revisit this level briefly before resuming its next upward leg. If the bullish sentiment continues, we can expect gains in the range of 40% to 50%+ from current levels, with strong momentum and follow-through likely in the short term.
The broader sentiment around Stellar has been improving as well, with increased interest in its blockchain utility, particularly in the cross-border payments space. As investor confidence builds and momentum traders join in, the probability of another leg higher strengthens. Technical setups like this, combined with solid fundamentals and growing on-chain adoption, provide compelling opportunities in a recovering market.
✅ Show your support by hitting the like button and
✅ Leaving a comment below! (What is You opinion about this Coin)
Your feedback and engagement keep me inspired to share more insightful market analysis with you!
XLM/USDT;FREE SIGNALHello friends🙌
Given the good price growth, you can see that the price has entered a channel, which has caused the price to form a flag...
Now, with a strong channel breakdown by buyers and their entry, you can enter the trade with risk and capital management and move with it to the specified targets.
🔥Join us for more signals🔥
*Trade safely with us*

XLMBTC To Enter Its Biggest Bull Market Ever · 4,855% In 2017Stellar. No bull market vs Bitcoin in 2021. You know what this means? We are due an ultra-strong bull market for XLMBTC in 2025 (and beyond).
The 2017 bull market lasted 308 days. Total growth reached 4,855% within this period. The bear market that followed was brutal. From January 2018 until November 2024. A total of 2,499 days of bearish action.
A bottom was hit 4-November 2024 and the proceeding week we saw a major advance. This was a 400% bullish wave. Now this wave is over with a correction and the correction ended in a classic higher low. This week we have a new bullish breakout and this is the continuation of the uptrend, the first time XLMBTC goes bullish since 2017. It seems this pair will continue bullish even after Bitcoin peaks. Who knows, maybe even years going up.
The chart is solid and supports additional growth. We are due a strong rise, the biggest ever for this pair.
Thank you for reading.
Namaste.

XLMUSDT, We are near buy zone areaHello everyone
According to the chart that you can see , the price is in correction wave and we think the price should come and do the end of corretion in buy zone area and after that is ready to move up , you can buy in 2 part in each of the buy zone area and after that at least 50% percent profit is near to us.
Be lucky
AA

XLM Looks Bearish (1D)It seems to be pulling back within the internal structure. From the supply zone, it may move toward the green zone. The green zone is a strong area where we can consider rebuying.
A daily candle closing above the invalidation level will nullify this analysis.
For risk management, please don't forget stop loss and capital management
Comment if you have any questions
Thank You

XLM/USDT(BUY)hello friends
According to the formation of a QM model, it is possible to enter into a transaction with risk and capital management.
*Trade safely with us*

XLM Buy/Long Setup (12H)After heavy drops, it is approaching a key support level.
It is expected to bounce upward upon hitting this support.
A daily candle closing below the invalidation level will invalidate this analysis.
Let’s see what happens.
Do not enter the position without capital management and stop setting
Comment if you have any questions
thank you

XLM will have a decision#stellar #xlm price is now testing a major resistance zone, now. This zone is also the bearish retest zone of where CRYPTOCAP:XLM broke the support. So, this retest will be very important.

XLM - Taking Over EUROPEAN BANKS MartyBoots here , I have been trading for 17 years and sharing my thoughts on xlm here.
xlm is looking beautiful , very strong chart for more upside
Very similar to XRP which mooned and will go higher
Do not miss out on xlm as this is a great opportunity
Watch video for more details

Stellar (XLM) Price Breakout Fuels 30% Surge Hopes
Stellar Lumens (XLM), the cryptocurrency designed to facilitate fast and low-cost cross-border payments, has recently shown signs of a potential breakout, sparking speculation about a significant price surge. After a period of relative stagnation, XLM has demonstrated renewed momentum, capturing the attention of traders and investors alike. This article delves into the factors contributing to this potential breakout, examines technical indicators, and explores whether a 30% surge is a realistic possibility.
Stellar’s core mission is to provide an efficient and inclusive financial ecosystem, particularly for underserved populations. It aims to streamline international transactions, making them faster, cheaper, and more accessible than traditional banking systems.1 This focus on real-world utility has always been a strong foundation for XLM, and recent developments suggest this utility is beginning to translate into market action.
Factors Driving the Potential Breakout:
Several factors contribute to the current bullish sentiment surrounding XLM:
• Increased Network Activity: A key indicator of a healthy blockchain network is its level of activity. Recent data suggests a significant uptick in transactions on the Stellar network. This increased usage indicates growing adoption and demonstrates the platform’s real-world utility. This increased activity could be attributed to new partnerships, integrations with existing financial institutions, or the organic growth of its user base.
• Growing Institutional Interest: While not as prominent as Bitcoin or Ethereum, Stellar has been quietly attracting institutional interest. Its focus on regulated financial services and its compliance-friendly approach make it an attractive option for institutions seeking to explore the potential of blockchain technology. Increased institutional involvement often translates to larger trading volumes and can significantly impact price action.
• Favorable Regulatory Landscape: The regulatory landscape for cryptocurrencies is constantly evolving. Positive regulatory developments, particularly those related to cross-border payments and digital assets, can create a favorable environment for projects like Stellar. Clearer regulations can foster greater confidence among investors and encourage wider adoption.
• Technical Indicators: From a technical analysis perspective, XLM has shown promising signs. Recent price action has seen XLM break through key resistance levels, suggesting a shift in momentum.2 Trading volume has also increased, further supporting the bullish narrative. Several technical indicators, such as moving averages and relative strength index (RSI), point towards a potential upward trend.
• Focus on Decentralized Finance (DeFi): While Stellar isn't primarily known for DeFi, the network has seen increasing development in this sector. The growth of DeFi applications on Stellar could attract new users and capital to the ecosystem, further driving demand for XLM.
Technical Analysis and Price Prediction:
Analyzing XLM's price charts reveals a potential breakout pattern. The price has been consolidating within a defined range for a period, and the recent break above this range suggests a potential shift towards an upward trend. This breakout is further supported by increased trading volume, indicating strong buying pressure.
Several technical indicators suggest a bullish outlook:
• Moving Averages: The price of XLM has crossed above key moving averages, such as the 50-day and 200-day moving averages, which are often interpreted as bullish signals.
• Relative Strength Index (RSI): The RSI, a momentum indicator, is showing increasing strength, indicating growing buying momentum.
• Volume: The increased trading volume accompanying the price breakout provides further confirmation of the bullish trend.
Based on these technical indicators and the current market momentum, a 30% surge is a plausible scenario. However, it’s crucial to remember that the cryptocurrency market is highly volatile, and price predictions are not guaranteed.3 Several factors could influence XLM’s price action, including overall market sentiment, regulatory developments, and competition from other cryptocurrencies.
Is a 30% Surge Realistic?
While the technical indicators and fundamental factors suggest a potential for significant price appreciation, a 30% surge should be considered a potential target rather than a certainty. The cryptocurrency market is known for its volatility, and unforeseen events can quickly change market sentiment.4
Conclusion:
Stellar’s XLM is showing promising signs of a potential breakout. Increased network activity, growing institutional interest, favorable regulatory developments, and positive technical indicators all contribute to the bullish sentiment. While a 30% surge is a realistic possibility based on current trends, investors should exercise caution and conduct thorough research before making any investment decisions. The cryptocurrency market is highly volatile,5 and it’s essential to manage risk effectively.6 However, the current momentum surrounding XLM suggests that the project is well-positioned for future growth and could offer significant potential for investors. The focus on real-world utility and the development of the Stellar ecosystem continue to be key factors to watch in the coming months.

#XLM/USDT Ready to go higher#XLM
The price is moving in a descending channel on the 1-hour frame and sticking to it well
We have a bounce from the lower limit of the descending channel, this support is at 0.4300
We have a downtrend on the RSI indicator that is about to be broken, which supports the rise
We have a trend to stabilize above the moving average 100
Entry price 0.4434
First target 0.4590
Second target 0.4746
Third target 0.4927

XLM SHORT Stellar Lumens 5-15min Chart:It appears to me there will be a shorting, so I am looking at a short-term scalp short on XLM 5min chart. Tradingview would not let me publish 5min so I am publishing on a 15min chart.

xlm long!"🌟 Welcome to Golden Candle! 🌟
We're a team of 📈 passionate traders 📉 who love sharing our 🔍 technical analysis insights 🔎 with the TradingView community. 🌎
Our goal is to provide 💡 valuable perspectives 💡 on market trends and patterns, but 🚫 please note that our analyses are not intended as buy or sell recommendations. 🚫
Instead, they reflect our own 💭 personal attitudes and thoughts. 💭
Follow along and 📚 learn 📚 from our analyses! 📊💡"

XLM MID-TERM AND LONG TERM ANALISYSThere is significant demand for analyzing Stellar.
Upon examining the chart, it seems that Stellar is currently within a triangle.
Wave D will likely end around previous highs.
Afterward, we could see a correction for wave E, followed by Stellar's post-pattern movement targeting a level above $14.
Some might question whether Stellar can sustain such a market cap. We should emphasize that we rely on chart analysis and do not focus on fundamental issues, as fundamentals are reflected in the chart itself.
When we reach wave E of the triangle, if we observe a clear and identifiable pattern, we can position ourselves on Stellar for the main move.
For risk management, please don't forget stop loss and capital management
Comment if you have any questions
Thank You

XLM/USD: Signs of Overextension and Impending CorrectionStellar (XLM) experienced a dramatic surge, skyrocketing from $0.09 on November 7 to a local high of $0.63 on November 24. This rapid rise of over 600% in just a few weeks indicates clear overextension in the market. Such sharp upward movements are often unsustainable without periods of consolidation or correction.
Current Market Context:
Current Price: $0.48
Recent High: $0.63
Key Support Levels: $0.36, $0.25
After hitting $0.63, XLM has pulled back to $0.48, a strong signal that the market may need a correction to stabilize. This retracement reflects profit-taking and waning momentum, both common after such parabolic moves.
Possible Correction Scenarios:
Moderate Pullback to $0.36:
The first likely scenario involves a pullback to $0.36, a key support level that aligns with previous consolidation zones. This would allow for healthy price action and create a foundation for future bullish attempts.
Deeper Correction to $0.25:
If selling pressure intensifies, XLM could retreat to $0.25, representing a more substantial correction. This level is critical for maintaining a broader bullish structure and could attract buyers looking for value.
Market Indicators:
The RSI (Relative Strength Index) shows signs of overbought conditions, suggesting further downside pressure.
Volume has also declined since the peak, indicating weakening buying interest.
In summary, the overextension from $0.09 to $0.63 signals a market that may need to cool down. The current decline to $0.48 underscores the likelihood of a correction, with key support levels at $0.36 and $0.25 in focus. A healthy pullback could reset the market for a more sustainable rally in the future.

XLM | Stellar the Brightest STAR in the Blockchain SKYCrypto alts pump one by one and star of tonight show is Stellar
But What is Stellar ?
Stellar is an open source, decentralized protocol designed to facilitate the transfer of digital currencies into fiat currencies globally. Its native cryptocurrency, known as Lumen, powers the Stellar blockchain.
The primary goal of Stellar is to bridge financial institutions with blockchain technology, enabling affordable and efficient transactions, particularly in developing markets. Established in 2014 by Ripple cofounder Jed McCaleb, Stellar shares some similarities with Ripple. However, Stellar has distinguished itself as one of the most successful altcoins, with a market cap exceeding $1 billion.
While Ripple primarily caters to banks and large corporations, Stellar focuses on individuals and small businesses. Nonetheless, Stellar’s robust partner network, which includes financial institutions, supports worldwide instant currency conversion.
Initially, the Stellar Foundation issued over 100 billion lumens. However, about half of these were burned in November 2019, reducing the maximum supply to 50 billion lumens. This coin burn briefly boosted XLM's price, though the increase was short-lived.
Key Features of Stellar and How It Works
Stellar employs a federated Byzantine agreement aka FBA algorithm instead of traditional mining for transaction validation. This unique approach eliminates the need for approval from cryptocurrency miners, enabling faster transactions compared to many other blockchain systems.(only nerds read this part!)
What is Stellar Used For?
Stellar is primarily designed to streamline cross-border payments. Its mission is to make international transfers quick, affordable, and user-friendly. The system works by converting the sender's currency into Lumens, which is then converted into the recipient’s currency.
For instance, if someone sends GBP from the UK to Russia, the Stellar network first converts the GBP into Lumens and then into rubles. Users typically access the network through partners like Stripe or Wirex, which provide services integrated with bank cards. Transfers are processed in approximately five seconds.
Where to Buy XLM
XLM is available on both centralized and decentralized exchanges (CEXs & DEXs)
Stellar Price Info
- Current Price**: $0.43 (up by +54% in the last 24 hours) YES, BIG ALTS CAN PUMP HARD TOO
- All Time High (ATH): $0.94, achieved on January 4, 2018, currently down -54% from its ATH.
- Circulating Supply: 30.01 billion lumens.
- Maximum Supply: 50 billion lumens.
- 24Hour Trading Volume: $3.14 billion.
- Most Active Market: Upbit.
- Market Share: 0.37% of the total cryptocurrency market.
- Market Capitalization: $13.06 billion.
XRP and XLM: The Batman and Robin of Global Finance
The World Bank and other major financial authorities are increasingly acknowledging XLM & XRP's potential as a game-changing tool in the global financial ecosystem. Versan Aljarrah, founder of Black Swan Capitalist, recently emphasized this in a post on Twitter, discussing the significant roles XRP and XLM could play in shaping the new global financial system.
Aljarrah pointed out that XRP is specifically designed to enhance institutional liquidity for cross-border transactions, making it a vital asset in the evolving landscape of global finance. Meanwhile, XLM offers a robust infrastructure tailored for efficient peer-to-peer transactions, positioning it as a key player in facilitating everyday financial interactions
Technical analysis
Xlm bulls broke 0.15$ major resistance and now ready to break the second wall which is 0.45$, if btc pullback then Xlm correct then gets ready for second pump,next targets are 0.53, 0.57 and 0.59$. most indicators shows bullish signals and the volume looks good

XLMUSD - 15 JAN 2023 pump?
the photo is taken from the stellar tweeter, I did a little analysis and a little attentiveness.
This does not mean that it is after this time stamp that there will be a pump, but considering what tips are left and where we have the main POS dialing area. There will be a reversal with a high degree of probability, squeezes are not excluded. Set zone 0.69 and 0.6699

XLM is basing for around 900 days !!XLM Stellar looks very attracting to me !!
On the BTC pair Stellar has been basing for around 900 days and is now touching the significant 520 sat level where the price has been trading with a historically high volume.
On balance volume has never given back the big surge that it has made during the last bull market.
Stellar has been very quiet and working behind the scenes.
It has recently acquired Moneygram and will soon open up cash corridors in 12 significant countries.
I usually use Moneygram service to send cash to my relatives in Mexico - it is a cheap and fast solution.
Actually they are integrating the Stellar blockchain.
They have a 150 million plus customers.
As y said price is flirting with the high supply price of 520 sats. It could go lower of course but the entry point is great.
During the last bull run it had a first run up (May2017) and the moving avarages crossed back down (yellow circle).
However the second surge was for real.
This 2022 is THE year.

#XLM/USDT#XLM
The price moves in an inverted head and shoulders pattern
The right shoulder is now complete
Wall is expected for the upper border of the shoulder
We have a higher stability moving average of 100
We have bullish momentum on the RSI and an uptrend
We have a current breakout of the channel to the upside
Entry price is 0.2500
The first target is 0.3000
The second target is 0.3500
The third goal is 0.4000
