Xlmbtc
Here I go long on Stellar Lumens and XLM will go upHere I go long on Stellar Lumens
and Stellar Lumens will go up.
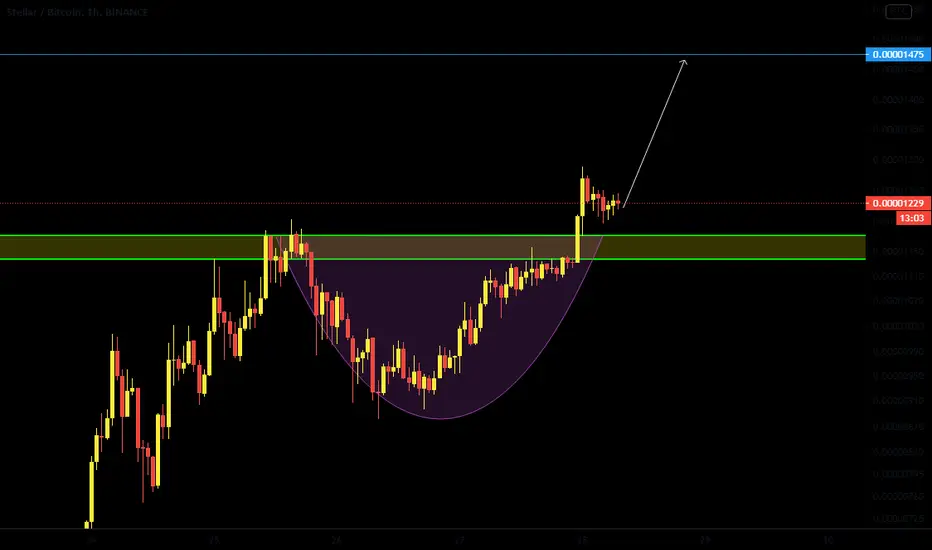
The price is testing the major resistance, so now I go 5x long and the bullish breakout will start. And Stellar Lumens will go up. See you up there

XLM buy a break Free setup.Stellar - Intraday - We look to Buy a break of 0.1812 (stop at 0.1727)
Price action looks to be forming a bottom.
50 2-hour EMA is at 0.1620
A break of 0.1800 is needed to confirm follow through bullish momentum.
Our outlook is bullish.
Our profit targets will be 0.2072 and 0.2194
Resistance: 0.1750 / 0.1900 / 0.2000
Support: 0.1580 / 0.1450 / 0.1400

$XLM, 50% in 48hs... 🚀🚀$XLM
50% in 48hs... 🚀🚀
Careful fomoing into this mega pumps..
This altseason can last days or weeks where dips to jump into a safer position will be available.
#XLM

The acquisition or gradual gathering of something Hello everyone !
I wish you all nice day my dear followers, friends, newcomers and randoom net troll visitors.
Lets focus closer on The accumulation of wealth today at this chart
Accumulation function, a mathematical function defined in terms of the ratio future value to present value
it is literally the process of gradually increasing in amount, or the increased amount
--------------------------
Accumulation
--------------------------
When price declined deep enough, at some point, you (as Smart Money) make the decision to buy.
You may have various reasons for that: you may see that stocks are heavily under-priced or you analysis shows that the market is ready
for a new uptrend and if you do not start it then someone else may do it.
It does not matter what your motivations are, you want to buy as much as possible at lowest possible price.
When you are Smart Money, you cannot jump into the market and buy all you need at once.
In order to accumulate the shares at lowest possible price your buying activity should be spread in time.
You have to plan your buying. You would have to follow a specific strategy:
1) When price drops below your critical level you start buying.
2) You continue to increase buying until you see you absorb all available supply and reversed a price trend.
By its nature panic selling is stronger than greedy buying. That is why you need to put more buying pressure to stop a down-trend.
That is why a volume surge at the end of a down-trend is much stronger than a volume surge at the end of an up-trend.
That is why Accumulation goes faster when compared to distribution.
3) When price trend is reversed and reaches your critical level below which you are buying, if you did not bought all you wanted, you stop buying - you remove demand.
If price does not start to slide down you may sell some of what you bought to generate bearish sentiment and make an illusion of bounce and not a reversal.
Since you were the main buyer, you will not need to put a lot of selling pressure to resume a down-trend.
4) As price starts to decline again, you start buying again until you absorb all supply and accumulate (buy) all you wanted to buy.
That is why we see double bottoms, reversed head and shoulders and etc.
5) You may repeat 1-4 steps again when you see that you may easily create a bearish sentiment (you do not have to sell a lot to resume down-trend).
You do it until you accumulate all you want.
6) When you dry out all Supply, there is no need in a strong Demand to push price higher.
Small increase in Demand can make a case. At first, stop-losses of bearish traders are triggered.
Then, as price advances, the rest of the market starts to jump in.
From that moment, you may sit and watch as other traders' bullish pressure pushes the price up.
The market not always follows a specific scenario and Accumulation phase does not always follows the same pattern.
Still, by analyzing volume and price action you may reveal the activity of the Smart Money.
----------------------------------------------------------------------------------------------------------------------------------------------------------------------------------------------------------------
--------------------------
Distribution
--------------------------
At some point, you as a Smart Money have to dump your investments.
It does not matter what your motives are - you made decision to relocate your investments into different place, you made extensive analysis
and you know there are a lot of external factors which would support a down-trend, you see market bubble which may burst any time, you see that the market is
heavily overpriced or you simply see that the market cannot push itself higher (demand is drying out). It doe not matter why you want it. You are "Smart Money" and you want to sell.
You have to distribute your holdings. However, you know that when you start dumping all your investments at once, the quantity of supply you will through into the market will crash the price.
You do not want it - you want to distribute your investments at the highest possible price.
You have to plan your actions to dump your investments in a smart way at the highest possible price without crashing the price down:
1) When price moves up to some specific level defined by you as satisfactory level, you may start selling.
You start selling in big quantities until you see that you are absorbing all Demand (buying pressure) and price up-trend starts to halt.
2) If there were a lot of unsatisfied demand (a lot of Bullish traders) you will be able to sell more - we will see increase in volume to the price up-move and then price advance will halt.
When there are not a lot of Bullish traders, you will stop price advance without causing an increase in volume.
3) When you see that price up-move halted you halt your selling - we will see a drop in volume.
4) If price starts to move down and you still have a lot of shares to dump, you stop selling as you do not want price do decline deep down - you want to sell at the top.
5) If price continues to decline without you that mean you created bearish sentiment. In this case, you do not mind to buy a little bit to change the sentiment and to push price up again.
6) When price starts to move up you start to sell again by dumping the rest of your investments.
7) You repeat the 1-6 steps above until you sell all your holdings you wanted to dump.
You managing bullish and bearish pressure you manipulate price to move in a side-way narrow range corridor.
8) When you about to distribute all your holdings, you do not halt your selling when price declines below your satisfactory level.
You continue to push price lower - you need to create bearish sentiment on the market, so, the market will continue decline down without your involvement.
9) Each time when you sell and push price down, you may run into new waves of Bullish traders who has their own reasons to start buying.
These bullish traders could be strong and they may reverse a price trend up strongly.
However, since you are the Smart Money and you have unlimited access to money - you are stronger and you are dedicated to push price down.
As these new Bulls push price up close to your critical threshold, you start selling (if you are out of your holdings you sell short).
You do it each time it occurs until you break the spirit of these waves of new Bullish traders.
That is why we may see an increase in volatility at the end of side-way trading right before a bearish trend.
That is why we see price bouncing from the resistance levels. By Richard Wyckoff words, you have to shake spring board until you shake off all the Bullish traders.
When you shake off all the Bulls, these Bulls will turn into the Bears - their stop-losses will start triggering and they will start selling.
10) From that moment, you may just sit and watch the decline - you Distributed all your investments at the Top and you started a bearish trend.
But remember !
This is how you would have to act if you would be the "Smart Money" dedicated to distribute all your investments and reverse a price trend down.
Of course, the Distribution phase, does not follow the exact scenario described above all the time.
In some cases we have prolonged in time side-way trading and in some cases we have Climax Run up and strong reversal down.
However, in all cases we can track the actions of Smart volume by analyzing volume activity together with price movements.
----------------------------------------------------------------------------------------------------------------------------------------------------------------------------------------------------------------
If you want to know what Smart Money are doing, you have to think as Smart Money.
You may see when Smart Money start their buying (Accumulation) - it starts while price still declines.
Also, you may see when they start their selling (Distribution) - aging, it starts while price still moves up.
By analyzing volume and price action you could obtain the knowledge about trend-reversal before it actually occurs.
This is unnatural to think that the first signs of weakness occur on price up move and the first signs of strength occur on price decline. However, this is one of the main concepts of Volume Spread Analysis. When you are can see the beginning of an Accumulation or the beginning of a Distribution, you can spot when "Smart Money" start their trading activity. From that point, if you define the sentiment of "Smart Money", you will know where to place your bet.
Accumulation/Distribution scheme chart applied on BINANCE:XLMBTC
link on chart HERE
The acquisition or gradual gathering of something part 2. here
Please leave a like if you want to support my work and do not hesitate to let me know down in the comments how do you like the graphics and the style of TA at all.
Do you want more of these ? Let me know and support me Every feedback and like is highly appriciated.
ChaChain
-------------
Disclaimer:
I´m not registered or licensed in any jurisdiction whatsoever to provide investing advice or anything of an advisory or consultancy nature, and therefore I´m unqualified to give investment recommendations. Always do your own research and consult with a licensed investment professional before investing. This communication is never to be used as the basis of making investment decisions, and it is for entertainment purposes only.

We dont buy at resistance levelsHello, traders.
XLM is testing an important resistance level after a strong uptrend movement, the RSI is pointing for an overbought level, so we must wait for a correction or some bullish accumulation pattern and enter the next breakout.
Best Regards

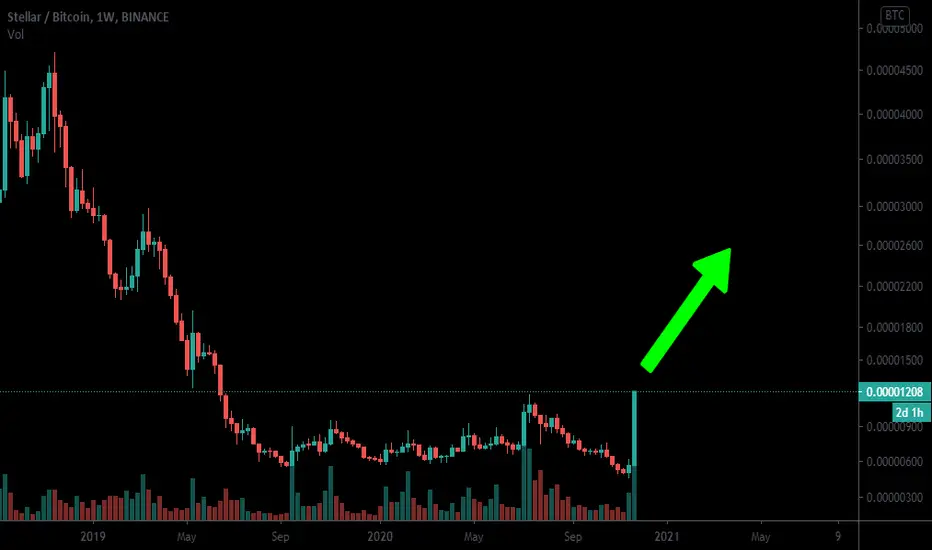
Stellar lumens XLM - The Real Rocket or just a torpedoThis chart im still trying to figure out.
either the price could brake the MA 100 on Weekly basis or not.
usually it need more volume to get momentum to break the MA 100.
but in crypto world, magic always come in.
fans look like want this lumens going up and stand next to its partner, Ripple XRP.
what i would to say is, alltocoin is just still early.
all will be up and down mid 2021.
just put your money into your beg. if not your beg, into my beg ;P
current
rank 11
$0.218186 USD (44.23%)
0.00001133 BTC (40.98%)
#XLMUSD Road To A Dollar!(XLM) is the native cryptocurrency for Stellar, an open source blockchain payment system. The purpose of Stellar is to connect financial institutions via the blockchain and provide cheap transactions in developing markets.
-XLM has Awoken with XRP.
-Buy and Hold Idea
-Looking For a Retracement Before Entry!
💠Keep Contemplating Crypto!
💠Check Out The Crypto Collective For More Signals & Set-Ups!💠
💠Like, Comment and Follow Us for More!

XLM / BTC double topXLM / BTC
🌟 TECHINCAL ANALYSIS🌟
hi guys
Xlm did great pumps last 2 days
We bought it in my channel and my subscribers make more than 70% profit 🔥🔥
Now looking at price action and chart specially in lower time frames
There is potential double top
And price most likely can drop from here even in Short term
Short is still has some risk because fomo can make it breaks that horizontal resistance
But take this in consideration and sell some if you bought in bottom with us
Good luck and happy trading 🌹

XLM - what a fake out !!Nasty Mr. Market wants to leave those without conviction behind !!!
W H A T A F A K E O U T ! ! !
Congratulation to all those who held strong !!
... personally I loaded up even more (+15%) when xlm recently broke down ... and I am happy I did !!!

XLM about to pop - Alt Season specialChart says it all. A lot of liquidity will transfer from BTC to Alts, its time.
Target : 0.14-0.145

XLM/BTC Stellar Lumen has steal the attentionAll way downtrend, last two day has sparked an attention of this Stellar Lumen Crypto to be part of the high gain. All the way from 3.317USD price per crypto history, could this banking challenger to connecting financial institution steal the market with its cheap transaction claim? and to achieve 1000 satoshi price in near quarter?
Shafiq Neurotrader

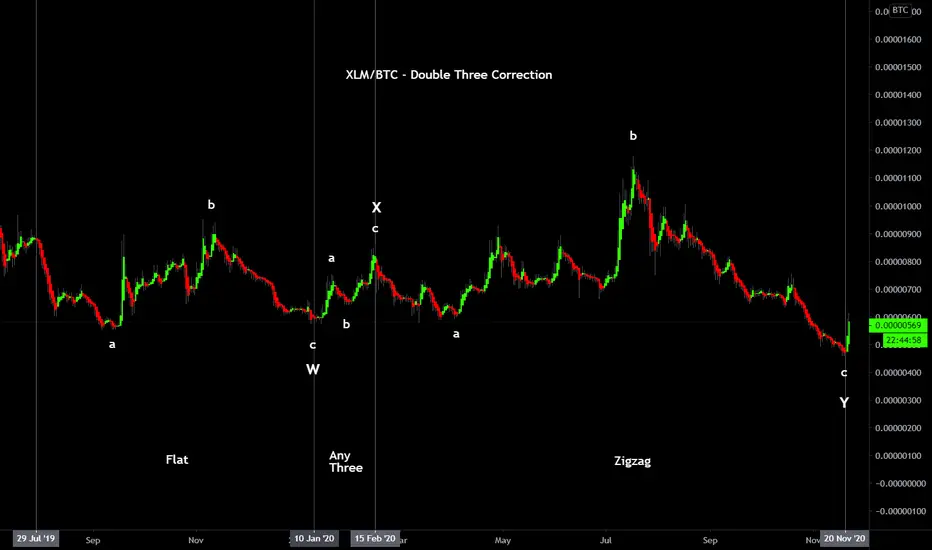
XLM/BTC Elliott Wave Analysis - Breakout?Hello all,
I've counted this with many different sequences and feel that a Double Three (WXY) combination is what has likely been printed here.
It's possible that it continues to correct further to three corrective structures and forms a Triple Three (WXYXZ).
I'm looking for a set of five impulsive and composed waves to rule this out and signal a change in the direction of the trend at one larger degree. Follow me for further updates.
Elliotticians your input will be kindly received, please leave a comment and feel free to share your opinion.
Thanks for looking,
Beyond Edge
Disclaimer
This is not trading advice. All content/ information shared in this idea is purely educational in nature and is expected to be used for analysis and illustration purposes only.
Do not trade or speculate based solely on the information provided.
Trust your own analysis.
Beyond Edge
XLM/BTC trying to break out of a bullish downward wedgeXLM/BTC trying to break out of a bullish downward wedge in a bitcoin bullish environment could see the stellar lumen XLM increase in value dramatically.

XLM looks strongly bullish to meHello everyone,
this is just quick update for XLM as it looks very strong to me.
On the 4h chart it broke the red cloud resistance and even MA200 and it seems that it also backtested it succesfully allready.
If it can hold the important zone (green block) then it can see a further moove upward
On the Weekly chart if Bitcoin can close at current range it looks even stronger.
as Weekly bullish engfulling candle can be seen on the chart below
Yo and don´t forget that Trading View black friday is coming up !
See the Grinch chart below for further info and save 60% on your plan
ChaChain
-------------
Disclaimer:
I´m not registered or licensed in any jurisdiction whatsoever to provide investing advice or anything of an advisory or consultancy nature, and therefore I´m unqualified to give investment recommendations. Always do your own research and consult with a licensed investment professional before investing. This communication is never to be used as the basis of making investment decisions, and it is for entertainment purposes only.
KEYWORDS
stellar, lumens, xlm, trading, bitcoin , bitcointrading, profitable trading, profittrading, profit trading, secret, divergence, bull divergence, bear divergence, divergencetrading, divergence trading, trading strategy, how to trade bitcoin , bitcoin trades, bitcoin trading, make profit, take profit, trading strategy, trading technique, successful, successful trader, successful technique, successful strategy, successful secret, how to trade, trend analysis, technical analysis , indicators, rsi , relative strenght index, let it rain, successful life, easy strategy, easy trading, easy technique, make money, crypto investing, investing, crypto, cryptocurrency, cryptocurrencies, mentoring, money, chartart, beyond technical analysis

XLM Stellar Lumens Channel Breakout - XLMBTC XLMUSD XLMUSDTXLM Stellar Lumens Channel Breakout - XLMBTC XLMUSD XLMUSDT

XLM breaking ATLPlease feel free to share your view on this pair down below in the comment section. I'm more than happy to be challenged and have an interaction on this idea.
Also make sure to leave a like as it helps me out a lot!
------------------------------------------------------------------------------------------
XLM broke ATL on 3th of Nov.
I'm looking for a continuation towards the 1.618 FIB level, followed by some consolidation and a move up towards the ATL. This could be a 60% move if we don't meet any strong resistances. Setting a stop loss at 320 sats.

XLM/USD Lumen-StellarXLMUSD is now inside the triangle. If the important level of 0.087 is broken and consolidated above, we will see a good upward movement to 0.10+.
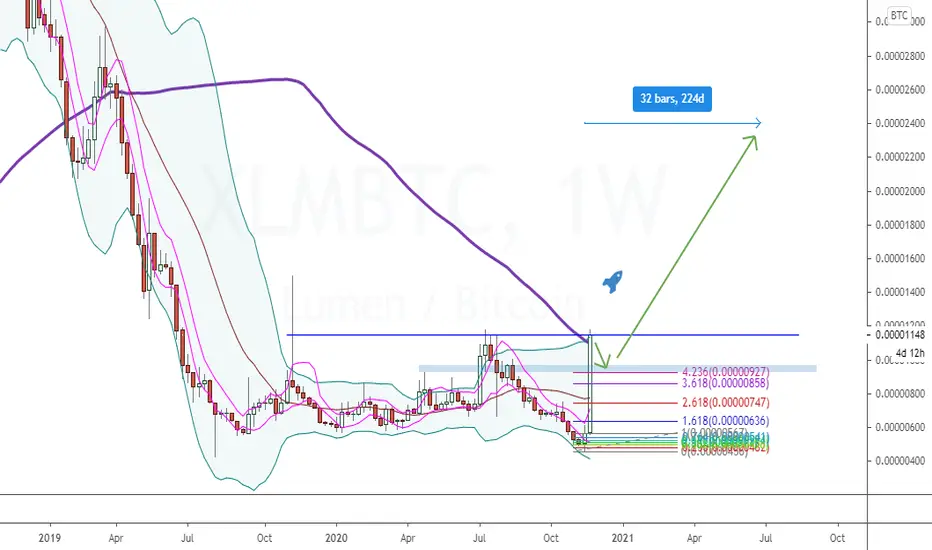
Why XLM can grow? If we look at the XLM / BTC chart, we can see how the historical low price was reached. A falling wedge has also formed at the bottom, which we broke yesterday with an upward movement. We are now above the support line. Volumes are growing, investments are in progress.
Best regards EXCAVO

XLM/BTCFalling wedge - one of the bottom options
All-time low
Volume - $144,702,998
XLMUSDT D1
good potential for growing
1H
Best regards EXCAVO

Stellar is slowly getting ready for a take off!XRP fork, Stellar has bottomed at $0.067 from where an uptrend has started, forming an uptrend line that is active to this day and I can see that confirmed by the trend of intradays higher lows and higher highs.
As the previous history suggest, the key resistance is located at $0.084 to $0.086 area with a daily pivot high of $0.088 which has to beaten in order to see a break to $0.10 per one XLM coin.
The price is starting to form an ascending triangle formation which has bias to break to the upside, a break of $0.086 will confirm this outlook. I expect this triangle break to reach 10 cents mark which would result in over 15% increase from the value that is going to confirm this outlook, $0.086.
Bear in mind that a daily candle has to break through that level.
Indicators
One thing I really like a lot are the Exponential moving averages which are currently support the price at level of $0.08 or 8 cent if you will, but I one thing I like even more is the fact that these 20 and 50 EMA’s are about to give XLM a uptrend signal that put XLM in at least 1 month uptrend rally as the fact that EMA’s are so close together at daily time frame is a sign of increased volume in the next days.
MACD buying wave has started just recently after a heavy correction, when the price didn’t manage to break the resistance area the first try.
RSI is trending higher with no negative technical aspects.
So overall XLM bulls are waiting for a break of $0.086 before a strong volume will be seen.

XLM Intraday Setup.Stellar - Intraday - We look to Buy a break of 0.0845 (stop at 0.0819)
Short term MACD is moving higher.
Daily signals are mildly bullish.
A break of 0.0840 is needed to confirm follow through bullish momentum.
Pivot resistance is at 0.0880
Our outlook is bullish.
Our profit targets will be 0.0948 and 0.0988
Resistance: 0.0840 / 0.0860 / 0.0900
Support: 0.0800 / 0.0780 / 0.0760

