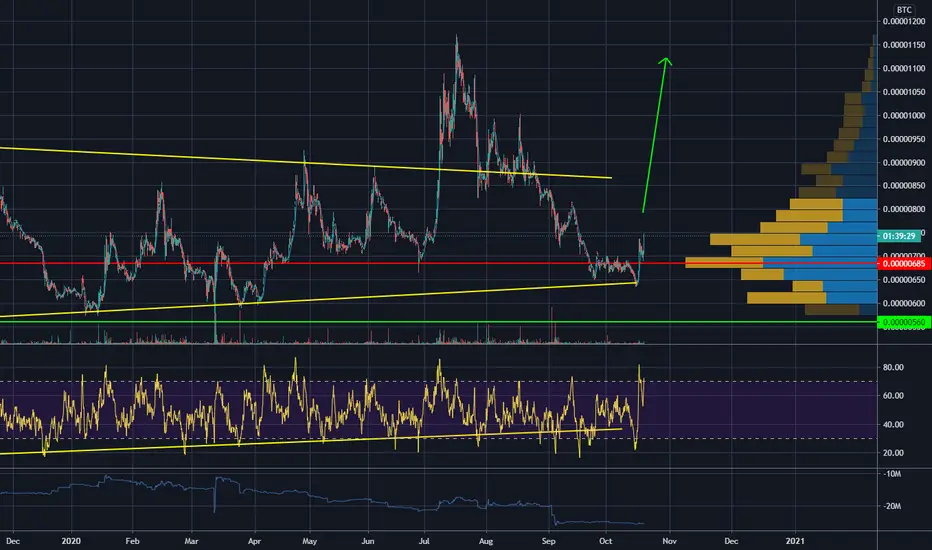
Stellar - $XLM / $STR - Rounding Bottom - Symmetrical PatternThe best time to buy is now!
#XLMBTC / #STRBTC: I'm LONG / BULLISH position up in (BLACK BOX) Fibonacci retracement (1.382% /1.618%) . I expect that $XLMUSD $STRUSDT will rise up.
This would mean that STELLAR LUMENS will gain more 500% - 1000% - 1500% of its current value against BTC before it can down.
What is the right way? Looking for relevant timeframes, with patience and planning, NO DESPERATION .
No one goes into the market thinking they should buy at the high and sell at the low. The problem is that at the moment when faced with the ups and downs of the market, it’s hard to resist the urge to do those things.
Trading is all about spotting emotional excesses either to the downside or the upside. You want to be on the right side of those emotional reactions and not the wrong.
If you want to win in this market, you need to be COLD and CALCULIST
To the moon is too close, go beyond
Well, keep you updated as this timely issue evolves.
Good luck!
#CRYPTO $XLM $STR #XLMBTC #STRBTC #ALTSEASON2020
$BTC $BCH $BNB $XLM $EOS $ETH $ADA $LTC $TRX $XRP $IOTA $LINK $XTZ $BTT $XMR $NEO $BTT $MATIC $XMR $MRK $XEM $ONT $DASH $BAT $ZRX $LSK $NANO $REP
#altcoins #bitcointrading #BuyTheFear #BuyTheDip
Xlmbtc

XLM BTC - At some point the downward wedge with break...And in a rising bitcoin price environment, that should be explosive for XLM.

Here I go short on Stellar Lumens and XLM will go downHere I go short on Stellar Lumens and Stellar Lumens will go down. The price is testing the major support, so now I go 5x short and the bearish breakout will start. And Stellar Lumens will go down. See you down there

XLM/BTC : All time low is nearBINANCE:XLMBTC
Hello everyone😃
Bullish side📈
- RSI is near oversold zone
- Stochastic RSI is being 0 again !
Bearish side📉
- Bearish MACD
- EMA 20 is resistance
- Very Bearish chart
This is the last support zone for XLM on BTC pair, IF any candle closes below 555 Satoshi then it will dump very hard !
Also there is view on weekly chart which confirms bears.. :
Attention : this is not a financial advise we just try to help people on their own vision.
HAVE A GOOD DAY
- Helical_Trades

XLMBTC AnalysisAt the moment, there are 3 sell signals present and I'm BEARISH.
So, I don't think this is a good time to buy.
If you want to buy again, we have 4 different options.
1- You can wait for EngineeringRobo's BUY signals to be present,
2- You can wait for candles to open-close above resistance level (0.0000071) for 1D to buy,
3- You can buy when candles touching the support line (0.0000055)
4- You can buy when candles open-close above up trend line.
After you buy, please watch out for EngineeringRobo's sell signals and consider selling it.

Xlm/btc ..wait for bullish signsXlm/btc
...........................
Stellar dropped to very important support
This level rebounced the price sep 2019
Can the support hold ? we need to Wait for bullish signs
And remember
Drop below that level will start parabolic sells and we can position ourselves in sell position on retest if that happens
Buying alts is very risky now because btc dominance is high and btc is in potential top
So the risk is still high ..
This not a buy signal
Wait for bullish signs if you want to buy and remember to follow risk management

XLMBTC (it's possible to bounce off from the support zone)
We can see several times steller touched support zone, now its in the support zone. I believe it's going to bounce from the support level.
Entry-level : 560 - 580
Resistance level 1: 630
Resistance level 2: 750
Resistance level 3: 920
Resistance level 1: 1150
stop-loss: below the support zone

XLMBTC is in the Support Zone!The price bounced off this zone several times.
Now there is a possibility to repeat history.
The clearest level is 05 Sep 2019 Low.
The potential profit will be 3...5 times bigger than the risk.
Push like if you think this is a useful idea!
Before to trade my ideas make your own analysis.
Write your comments and questions here!
Thanks for your support!


HOLLY MOLLYWhat a great Stellar opportunity ^^
global ALT sentiment: positive
total crypto sentiment: positive
halving, elections, ... soon Internet 4.0 ?
new BIG Bull cycle can begin anytime soon & it is good to be ready. I´m not saying this is the total bottom for XLM but the R:R is very nice for lot of altcoins
ChaChain
-------------
Disclaimer:
I´m not registered or licensed in any jurisdiction whatsoever to provide investing advice or anything of an advisory or consultancy nature, and therefore I´m unqualified to give investment recommendations. Always do your own research and consult with a licensed investment professional before investing. This communication is never to be used as the basis of making investment decisions, and it is for entertainment purposes only.
KEYWORDS
trading, bitcoin , bitcointrading, profitable trading, profittrading, profit trading, secret, divergence, bull divergence, bear divergence, divergencetrading, divergence trading, trading strategy, how to trade bitcoin , bitcoin trades, bitcoin trading, make profit, take profit, trading strategy, trading technique, successful, successful trader, successful technique, successful strategy, successful secret, how to trade, trend analysis, technical analysis , indicators, rsi , relative strenght index, let it rain, successful life, easy strategy, easy trading, easy technique, make money, crypto investing, investing, crypto, cryptocurrency, cryptocurrencies, mentoring, money, chartart, beyond technical analysis

XLM Bull Market - *****WARNING DO NOT MISS THIS *****MartyBoots here. I have been trading for 14 years and I am here to share my ideas with you to help the Crypto space.
Bitcoin Bull Market is here right now
XLM Is Very Bullish right now and will should move a lot higher
If you want help trading Bitcoin or any other ALT coins hit me up , We will improve your trading

XLM Long Setup.Stellar - Short term - We look to Buy a break of 0.0842 (stop at 0.0819)
We look for gains to be extended today.
Further upside is expected although we prefer to set longs at our bespoke support levels at 0.0840, resulting in improved risk/reward.
0.0840 has been pivotal.
Posted a Double Top formation at 0.8400.
The medium term bias is neutral.
Our profit targets will be 0.0901 and 0.0918
Resistance: 0.0842 / 0.0870 / 0.0900
Support: 0.0820 / 0.0800 / 0.0784

I like XLM at this point !!XLM looked like it broke out some months ago ....
It came back inside the multi month yellow channel and went as low as to touch the inferior line of the channel.
It tested it and shot right back up !
Since then XLM is performing very well.
.... and we are again approaching volume vacum.
I like XLM at this point !!
XLM/BTC Breaking Out, Rally Imminent? (+51% Potential Profits)Today we are looking at Stellar (XLM/BTC). As we can see, this coin peaked on its last bullish wave at around 1100 satoshi. Since then, there has been a strong correction, printing a large, bullish falling wedge pattern on the daily frame. Now, we can see prices breaking out and facing some resistance/retesting the old resistance as support.
Prices have broken up above the 10/21 EMAs, a bullish short-term move, and are now pushing the 50 EMA. If XLM is breaking out here, we can see prices push past the 50/100/200 EMAs, allowing for massive growth from this pair. We can also see some large buying volume on the two most recent green candles, another bullish signal. Furthermore, the MACD bounced rather than giving a bearish cross just a few days ago, and the RSI is also above 50, both bullish signals. Finally, this pair is trading near a long-term support level, very close to current prices. Thus, the risk-to-reward ratio on this pair is great. Keep your eyes on this pair and watch for a break above the 50/100/200 EMAs. If this pair is truly breaking out and catches a bounce here then this is a great long opportunity.
A potential short-to-mid term trade setup now could be:
Entry: 650-750
Support: 575
Take Profits:
1 - 799 (+14%)
2 - 908 (+29%)
3 - 1063 (+51%)
Leave a like and share your own thoughts and comments down below if you liked the post. Also, follow me for more ideas! Check out some of my others down below.
Price at writing: 697 satoshi.

XLM market updatePlease feel free to share your view on this pair down below in the comment section. I'm more than happy to be challenged and have an interaction on this idea.
Also make sure to leave a like as it helps me out a lot!
------------------------------------------------------------------------------------------

Stellar Market Buy.Stellar - Intraday -
We look to Buy at market
Offers ample risk/reward to buy at the market.
Previous resistance, now becomes support at 0.0762.
A break of 0.0780 is needed to confirm follow through bullish momentum.
Posted a bullish Flag formation.
A break of 0.0780 is needed to confirm the outlook.
Our outlook is bullish.
Our profit targets will be 0.0814 and 0.0838
Resistance: 0.0773 / 0.0780 / 0.0820
Support: 0.0760 / 0.0750 / 0.0745
Signal Centre

XLMBTC - Consolidation in historical support zoneIt takes a long time and the current range has been able to support the price well. MAs and oscillators have promising signs on 4H and 1D.

XLM/BTC (Retesting Key Level of Support)💎Technical Analysis Summary💎
BINANCE: XLMBTC
-Stellar is retesting key level of the support area
-It is showing signs of decreasing of selling pressure
-This is a good early sign for the Bulls
-But the true reversal is not yet confirm
-If you are a trend reversal trader
-You should wait for the breakout of local resistance
-Entering with momentum and the targets is up to 800s sat
A big Thanks for donating 💰 via Tradingview coins this week to ahancock 🙏🎉
``````````````````````````````````````````````
Trading Involves High Risk ⚠️
Not Financial Advice 💸
Please Exercise Risk Management 💱
``````````````````````````````````````````````
Thank You All!🙏😊💖For Supporting My Channel 📺
Through Leaving A Thumbs Up, Comment & Follow 💬
Happy Trading!😊💕💖
``````````````````````````````````````````````


XLMBTC D1: BEST level to BUY/HOLD 50% gains(SL/TP)(NEW) Why get subbed to me on Tradingview?
-TOP author on TradingView
-15+ years experience in markets
-Professional chart break downs
-Supply/Demand Zones
-TD9 counts / combo review
-Key S/R levels
-No junk on my charts
-Frequent updates
-Covering FX/crypto/US stocks
-24/7 uptime so constant updates
XLMBTC D1: BEST level to BUY/HOLD 50% gains(SL/TP)(NEW)
IMPORTANT NOTE: speculative setup. do your own
due dill. use STOP LOSS. don't overleverage.
🔸 Summary and potential trade setup
::: XLMBTC D1 chart review/outlook
::: getting near strong horizontal support
::: buying low near S/R makes sense
::: but still use a tight stop loss
::: BULLS should get ready to BUY LOW
::: BULLS will target re-test of mirror
::: S/R level at 850 sats. +50% gains off lows
::: nice technical setup overall, so get ready
::: BUY/HOLD swing trade setup
::: for patient traders only
::: so just be ready to buy later
::: and get paid
::: good luck traders!
::: and get paid. period.
🔸 Supply/Demand Zones
::: N/A
::: N/A
🔸 Other noteworthy technicals/fundies
::: TD9/Combo update: N/A
::: Sentiment mid-term: PULLBACK/BEARS
::: Sentiment outlook short-term: BULLS

