Xlmbtc

$XLM : Ready for a moon mission ?$XLM is holding Daily 100 MA, 200 MA, EMA 200
Long term range
On low timeframe drawing a falling wedge - Expect to break the upper resistance of the range before a moon mission
Not A Financial Advice


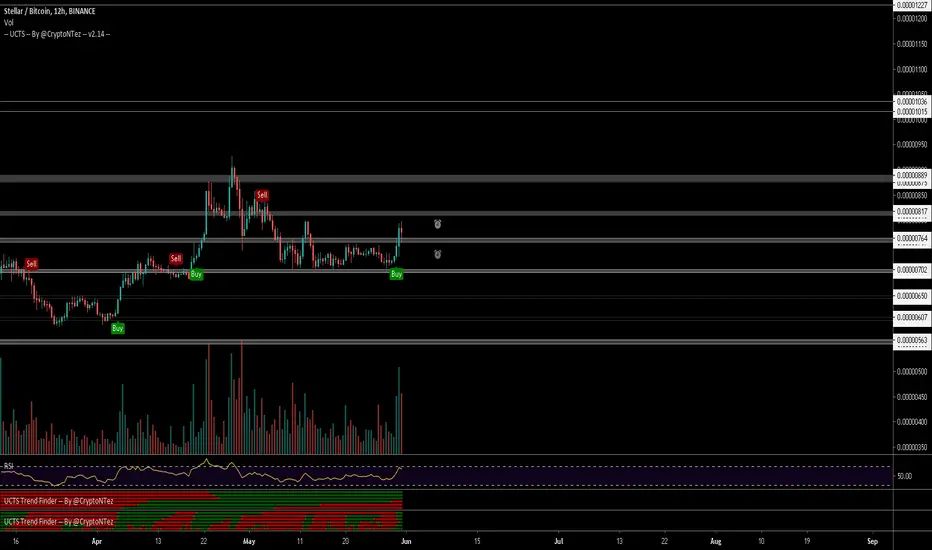
XLMBTC Range Median| Structural Resistance| S/R Flip Evening Traders,
Today’s Analysis – XLMBTC – must hold range median upon a retest to test structural resistance (range high)
Points to consider,
- Range median (local support)
- S/R flip retest must hold
- Structural resistance (Immediate target)
- Volume below average
XLMBTC’s range median is in confluence with local support, a trade location where an S/R flip must hold for a bullish continuation.
The structural resistance is a technical target as it is the range high of this consolidation area.
Volume is clearly declining and remaining below average, this is usually an indication of an influx being imminent.
Overall, in my opinion, XLMBTX needs to develop more to confirm its S/R flip. Establishing a new level as support will allow for a defined risk long trade into structural resistance (range high).
What are your thoughts?
Please leave a like and comment,
And remember,
“Remember our definition of a winning attitude: a positive expectation of your efforts with an acceptance that whatever results you get are a perfect reflection of your level of development and what you need to learn to do better.” ― Mark Douglas


XLM/BTC Idea Long #XLMBreakouts + volume = buy trigger
Resistance flip into support
x3 potential
#DYOR

$XLM/USDT 4 HR Analysis | BullishTA inside Easy Loot
Direct message me for any support/help...
DotcomJack

XLM/BTC MULTI-TIMEFRAME ANALYSIS Hello Traders, here is the full analysis for this pair, let me know in the comment section below if you have any questions, the entry will be taken only if all rules of the strategies will be satisfied. I suggest you keep this pair on your watchlist and see if the rules of your strategy are satisfied.

XLM ready for take-offPlease feel free to comment and challenge me on my TA. Hit a like to show support.
------------------------------------------------
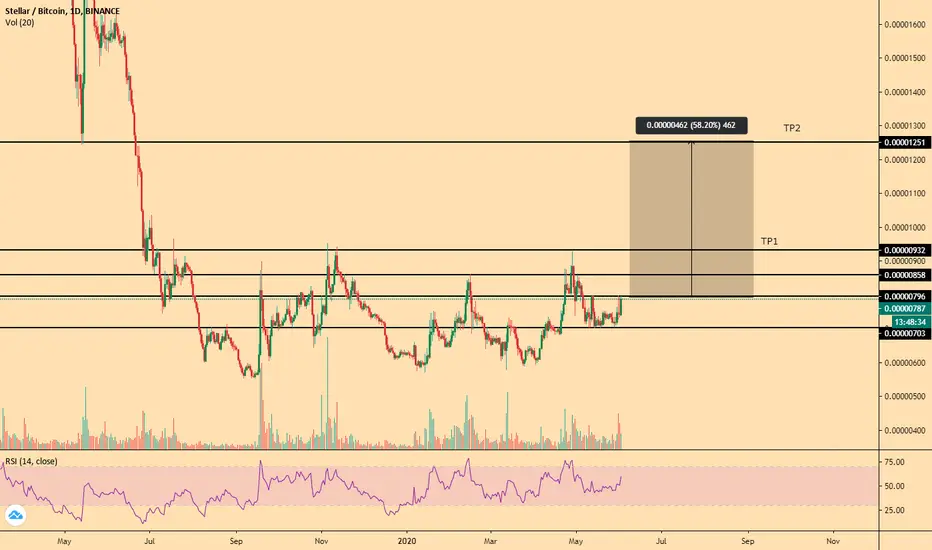
- Ranging since 07/2019
- Significant increase in volume
- Range high (886) is very close to being broken
- Chart looks exactly the same as the Cardano chart before it skyrocketed
- Next resistance at daily level (1274)
Waiting for confirmation above range high before I enter.

XLM will move soonIt's time for xlm to move up. You can look for a good entry or buy it when it passed first line. Potential movement is up to 3000 sat.

XLM to the moon ? Another 300% + mega cycle loading read whyHI guys & girls
Today we are looking into XLM (stellar) chart.
What XLM did twice was pretty amazing. That chart shows us the gains vs the Bitcoin!
The chart shows us the accumulation zone and what happens when XLM explodes from it.
What is the news behind the current situation?
Bitstamp (the odlest, most respectful crypto exchange) will list XLM on 15.June
The Bitstamp exchange hasn't listed new coin in about 3 years, so when ever they do it, it makes notable impact on the price.
They are very conservative and chosing to work only with long lasting, stable projects. There is no crypto exchange with more stable business model as Bitstamp.
Buckle up guys, XLM could bring us 300% in following months.


XLMBTC LONGXLMBTC LONG
Targets on Chart
Stop Lose :- 0.00000725
Target:- 0.00000829
Entry:- 0.00000766
MACD Crossed on daily
RSI going up
Volume increasing
Looks bullish, already formed two candles, expecting one more daily candle.
Comments welcome.
if you like the idea please subscribe otherwise please share your chart.
Thank you.

$XLM, ~760sats level hodling pretty good... $XLM
~760sats level hodling pretty good... a R/S flip here & a break above 790sats (previous HH) can allow some bullish activity toward ~900 sats (15%)
Aim for an entry at support level 👍
#XLM
XLM/BTC Bullish Signal
XLM is showing similar signs of price action to that of ADA (Cardano) before breaking out.
My advice would be to buy here and take profits in the levels mentioned in the chart
Be sure to drop a like to support me, so that i get motivated to make more charts :)
Straight Up | Stellar (XLM) Signals Up!We looked at Stellar (XLMBTC) and the signals continue to be 100% bullish.
As of now, everything is pointing up.
The MACD is curving up strong.
The RSI is also strong and going higher.
Today we have a very strong green/bullish candle.
Trading volume starting to increase.
Prices remain trading above EMA10 and MA200.
All these are bullish signals.
This is not financial advice.
Namaste.

XLM/BTCXLM is in accumulation zone and has recently pierced through the old resistance. Can expect a breakthrough or throwback.

XLM/BTC 12H (Binance) Falling wedge breaking out Stellar Lumens looks bullish again, in the past those wedges broke-out well so I'm expecting history to repeat itself.
(E)MAs are acting as support now so that would help going up, I'm entering right now but will add more if pulls back in the yellow zone.
Current Price= 0.00000741
Buy Entry= 0.00000727 - 0.00000705
Take Profit= 0.00000787 | 0.00000840 | 0.010108
Stop Loss= 0.00000645
Risk/Reward= 1:1 | 1:1.7 | 1:2.97
Expected Profit= 9.92% | 17.32% | 29.47%
Possible Loss= -9.92%
Fib. Retracement= 0.382 | 0.618 | 1
Margin Leverage= 1x | 3x | 5x
Estimated Gain-time= 720h


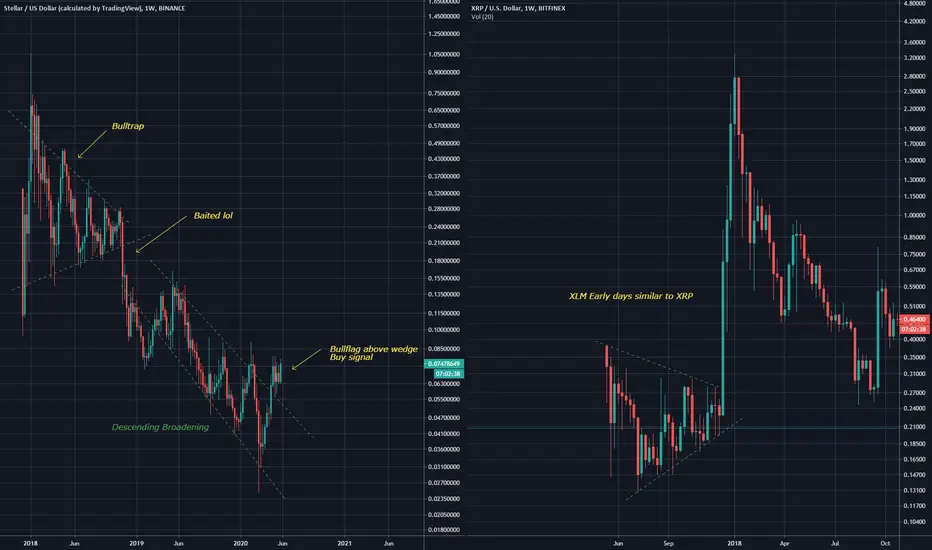
XLM vs XRP trianglescan be seen in the early days of XLM that a symmetrical triangle formed, likewise with XRP, however XRP produced large gains while XLM slumped
Will this triangle action influence future moonshots for the pair?
XLM has formed a bullflag above the wedge
Looks bullish
I am long XRP :D
Stellar (XLM) Confirms MA200 As Support, Bullish...Stellar (XLMBTC) is trading within a broadening channel and just recently confirmed MA200 (black line) as support.
This can lead to additional growth.
The trading volume, green, and chart structure are also bullish.
The MACD is curving while moving back above zero.
The RSI is strong hitting 59 while trending higher.
All these signals are pointing to additional growth.
If the same pattern repeats, we are looking at a higher high on the next jump.
Namaste.
----------
May 20 | Stellar Hits Potential Reversal Zone
Apr 20 | Stellar (XLM) Goes Bullish, First Target Hit (Trade Inside)

