Xlmbtc

XLMBTC BullishI want to show you interesting bottom trend line. Chart of XLM respected this trend line 3 times and now it is ready for move up to our target. Targets, Stop loss in chart :)

XLMBTC LONGLarge moves coming for alts. Dont sell the initial pumps. Wait for the home runs.
God Speed,
Mr. Manbearpig

Good time to buy XLMXLM has broken up from its downward wedge and looks to aggressively regain ground as Bitcoin's price comes under pressure.
XLM has partnerships with IBM, Deloitte and other national banks in emerging countries.
XLM is a much quicker payment system, much cheaper and much more decentralised than Bitcoin. Furthermore it is open source and therefore is likely to get more and more efficient over time as a result.

Stellar Lumen XLMBTC NICE ProfitWithin the coins we had put XLMBTC was to be sent to you from our premium group.
But it will make you sad to know that we have already achieved between 8% of profits and that we will not be able to send the corresponding analysis.
Sorry dear Stellar Lumen fans, it will be a next opportunity.

$XLM, Following very close what #XRP is doing...$XLM
Following very close what #XRP is doing (as always happens)
Trying to flip current level at ~765 sats into support w/ UCTS indicator buy signal on the 12H
If continuation is shown from here (volume needed), then we can aim for a new leg up with target at ~900sats(15%)
#XLM

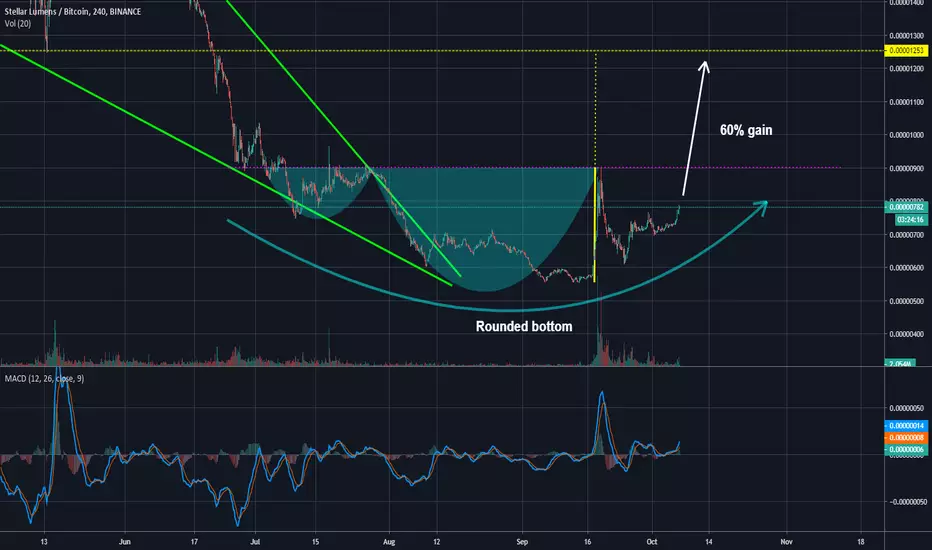
XLM - Inverse Head and Shoulders Setup, Ready for Takeoff (~60%)XLM has a great setup here. You can see the rounded bottom it has formed since last month. It has reset the RSI from the previous pump and is forming a right shoulder of an inverse head and shoulders pattern. I think we may see big volume like we did last time and hit our target pretty quickly if this takes off. I'm entering here and buckling up!
Did my idea help you make a successful trade?
Donations are always welcome and much appreciated!
BTC : 136dZZ2XyUirYUX1nUXwrU6sGgaBNPiFnU
ETH : 0x2fda8b3ebf9f03078d2e4657ebca5c41ed020bf6
XRP : rPVMhWBsfF9iMXYj3aAzJVkPDTFNSyWdKy Tag: 395032582

XLM .0755 target Bullish divergence on RSI (4hr) led to relatively high volume and 50% price increase, ending in a crisp ascending triangle that is tracking nicely.
Just an idea!

XLMBTC Low Volume Breakout Imminent Hello Traders!
Today’s chart update will be on the XLM/BTC pairing which is in an interesting position, testing current local support with volume well below average, a break out move may be probable…
Points to consider,
- Trend bullish, probable of new higher low
- Price testing structural support
- .50 Fibonacci acting as resistance
- RSI neutral
- Stochastics showing upwards momentum
- VPVR showing decreasing transactions
- Volume decreasing rapidly
- EMA’s giving price resistance
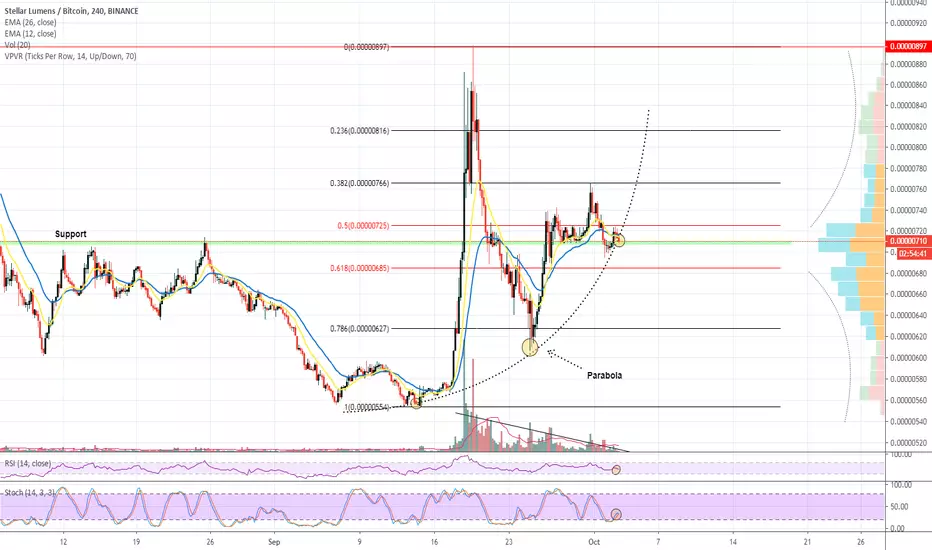
XLM has had an insane bull move that corrected all the way down to the .786 Fibonacci level before retracing and trading in the now current rage. The trend is overall bullish as we do have consecutive higher lows in place; however this is in a parabolic manner.
Price is testing structural support, previous resistance; a break of this area will be quite bearish as market structure will then not be putting in a new higher high. Local resistance is at .50 Fibonacci level that needs to break upon respect of current support. If this level is broken then a test of the local highs will be more probable.
The RSI is quite neutral at current given time, it can break in any direction, really depends on the next move of XLM. The stochastics currently is projected upwards, we still have room for further upside potential.
The VPVR is interesting, showing us that the volume of transactions is decreasing on both ends, bullish and or bearish; the next move has a high degree of probability of being a flush move. Furthermore the volume itself is declining rapidly, telling us that a breakout is imminent in the near future.
The EMA’s are currently giving price resistance, is price fails to break the EMA’s then XLM will not put in a new higher high, the bullish market structure will no longer be in place…
What are your thoughts on XLM, is a breakout move imminent due to declining volume?
Please leave a like and comment
And remember,
“Hope is bogus emotion that only costs you money.” – Jim Cramer

Keep an eye on XLM if XRP rallies.XLM/BTC, much like XRP/BTC, is currently trading above its 10 week moving average for the first time in months. With XRP/BTC looking pretty bullish on a weekly basis, XLM is likely to follow any rally higher by XRP as these 2 coins tend to move together. Also, for any crypto traders out there, Binance just launched their US exchange (Binance US.) If you need a link to go sign up, click here--> www.binance.us
MA Guide (All Weekly for this post):
10 MA in Orange.
20 MA in Pink.
-This is not financial advice. Always do your own research and own due-diligence before investing and trading, as for investing and trading comes with high amounts of risk. I am not liable for any incurred losses or financial distress.

Stellar Lumens (XLM)After a double bottom, buyers are showing massive interest with a 40% impulse move on 10x the average volume. The second up leg has already started and is showing support at the previous range high.
Waiting for price to reclaim the grey line and show a good set up.


Long XLMBTCNice tight stop. Looks really good. alt season is here. We just dont know how long it will be.
God Speed,
Mr. Manbearpig

Stellar Lumens Price Analysis: Bullish Opportunity on the HorizoConclusion for today's Stellar Lumens price analysis:A break above the long term trendline can be used as part of a conservative strategy to go long (i.e. buy) Stellar Lumens.
A log scale of Stellar Lumens price is presented on the 6 hour timeframe with coverage of market action since May 2019.
The long term bearish trendline is plotted on the chart with peak of the price spike on September 18, 2019 used as the second pivot in drawing the trendline. The 200 and 50 moving averages are also drawn to track price for possible trend change(s).
Signs of hesitation for the downtrend as shown on the chart include the formation of a double bottom (ideally bullish) chart pattern between September 6 and September 14, 2019. Confirmation of the pattern occurred on September 17, 2019 when price broke and closed above ~0.00000597.
A retracement to the aforementioned price level i.e. ~0.00000597 can be observed after the price spike, suggesting that Stellar lumens’ price could potentially find support at the price level. A second test would provide additional evidence of bullish momentum picking up and hence change in the trend from bearish to bullish.
The September 24, 2019 bullish crossover (50 moving average above the 200) also does favor a bullish scenario for Stellar Lumens as opposed to the continuation of the long term bearish trend.Confirmation of support at ~0.00000597 (second successful test) provides a great risk/reward ratio for long (buy) positions.
More conservative strategies for initiating long positions however involve waiting for price to close above the long term bearish trendline.Price closing below ~0.00000563 presents a great challenge for the continuation of price action to the upside, therefore invalidating the bullish analysis for Stellar Lumens.

XLMUSDT Breakout idea , bullish RSI Very nice setup if you have usdt just because of bears we have to move money
Buy : 5870 - 5900
Stop : 5%
Target : 5 to 30%

LONG XLM bullish failing wedge breakout ?Price Action(PA) XLM closed above 700 sats resistance level . Closed above EMA 21,50,100,200 Uptrend.
Indicators: RSI above 50 points, MACD bullish crossover above zero line ( bullish sign)
Pattern: Failing wedge bullish breakout.
Bullish Volume respond. Confirm trend.
S/R : Strong support at 600 sats , Resistance at 850 sats .
Disclaimer: THIS IS NOT FINANCIAL ADVICE. All the information shared here is for learning and entertainment purposes only.

XLM critical levelAfter consolidation, XLM will decide very soon whether to go down or up. 0.6260 level is critical.


Stellar XLM - End of the Year Breakout?There has been lots of new developments with Stellar. Lots of exciting releases coming from the team behind Stellar. These all add up to prospects of handsome returns:
MACD has plenty of room to move up.
The RSI is high, so this is one to watch. It may come down a bit before heading back up. This should translate to $0.075, before heading back up IF the RSI is to be followed.
The entire crypto market is starting to shape up into a 2017 style bull run. We see the same trends and moves that we did in 2017. Fundamentals:
RSI and MACD are in a long term bullish movement with plenty of room for a breakout.
Comment: Disclaimer: Cryptocurrency market is notoriously unstable and are easily influenced by external events. This is no guarantee of a breakout. This analysis is based on past events and indicators.

End of Consolidation XLMMost probably it is the end of consolidation and it will go up quickly from this level.
