XRP vs XLM macro breakout?Who is gonna be stronger?💪 This is comparison XRPUSDT / XLMUSDT , so if the:
*price is going up, it means XRP is stronger than XLM
*price is going down, it means XRP is weaker than XLM
My last analysis (11/08/2022) of this pair anticipated the Head and Shoulders but the pattern has not been actually triggered as the neckline has not been broken and the formation was invalidated later.
Last months Ripple is much stronger than Stellar and the chart actually drawn huge inverted Head and Shoulders with Neckline being at the previous chart high @ 4.67. Now XRP is trying to get above the Neckline and stay there to confirm the breakout. IF that really happens, we could see run up to 8.62 meaning that 1 XRP would be worth 8.62 XLM, while now it's just 4.67 XLM. In other words Ripple would gain 85% against Stellar no matter what the USD value does. All the uptrendlines could act as magnets attracting and repeling the price. Invalidated below right shoulder @ 2.67.
To sum it up, I think that in the following months, Ripple could be stronger than Stellar with some pullbacks along the way. What's your take?
Check my other stuff in related ideas.
Please boost🚀, comment🗣️, follow me✒️, enjoy📺!
⚠️Disclaimer: I'm not financial advisor. This is not a financial advice. Do your own due dilingence.
Xlmbtc

XLM - Probability of retesting the support levelXLM has been in a gentle downward trend over the past week, and the price has entered a range that has raised the possibility of a complete breakdown of the monthly time frame support. The downtrend line that was considered on the chart has not yet been broken and the price is far away from the downtrend line. A resistance is considered in the range of $0.0777, which is the ceiling range of the last bearish wave in the 4-hour timeframe. On the other hand, a double bottom pattern is formed in the range of $0.0710, which the break of the $0.0725 resistance can confirm this pattern.
Of course, if a bullish candle is formed above this area. In this case, we can expect for the next week that the buyers will make an attempt to return the price to the specified dynamic resistances. After a possible reaction to this resistance, there is a possibility of a retest of the support level and the formation of a double bottom pattern, which is confirmed by the failure of the resistance pattern. In this case, we can consider higher targets in the ranges of 0.082 and 0.090 dollars.

XLM/BTC Position Trading. Zones. Money management. PsychologyLogarithm. Time interval—1 month. The main trend since the beginning of trading.
Coin in coinmarketcap: Stellar.
Top trading pairs to bitcoin have significant liquidity. In position trading, you need to work in portions from support/resistance level zones with a predetermined size distribution.
Unlike pairs to the dollar, pumps/dumps are smaller in % ratio due to the % rise/fall of bitcoin itself. If bitcoin is cashed in the market, profits remain the same. Hence, the smaller % is illusory in nature.
BTC instead of stabelcoins .
In such pairs, the “money” is bitcoin. Consequently, even premature selling (there shouldn't be any, since the position is allocated in advance) forgives mistakes, since you get bitcoins instead of USD or stabelcoins. Currently, many stabelcoins are losing their $1 peg, meaning they are devalued. Trading in a bitcoin pair reduces that risk.
Work on such pairs is suitable foremost for medium and large participants of the market. It is not rational to work with a small amount in such a time/profit perspective.
Money (crypto assets) security Money management.
This is key. You don't need to hold a large position on the exchange for this kind of trading! Why keep coins or stabelcoins on exchange if you make transactions quite rarely, only large movements. You understand beforehand when it will happen and in what price zone you are going to buy/sell.
That's what all the big market participants who don't take part in price formation do. When you need to buy or sell, you transfer the assets to the exchange and sell or buy on the market. You withdraw right away. If the amount is large enough, you should do this procedure in installments, preferably on several exchanges.
At one time I worked for a long time (several years) on DOGE/BTC pair, when this coin was (scam, joke coin) nobody was interested in it, unlike the current time of hype. There is a trading idea of the principle of this work in Russian 2019.
In this work, you work only in the secondary trend, from the main support/resistance zones, considering the development of the trend. You absolutely do not need to be interested in crypto news, the opinion of the majority and so on. You can look at the chart even once every few months.
What's more, you also don't need to know the future highs and lows of the next cycle (though for traders, they are easily identifiable). You work piecemeal from the zones. You know in advance where and by how much you buy or sell. Locally you can trade 20-30% of your coins, so you will have extra profit. But you don't have to.
The price goes down — good for you.
The price goes up — good for you.
Trading is guessing market probabilities of price movements. Algorithmic thinking according to a trading strategy, devoid of any emotion, makes money. Anything else loses it in any market. In other words, you must initially be prepared for more likely (in your opinion) and less likely outcomes. Know under what conditions you buy and under what conditions you sell.
Buying/selling in portions of coins according to predetermined zones.
You work from the average recruitment price and from the average selling price in portions, similar to how large market participants work on the BTC/USD pair. You never go completely into cache or similarly into coins. Only the % ratio of coins to money changes depending on the market cycle.
Work from the average buy/sell price (of money and coins) on a global scale (large time frame), without any "what if this time will be different". If it does, it's none of your business.
Know in advance where you will buy more in case of drawdown, and where you will sell in case of pumping. Again, without the "It could be different this time" and emotional component.
Sell and buy assets a little bit before everyone else in the market in installments, "not knowing the exact future," even if you think you know it. This will keep you from making mistakes.
Coin trading in the local trend.
By trading part of a position locally, you will always have money from profits to buy (averaging the main position) in case of so-called local "black swans". This work is not mandatory, but desirable.
It helps some people a lot psychologically, especially if the initial entry into the asset was erroneous and the price dropped significantly. By increasing the number of coins of local work, you thereby reduce your previous losses or even come out in profit over time. Again, you don't have to work this way, but it is advisable.
The smaller goals you set, the more you end up earning on the distance .
An untouchable supply of coins and cache in case of market force of circumstances .
Always keep in mind the possibility of a “black swan,” even if it seems impossible. You always have 20-30% of your position depending on the cycle (money/coins) in case of force of circumstances.
Bearish—a “black swan” sell-off under the channel support zone (happens very rarely).
Bullish—the final hammer madness over the channel resistance (happens very rarely just in pairs with bitcoin because in a bull cycle bitcoin grows 5-8 times on average).
Remember that in the accumulation phase in most cases there is a residual price zone of capitulation, super fear. It is usually accompanied by a “black swan. When everyone gets rid of their assets out of fear. You, on the contrary, buy with a grid of orders with a large range, without emotion.
Consequently, always have a pre-allocated cache (or from the profits of a local trade) if such a trading situation is realized in the market. Turn someone else's negative emotions into your own profits.
You should always act according to your trading plan and be ready for any market situation, even an extremely unlikely one.
bull market highs zone (channel resistance).
At the peak of the market, you should already have more than 60-70% in bitcoin (cache) for the next market cycle. 10-20% of the rest of the position should be in a stop loss to protect profits. This is more rational if the last spurt occurs.
Coins sold for bitcoin can be held in bitcoin in a cold wallet (not rational if the overall market trend has reversed). You can also similarly sell on the market for cash (be sure to withdraw from the exchange), or put a stop-loss to protect profits, in case the market makes another spurt (additional profit on the BTC/USD pair).
Always sell when the price rises significantly (pumping). Protect your profits with a stop.
Always sell a substantial portion of your coins with a grid of pending orders during an active pumping phase. Another option is not to sell, but to protect your profits with a stop loss.
Bear market minima. (lower channel zone).
In a bear market, the lower the price falls, the more market participants wait even lower. Everything is similar to the distribution, only mirrored in the opposite direction. This illogical inadequacy of people is especially noticeable at the "peak of fear." Before that super minimum (there may not be one), you need to gain most of the coin position in advance, but be prepared for anything...
Again, you must know in advance where and for what % of the allocated amount you buy coins and under what conditions. There must be discipline in everything and determine in advance what your further actions will be in accordance with your trading algorithm, rather than an emotional component.
Always have a certain percentage of money that is comfortable for you in any dominant trend and phase of the market.
Bull Market .
In a bull phase, you should accumulate a large percentage of cache (stabelcoins) at the expense of profits.
Bear market .
In the bear phase (altcoins from -90% and below) you should accumulate in portions of cryptocurrencies you are interested in.
I'm sure most people have it the other way around. In a bullish phase, most collect promising cryptocurrencies bought near price highs (hype, everything goes up in value).
In the bear phase, on the contrary, most market participants load most of their trading depots into staplecoins (fear, everything is falling in price, expectation of inadequate floor prices). They are driven by the desire to buy back the lowest price of the trend, right before the reversal. The lower the market falls, the more most go from fear to stablcoins.
Trade market cycles, not individual cryptocurrencies. Because their price strictly follows market cycles, but not the other way around.
Options for the development of price movement on the pair XLM/BTC. .
I will show the percentages of the following 3 zones of this channel, depending on where and under what conditions the reversal of this secondary trend will occur (a downward wedge is formed).
1 variant of reversal. Candlestick chart. Butterfly formation, the wedge is not embodied.
1 reversal variant. Line chart.
2 reversal variant. Candlestick chart.
Version 2 of reversal. Line chart.
3 reversal variant. Candlestick chart. Full formation of the descending wedge on the classic TA.
3 reversal variant. Line chart.
Be aware of trends and accumulation/distribution zones .
Remember that a bear market, like a bull market, will not last forever. Where there is supposedly an end, there is always a new beginning.
Everything is subject to cycles. This is especially true of financial markets. Every cycle is the same to the point of triviality. Be guided by trends, that is, by accumulation/distribution zones, when they start and end.
Bitcoin — as more than a decade of cycle history shows, this is from -70-82% of the secondary trend high. This does not mean that the subsequent cycle will have the same percentage trend value, but there is a possibility.
Alts average -90-96% and lower depending on the liquidity of the crypto coin. The lower the liquidity (people involvement), the higher the risk. You should also understand that the lower the liquidity, the higher the slippage at “peak fear” can be. Many altcoins, especially those with low liquidity, do not survive to the next cycle.
Also be aware of market capitulation shocks as a consequence of so-called “black swans.” It won't necessarily happen, but the possibility always exists.
The price of something that is worthless can be turned into absolutely anything on the market, to the point of inadequacy. It's not a real commodity whose value people understand.
Psychology. Indicators of distribution/accumulation zones in cycles.
Allocation zones —resetting to “hamsters” (fools or inexperienced market participants) is expensive.
In a bull market, the higher the price rises, the higher the expectations. Up to inadequacy in the last reset zone in the distribution. “Hamsters” buy very expensive “promising coins” near trending price highs (marketing, information noise) and wait even higher.
Accumulation Zones — Large market participants buy on the cheap from “hamsters”, constantly scaring them with various bikes and imitations. There is a massive build-up of negative news.
Hamsters sell cheap and wait for an even lower price. No matter how low the price is, it cannot satisfy people like them.
In other words, their thinking is sharpened to the opposite. Projecting onto trade what they are in life. Anything to do with money reinforces this effect. Buy expensive, sell cheap. Don't inherit this tendency of those who lose money in the market.
As a rule, most people don't buy at flea markets; they are afraid. They wait for those who should be selling to them to say, "Fools, it's time to buy in the very expensive.")
What matters is how much you earn when you're right, and how much you lose when you're wrong. You should know these potential values initially before you make a deal. If you can't determine them, or the risk is too high — refrain from trading.
Immunity to guessing lows and highs .
Most fools do this in all cycles. Forget the hamster concept of selling at the peak or buying at the low. Leave it to those who are destitute and will be even poorer because of it.
Again, it's all in the head. What a person is like in reality is what a person is like in trading. Kill your greed.
For example, in all bitcoin cycles (I have my third), the so-called hamsters (fuel) and pseudo traders (fuel) always want to guess the highs and lows of the price. The question is, why do we need to do this? The answer lies in the thinking of the poor and lack of understanding of simple logical things.
The ability to wait for your goals.
Be patient. Cycles, both local and global, tend to recur with their own time interval, which cannot be identical to the previous one. Consequently, only the patient earns.
Learn to be out of the market,
In areas of uncertainty, if the market doesn't let you make money, why burn time in vain? This time can be used with benefit both for yourself and for others. Take a rest, read an interesting book, go somewhere, do something useful. The main thing is not to immerse yourself on the Internet.
It is important how much you earn when you are right and how much you lose when you are wrong. Initially, before entering a trade, you should know these potential values. If you can't determine them, or the risk is too high, then refrain from trading.
Treat the numbers on the screen as numbers, not as money.
No equation with the value of "what you can buy with that amount of money on the screen." That is, you have to identify with the percentage of profit/loss, not the money — the amount of profit/loss.
When -5% to $100 is $5, and you are not afraid of such a loss.
But, for example, when your balance is over $10 million, then -5% would be $0.5 million. For a fat hamster, that's a tragedy. For a big trader, it is a calculated risk. The drawdown can be much more significant, but the risk is always considered and accepted in advance. In the end, the profit more than compensates for such a drawdown. I think you understand the logic. It allows you to understand whether you are ready to work with large sums or not.
I purposely wrote a large amount as an example to provide a clear contrast because everyone is ready to lose temporarily, namely temporarily $5?
But $500,000 is an unimaginable amount for most people. But to be ready to work with big sums, you need that discipline and attitude towards money at the very beginning of your hobby of trading. Everyone wants to work with large sums in the future when they trade, or am I wrong?
As a rule, most market participants cannot overcome this barrier because of their "lust for money" and identification: the numbers on the screen are real money, not just profit/loss % figures.
A trader's behavior in the market is a result of his thinking. Your way of thinking affects your habits, and your habits are what makes or loses money in the market.
Margin is bad .
The exception (not necessarily) is an adequate short position with minimum leverage and risk limitation.
If you want to steadily earn in the market and never get nervous - don't use margin at all. Absolutely never. As a rule, the poor use margin, and the poorer they are, the higher the leverage. Perhaps that is the secret of their poverty. I'm not talking about margin in the first place, I'm talking about the mindset that generates higher margin leverage, driving the risk/profit ratio to idiocy, but that's the way it is.
Exchanges don't like those who make money and adore those who might lose money trying to get rich.
Margin trading with leverage is only for experienced traders. It should be taboo for novice traders.
Diversification of storage and trading places .
This is very relevant to position trading. I wrote about it above. Don't trade or store your coins in one place.
"Russian or South Korean hackers attacked a top exchange, all cryptocurrency stolen." This is sarcasm, but this is exactly the kind of FUD for fools you will see when they just steal cryptocurrency from exchanges under the guise of such a tale. The made-up story doesn't matter, what matters is that the people behind the cryptocurrency exchanges will steal cryptocurrency from you, wearing the skin of an injured sheep).
The safety of your money (including cryptocurrencies) depends only on you, not on chance. Anything that seems random is not. If you always rely on chance instead of your mind, you are doomed. The will of chance will shadow you and haunt and empty your pocket time after time. You will always be at the forefront of the victims of your carelessness and self-confidence.
Always keep some of your positions in cold storage .
Keep some of your positions, even if you are very actively trading, on a cold or hardware wallet (preferably several). It should be at least 30% of your total deposit. This percentage should vary during certain phases of the market. In accumulation zones, most of the position should be out of the exchanges.
Diversification of stubblecoins (profits) and their blockchain storage.
Very relevant because in the future, one liquid stabelcoin like UST (Luna) will be zeroed out (disposal of money on a large scale). Probably, many people have understood this for a long time, but do not believe it will be implemented. Not only that, but most altcoins will evaporate at the moment. Yes, the probability, as always, is no greater. But if that probability is there, it is rational to take steps to make sure it doesn't hurt you. Diversification as well as swift action during an event is the best defense against something like this.
Stable coins are always a risk. Keep this diversification in mind, both by their own varieties and by blockchain if you are storing them on a hardware wallet.
Unfortunately, this is a risk you will have to accept and live with, as using stablcoins is a component of trading.
Diversify such assets not only when you are out of the market waiting to trade, but even when you are actively trading. That is, by using different stabelcoins when trading the same cryptocurrency (e.g., BTC) you reduce risk. For example, BTC/USDC, BTC /USDT or BTC/BUSD.
Any stabelcoin is an altcoin whose value (stability) is based only on people's belief in its stability .
Totally uninterested in the opinion of the crowd .
The crowd is always wrong. The majority always loses in the market. Otherwise, it would be impossible to make money in the market. Therefore, by being interested in and listening to the trend of the opinions of most market participants, you can unnoticeably lean towards the opinion and understanding of those who initially have to lose. Are you prepared for losses? No? Then why should you be?
Another option is to use the opinion of most market participants to track market trends. If you are well-versed in psychology, this will be helpful. If not, you yourself may fall prey to opinions unnoticed.
Everything unpredictable is the fate of only absolutely predictable people, it always was, is and will be .
Don't be interested in cryptocurrency news.
The chart takes everything into account, including the release of "tales for fools." All crypto news is created for price direction and nothing more.
Small-scale news for influencing fools (their logical scare/satisfaction actions) to locally influence the price. Large scale news and events to globally influence the trend and the market as a whole.
If you can understand and read between the lines, understanding what the manipulator is trying to achieve, then you can use the news background in your trading strategy. If not, and you are not a good psychologist - completely ignore the flow of information.
The positive and negative emotions of others in the market generate volatility, which is your earning wave. Ride it.
Don't mess with anonymous fools.
Appreciate your time. Don't pay attention if someone criticizes you without being constructive, or wants to impose their perspective without arguments of rightness. Such commenters are usually people with a very low social status in reality, they are trying to assert themselves through the internet in an anonymous world.
Be immune to such losers, they are the ones who want you to doubt yourself and accept their perspective. The more bile, the more anonymous cries from.
Understand that only such people have time to correspond and “spout bile” on the anonymous internet. As a rule, these are immature individuals or conventionally "mature," but with the mindset and interests of a teenager.
Don't waste your time on the vacuous or psychological aberrations of flawed Internet characters. Make good use of your time.
The behavior of people in financial markets is a projection of who they are in real life. That is, their positive and negative psychological qualities.
Don't be a trading junkie. Don't waste time.
Don't waste time. Both for meaningless Internet price guessing, and for round-the-clock trading.
Mindless guesses.
The idiocy of the crowd. Trying to guess highs or lows that are logically understandable. When all scenarios are clear and understandable. Do not turn into idiots from the "where the price of bitcoin will go" sect. Everything is always the same in every cycle.
You must decide for yourself initially (after spending several hours) on what conditions and prices you will buy this or that cryptocurrency and at what prices to sell. Have a more likely and less likely scenario. Be ready for any incarnation. Do not complicate simple logical things with the stupidity of fortune-tellers mixed with your greed.
The basis of trading is your trading strategy , that is, your knowledge that you put into practice in symbiosis with risk management , that is, your manner of taking on take risks in transactions and manage money.
To paraphrase, initially you need to understand how much you will earn when you are right, and how much you will lose (hit stop or averaging if a less likely scenario is realized) when you are wrong. In such cases, it is absolutely not necessary to know the exact price of the low or high of the trend, leave that to the idiots.
Trading 24/7.
I will write short and clear. Money without life is not needed. In everything there must be adequacy.
Knowing the instinctively more likely behavior of people (the psychology of mass behavior) in a given situation, as well as programming people's behavior (what is right / wrong, how to act in a given situation according to the rules) and creating the same situations, allows easy to manage "potentially uncontrollable behavioral chaos".
Psychology. Be yourself - don't go against yourself.
For traders Work with your trading algorithms based on your knowledge and experience, not on emotions.
For those who are faced with the fact that trading constantly "hit the head" . Become an investor.
Carefully study the cryptocurrencies you are interested in and decide whether to invest in them or not. Divide the money needed to invest in each cryptocurrency into several parts. Buy in areas of potential price reversal. After purchase, send your coins to a hardware wallet.
Stay away from your cryptocurrencies until the new bull cycle (peak will be in 2025). Also, before the big bull cycle, there will be an intermediate one by a relatively small percentage, as in 2019-2020. Don't forget to sell some of the coins to buy them back much cheaper.
It is also worth paying attention to those cryptocurrencies that are included (blockchains and protocols) in the development of CBDC and comply with the future ISO 20022 standard (already in March). XLM is one of them.

Stellar reacted well to its monthly support level!Stellar reacted well to its monthly support level over the past week. After the price of this currency hit the support level of the previous floor due to the formation of positive divergence in the daily time, the price of this currency increased in the 1-hour time. The trend is bullish on the 1-hour time frame but not yet on the 4-hour time frame, and we can see the range area on the chart. Several resistance support ranges are considered on the chart.
The closest resistance that the current price is below this level is in the range of $0.090, which, if this level is broken with buying pressure, the next targets for buyers are in the range of $0.097 to $0.100. In general, due to the price of this currency in the above time frames, it has been placed on important support levels, and the possibility of its trend being ranged for several weeks is high. Price growth can be accompanied by a negative reaction after reaching the resistance of the $0.10 range, and further support levels can be tested.

XLM weekly chart looking WHOA!XLM weekly chart...Looks probable
that XLM could make a bullish move out
of the wedge then out of the circle into
the first yellow box...RSI already broke
out, lets see if price can follow.

XRP vs XLM reloadedWho is gonna be stronger?💪 This is comparison XRPUSDT / XLMUSDT , so if the:
*price is going up, it means XRP is stronger than XLM
*price is going down, it means XRP is weaker than XLM
Here we go again. First of all check the first battle of these rivals where as predicted XRP got the upper hand:
After reaching the target it was just one big spiller down. Now it seems that after breaking all the trendlines, price shaped nice Head and Shoulder pattern with neckline slightly above the 0.5 fib. IF price breaks down, we could potentially see a drop down to lower range (fib 0.236 & 0.146 and even deeper). H&S target being 1.075.
To sum it up, I think that in the following weeks/months, Stellar could be stronger than Ripple with some pullbacks along the way (as shown by the red path). What's your take?
Check my other stuff in related ideas.
Please boost🚀, comment🗣️, follow me✒️, enjoy📺!
⚠️Disclaimer: I'm not financial advisor. This is not a financial advice. Do your own due dilingence.

$XLM better than $XRP, half supply and better version. DYORWith $XLM's 50 billion supply, it's more reassuring than $XRP's 100 billion supply, and it's not owned by a company. Although both were developed by the same person, it shouldn't take long for people to realize that $XLM is a better version. I think $XLM has potential for so much more. It is not investment advice. It's my thoughts.

Stellar Lumens XLM Is Getting Closer To a Huge BreakoutHi friends hope you are well and welcome to the new update on XLM.
Big down channel:
On a weekly time frame, from Feb 2018 to April 2020 Stellar formed a very long-term down the channel.
Huge BAT move:
During the formation of the aforementioned down channel XLM also formed a very big harmonic bullish reversal BAT pattern, which I also shared with you in 2020 as below:
www.tradingview.com
After the completion of the above BAT move, XLM surged around 1000%.
Another big falling wedge pattern:
Now again on a weekly time frame, during a big drop XLM has formed a big falling wedge pattern. The priceline entered the wedge on May 21 and still moving in this big falling wedge pattern. Now the movement of Stellar has been squeezed inside this huge pattern.
The key support and resistance levels:
XLM has already tested key support of $0.10 and if it breaks out the big wedge then the next key resistance will be at $0.12.
Descending triangle:
On a daily time frame, for more than 4 months XLM is moving inside a descending triangle, and now the movement of the price line is also getting squeezed inside this descending triangle, therefore, soon we can expect that priceline may break this triangle. If Stellar breaks down the support of this triangle then the target to the downside is at $0.045, however, we have key support at $0.10, therefore, it will be really very difficult for XLM to break down this support, and in case of break out the triangle’s resistance, the target to the upside is approximately $0.18. In that situation, Lumens can also easily break out the wedge and also the key resistance of $0.12. By the way, the target for the break out from a big falling wedge pattern, which has been formed on a weekly time frame is approximately $0.75.
Conclusion:
After a big drop XLM has formed a big falling wedge pattern and now the movement is quite squeezed that is another signal that soon the priceline can break this pattern soon. As it is a kind of repetitive move like XLM previously formed from 2018 to 2020, therefore, we can expect that this time Stellar can start a big rally after breaking out this huge pattern.

XLM/USD - Can XLM explode like XRP? YES! 😍XLM is lagging behind XRP in terms of price action. You can call it the little brother of XRP.
XRP consolidated in a similar channel and then broke out with a 50% pump.
I expect XLM to rally hard once it breaks this channel. The price action and volume show that buyers are interested.
My bias is bullish on this price action. Not sure why XRP and XLM are bullish in the current market conditions, but I am not here to judge, but rather to analyze the price action.
XLM looking quite decent here, but watch for a possible rejection again at the key resistance level.
Like and follow if you liked my idea!

STELLAR (XLM)A bullish cross of 1D 50MA with 200MA could bring XLM into 0.000006 BTC area. That's the spot where 3D 200 EMA is hanging.
Again, let's see at once how BTC is developing, I think if it rise in 35k area could bring a positive sentiment to the market, even for short time though.
I am stuck with it since Jan therefore I need a bounce. 👆🏻
Best regards everybody.

Stellar (XLM) formed bullish Gartley for upto 12.50% moveHi dear members, hope you are well and welcome to the new trade setup of XLM .
Previously I shared a long-term trade setup for XLM , which is still in play:
Now on a 4-hr time frame, XLM has almost completed a bullish Gartley pattern. There is also a hidden bullish divergence, as the priceline is forming a higher low and Stochastic is setting a lower low.
Note: Above idea is for educational purpose only. It is advised to diversify and strictly follow the stop loss, and don't get stuck with trade

XLM UP AND DOWNThere is potential for XLM to rise to the marked red zone and then correct. Set stops for your positions.

Stellar XLM - Huge dump is incoming! Falling wedge + triangle
On the daily/3D chart, we have a pretty strong bearish downtrend. We just hit a brand new low a few days ago, so it's really not looking good at all.
We can spot a triple bottom, which is usually a sign of a descending triangle pattern or a rectangle continuation pattern. There is a lot of liquidity below this level and the market usually comes for the stop losses.
The chart is printing a falling wedge and a local descending triangle. Both of them have a bearish bias until we break these patterns.
We deeply need to go down for the final fifth impulse wave to complete this ABC correction. Because otherwise, if we pump now, then this structure was an impulse and it's going to be a dead cat bounce rally, followed by another bear market below 0.026 USDT.
XLM is a great coin and I believe we will have a massive pump in 2023-2024, but for now it's still bearish and we need more confirmation to buy this altcoin.
For more analysis, hit "Like" and "Follow"!

stellar xlm price prediction 2022my stellar xlm price prediction 2022, i am long but after a long range

XLMA strong downtrend, then a stop, without a significant pullback, a descending rectangle was formed.
The tool will go below. Two entry points, a rebound from the level of 0.13 or a breakdown of 0.1, then a retest of this level and down, the potential of the move is 30%.

XLM - beutiful wedge inside wedge !There is a beautiful broadening bullish wedge forming (blue line) that has recently broken to the upside.
Confirmation has been signaled and price is in backtesting mode.
This broadening descending wedge is developing inside a larger pattern: a broadening bullish wedge (not descending but broadening to down- and upside).
All this happens on the BTC pair.
My take is that once Altseason gets going XLM will be one of the most explosive coins in the market.

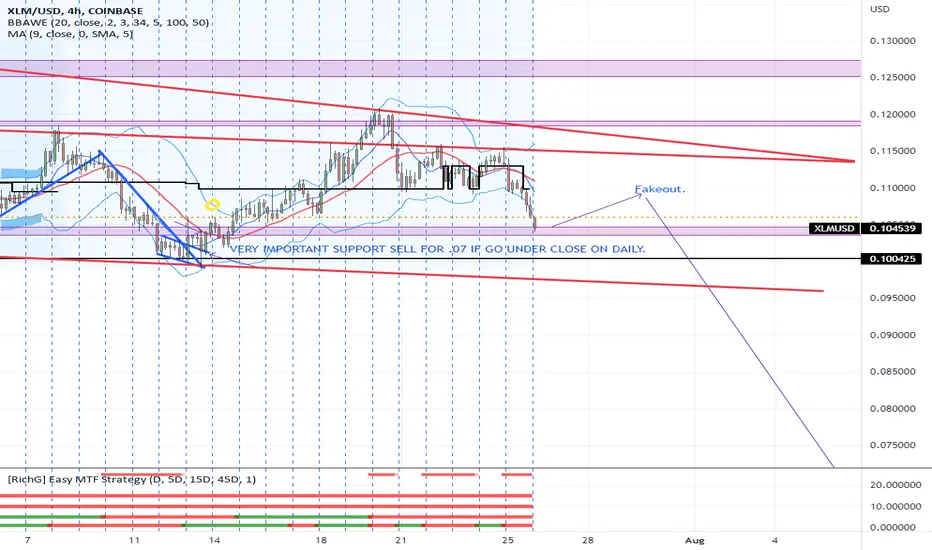
XLM not looking goodXLM picked up no steam on ETH pump, ETH sentiment looks bad now XLM could drop to .07 from here, as sad as it is this is the time to be selling, ill be selling ATLEAST half of my positions on this small supportive bounce, I think this support will be invalidated and we could test lower to levels of .09 first then to .065. A move above the supportive red line would invalidate the bearish scenario
Stellar XLM - Prepare your buy orders! + 0.618 FIB + Wedge
XLM is very close to the 0.618 FIB retracement of the huge Impulse wave from 2020-2021.
Also the price is close to a massive horizontal support line from 2020.
I expect last wave to the downside to finish this downtrend and then I can see at least a retracement back to 0.25 USD.
As per my Elliott wave analysis - an impulse wave to the downside is almost completed as you can see.
If we take a look at the volume indicator, we can see there is absolutely no bearish pressure, which is always great to see.
On the weekly chart we can spot a falling wedge - bullish reversal pattern and the price is currently near the support line.
You can set a limit order to buy XLM at 0.0888 USD if you want to speculate on this move.
Look at my ideas about interesting altcoins in the related section down below ↓
For more ideas please hit "Like" & "Follow"!

Stellar 100% Potential Mid-Term (Weekly Timeframe)We have strong signals coming out of this chart in favor of the bulls, let's look at those.
This is XLMBTC (Stellar) on the weekly timeframe; aka. Long-term.
First, notice the broken downtrend-line.
This trendline marked a bearish trend that lasted more than a year.
This bearish trend has been broken.
Second, we have a long-term higher low, since December 2020.
1.5 Years and the old support wasn't even tested, this is a strong signal in favor of the bulls.
Trading volume continues to increase week after week.
Above 9-May's low (0.00000391), we are strongly bullish and expect additional growth.
Below this level, we stop any trading at a loss.
Namaste.

XLM - starting to outperform BTCAs many altcoins, XLM has started to massively outperform Bitcoin !!
Will be interesting to see how this further develops ....

Stellar Goes Bullish Long-Term (100% to 190% Potential Targets) Notice the blue down-trendline on this pair, XLMBTC.
We can see prices moving above this trendline this week, breaking a major downtrend.
We have a long-term higher low (since December 2020).
A very strong RSI (55-Weekly).
The MACD going bullish.
We can also appreciate prices moving above EMA10 and EMA50.
The blue square at the bottom is our support.
This is where we set our stop-loss.
More details on the chart (targets).
Namaste.

XLM / BTC Main trend. Channel. Accumulation 2.5 years.Coin with the longest accumulation of 2.5 years. I work in this accumulation from the moment of its formation. The step of this channel is 100% (previously 55%) At the moment the price is at its lower zone.
Coin in coenmarket: XLM
XLM/BTC The channel of the position set 2.5 years.

Stellar (XLM)- June 14hello?
Traders, welcome.
If you "follow", you can always get new information quickly.
Please also click "Like".
Have a good day.
-------------------------------------
(XLMUSD 1W Chart)
Below 0.124080 is likely to be a mid- to long-term investment area.
Therefore, the key issue is whether it can rise above 0.124080 to receive support.
(1D chart)
In the short-term and medium-term perspective, it needs to rise above the 0.124080-0.132063 section and find support to turn into an uptrend.
However, since a volume profile section is formed around 0.164204, it can be said that it is completely converted to an upward trend only when it rises above this point.
------------------------------------------------------------ -----------------------------------------------------
** All indicators are lagging indicators.
Therefore, it is important to be aware that the indicator will move accordingly as price and volume move.
However, for convenience, we are talking in reverse for the interpretation of the indicator.
** The MRHAB-T indicator used in the chart is an indicator of our channel that has not been released yet.
** The OBV indicator was re-created by applying a formula to the DepthHouse Trading indicator, an indicator disclosed by oh92. (Thanks for this.)
** Support or resistance is based on the closing price of the 1D chart.
** All descriptions are for reference only and do not guarantee a profit or loss in investment.
(Short-term Stop Loss can be said to be a point where profit and loss can be preserved or additional entry can be made through split trading. It is a short-term investment perspective.)
---------------------------------
