The line where “ALT SEASON” can begin...!!!Lets face it...Alts look terrible vs Bitcoin and it seems like many could be going to Zero which in crypto means delisting...However times like these when the chart seems to have no bottom tend to be opportunities...Bitcoin still looks strong but if it ranges for several weeks of price action it could give the Alt market a little jolt of energy as money is spread around crypto, especially if bitcoin is not giving the previous returns the market has been used too. This XLM chart is one example of a rising line of historic support that when previously touched has produced parabolic bounces in the overall ALT market...Bitcoin runs the show and its near term price action will dictate if ALTS give a good trade opportunity...Trade Safe...Chonis
Xlmbtc


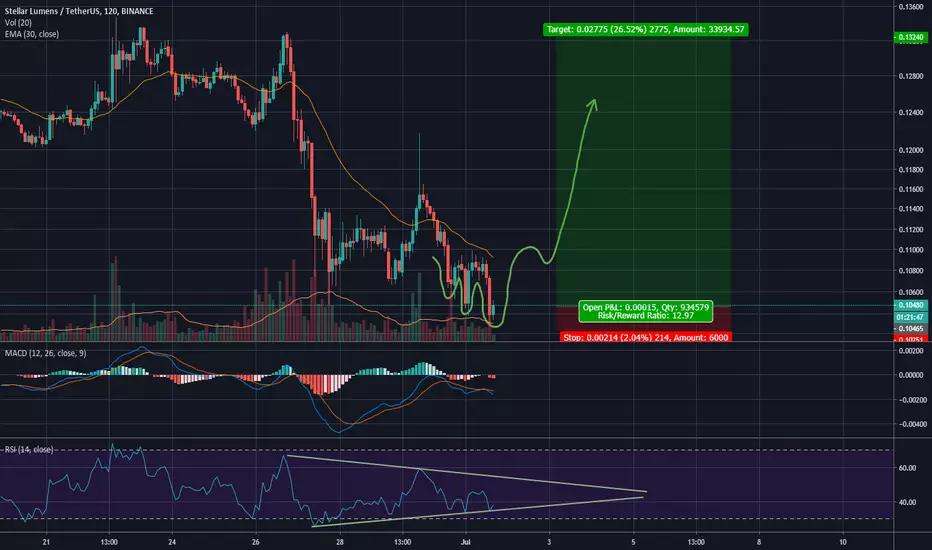
XLM found the bottom and hit strong support lineXLM according to the symmetrical analysis found the bottom and will jump in uptrend channel.

Falling wedge. Resistance levels = bullish targets.If you have no clue about the future TP levels for XLM I can help you!
Good luck!
PS.
Sorry for bad drawing (actually looks like worms) using an laptop. But I hope you understand what I wanted to tell.

Regularized Volume Zone Oscillator - #XLM / #BTC @InSilicoShowing strong buy signal as well on the daily

#XLM / #BTC $XLM / $BTC - Using @InSilicos Guppy Indicator!If you're not long, you're wrong... According to the Guppy's!
Lower S2 pivot held strong
4H price forming an ascending triangle
*****InSilicos Guppy's showing green signal*****
RSI has blasted up to strong demand levels with price not moving much relatively
Bitcoin hesitating, consolidating and still above our lower support of 10.7
Other alts blasting off such as LINK, QNT, and DRGN... and many more
Are altszns about to be back again?
We shall see soon


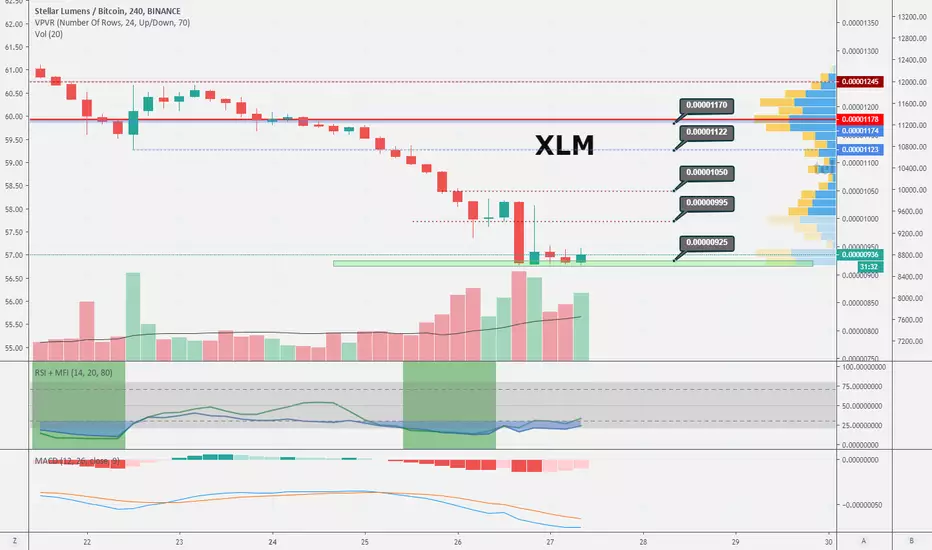
BUY STELLAR - ABSORB PANIC + NISON STRATEGY SELL TARGETSBARS A & B ARE THE SAME LENGTH YET...
WITH 4X VOLUME, BAR B COULD NOT MAKE FURTHER DOWNWARD PROGRESS
HOWEVER...
NO LOWER SHADOWS AND REDUCED VOLUME SUGGEST A
LACK OF BUYING INTEREST ABOVE THIS SUPPORT LEVEL
LOSS OF BEARISH ENGULFING PATTERN SUPPORT...
SHOULD CAUSE PANIC SELLING INTO OPERATOR'S BUY ORDERS
ABOVE SIGNIFICANT PITCHFORK SUPPORT LEVEL
STEVE NISON'S PB&J (PULL BACK TO SWEET SPOT) STRATEGY SUGGESTS...
SELLING BETWEEN 1189-1290
PITCHFORK RETURN TO CENTER LINE THEORY SUGGESTS...
SELLING AT 1500

Is it the beginning of the end or the end of the beginning? #5If you want to be a master on trading, You must review over thousands charts! And, sleepless nights!
There is no overnight success in a trading life. Let me remind you one of my favorite old story ;
A Harvard professor once asked his students to do a special report on fish. His scholars went to the library, read books about fish, and then wrote their expositions. But after turning in their papers, the students were shocked when the professor tore them up and threw the min the waste basket.
When they asked him what was wrong with the reports, the professor said, “If you want to learn anything about fish, sit in front of a fish bowl and look at fish.” He made his students sit and watch fish for hours.
Then they re-wrote their assignment solely on their observations of the objects themselves. Being a student of the market is like being a student in this professor’s class: if you want to learn about the crypto market, you must observe and study the major indexes carefully.
In doing so, you’ll come to recognize when the daily market averages are changing at key turning points—such as major market tops and bottoms—and learn to capitalize on this with real knowledge and confidence.
Chart speaks itself, Less is More!
Your objective isn’t to buy at the cheapest price or near the low, but to begin buying at exactly the right time, when your chances for success are greatest. This means that you have to learn to wait for a crypto to move up and trade at your buy point before you make an initial commitment. If you work and cannot watch the market constantly, small quote devices or quotes available on cell phones and Web sites will help you stay on top of potential breakout points.
In the crypto market, and success has nothing to do with listening to tips from other people or being lucky. You have to study and prepare yourself so that you can become successful on your own with your investing. So make yourself more knowledgeable. It isn’t easy at first, but it can be very rewarding. Anyone can learn to do it. You can do it. Believe in your ability to learn.
Dont forget to follow me on twitter.com

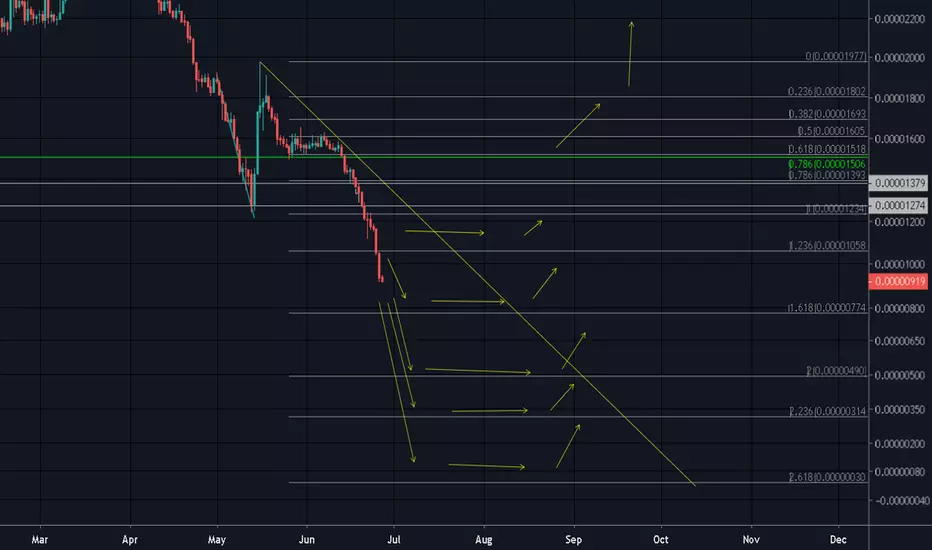
STR/BTC to zeroooo !!!- I'm remain bearish until this coin break the recent down trendline for a first sign of reversal, but before that happen.. i expect this coin to 30 satoshi or zeroooo!!! lol.
- Expect a bounce from one of the support fibonacci line on quick pace after it's prolonged seller pressure.
Indicators :
DMI : -DI is still on the rise, ADX is still above 25.
MACD : still no sign of reversal from buyer side. seller histogram is still building also the macd line is hover around bearish area.
MFI : currently in oversold condition.
peace..
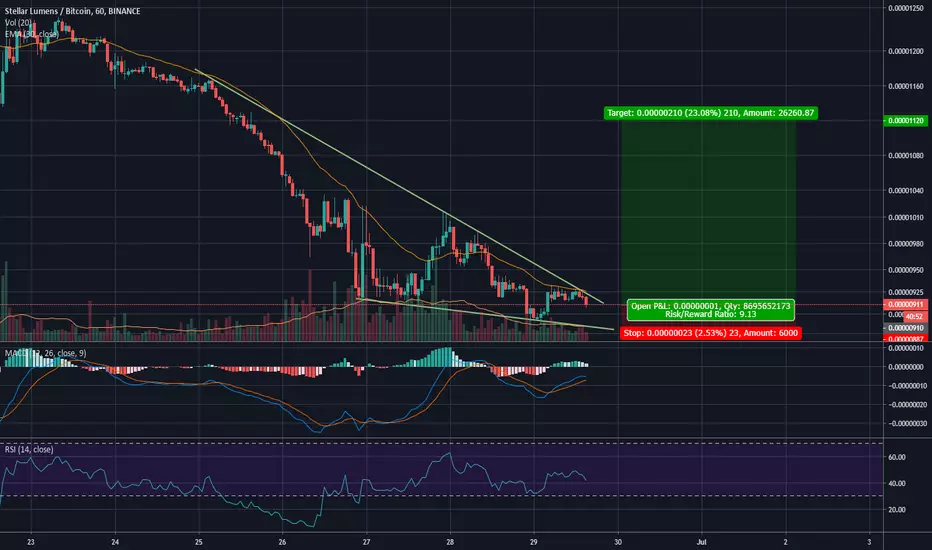
XLM found supportI was expecting Stellar to fall down to 730, but some really nice volume met it at ~915 support. Might push up from here. Here is my setup.
Pullback buy zone 915-935
Targets 995 - 1045
HODLer's candy 1020
Stop loss below 898
Stopless strategy - double order at 730 and sell at 900
Risk/Reward Ratio 1.8 / 3.3 (for main targets)

$XLM #XLM Bottom soon at 835 sats? Or full trace to 450-475?Stellar has never been this oversold on the daily tf lol

