XLM/USDT Breakdown: Structure Shift & Bearish Retracement Setup🚀 XLM/USDT Trade Outlook 🔎
I've been reviewing the XLM/USDT pair, and it's showing a very familiar setup compared to other majors. 🔁 On the daily timeframe, we've seen a notable shift in structure, with a clear break to the downside. 🧱📉 Dropping into the 4-hour chart, that structural break is even more apparent, adding confidence to a bearish bias. 🔍
Currently, the pair is extended away from value—and I’m anticipating a pullback into the fair value zone, where I’ll be watching closely for a potential short setup. 📐💼
🎯 In the breakdown video, we cover:
The prevailing trend context 🌊
How market structure is unfolding across timeframes 🔂
Price action cues to validate the setup 🎥📈
Key support and resistance areas for both entry and target planning 🎯
For risk management, I’m positioning the stop above the retracement high, using roughly 2x ATR for calculated protection 🛑⚙️. A potential reward could extend to 5–6x ATR, depending on how price reacts around prior structure levels on the left. ⬅️📊
As always, I’m cross-checking with my Fibonacci levels for extra confluence—and the alignment here is looking solid. 🔢🧲
Remember, this is not financial advice. Always do your own due diligence. ⚠️💡📉
XLMUSD

XLMUSD: Aggressive surge expected to at least 0.5500Stellar (XLMUSD) just turned bullish on its 1D technical outlook (RSI = 55.377, MACD = 0.005, ADX = 37.056), extending the rebound on its 1W MA50. The long term pattern is a Triangle so for the medium term the upside is limited to 0.55000. Since however the structure from mid 2024 resembles late 2016 onwards (price rising then pulling back to the 0.5 Fib), we expect a rise to the 1.618 Fib (TP = 2.5000) if the price crosses above the LH trendline.
## If you like our free content follow our profile to get more daily ideas. ##
## Comments and likes are greatly appreciated. ##

XLMUSDT 1D AnalysisXLM ~ 1D Analysis
#XLM Buy after successfully penetrating this resistant line with a short -term target of at least 10%+ from here.

XLM will be one of the big winners during the coming breakout!XLM, which has historically traded closely with XRP, will be one of the big winners during the upcoming breakout in May—potentially continuing into June, July, and even August.
Good luck, and always use a stop-loss!

Is #XLM Setting Up for a Bull Trap Before a Major Drop?Yello, Paradisers! Is XLMUSD gearing up for a breakout, or is this just a classic liquidity grab before the next major dump? Let’s break it down.
💎Right now, #XLMUSDT is testing a minor resistance at $0.28464, a level where price has repeatedly struggled to push higher. While there is a possibility of a breakout, the presence of strong liquidity around the unmitigated supply zone at $0.31917 suggests that any move higher could be a trap before a significant drop. If price does manage to break above this resistance, traders should be cautious it’s likely just a liquidity grab before a larger move to the downside.
💎Once the price reaches the unmitigated supply zone, a rejection is expected, leading to a downward move toward the key support zone at $0.22699. This level has historically been a strong demand area where buyers could step in, potentially causing a temporary bounce or consolidation before any further downside.
💎As CRYPTOCAP:XLM moves lower, it’s crucial to watch volume activity. If the decline happens with high volume, it will confirm strong selling pressure and increase the likelihood of a deeper drop. However, if the price approaches $0.22699 with low volume, it could indicate a lack of seller conviction, leading to a short-term bounce before resuming the downtrend.
💎The EMA 200 continues to act as dynamic resistance, reinforcing the bearish outlook. As long as price fails to hold above $0.28464 or gets rejected from the supply zone, the bearish setup remains intact. In that case, a move toward $0.22699 and potentially even $0.19151 becomes highly probable. Watching volume reactions at these key levels will be essential to confirm the next move.
💎The only scenario that could invalidate this bearish setup is a strong close above $0.36172 with high volume. That would signal a potential shift in market structure and could indicate renewed bullish momentum.
Paradisers, patience and precision are key in this market. Let the levels guide you, trade strategically, and stay disciplined. Avoid emotional decisions this market punishes the impatient and rewards those who stay focused.
MyCryptoParadise
iFeel the success🌴

XLM Is About to Trap Thousands of Traders ?Yello Paradisers are you prepared for the next major move on XLM, or are you walking straight into the bull trap? We’re now approaching a critical decision point on XLMUSD that could shake out a lot of traders who are only reacting instead of planning. Here's exactly how we're playing it, step by step.
💎#XLMUSDT is currently trading inside a descending channel. As of now, we see a high-probability scenario where the price gets rejected from the descending resistance, setting up an ideal short opportunity with the current structure still favoring sellers. Should this rejection play out, we expect a breakdown of the moderate support level, with our target set at the $0.1970 zone.
💎Adding more weight to this bearish outlook is the fact that XLM is trading below both the 50 EMA and 200 EMA. This technical alignment confirms broader weakness in the trend and reinforces that any breakout attempts at this stage are likely to be reactive rather than sustainable simply small retracements within a dominant bearish macro setup.
💎However, if price fails to respect the descending resistance and pushes higher, our next major decision area is the supply zone at $0.2537. At that point, as always, we’ll wait with full discipline for confirmation. We’ll be watching closely for clear bearish reversal patterns, such as an Evening Star or a Shooting Star, before taking action. Only a strong and confirmed breakout above the $0.2537 level would invalidate our bearish outlook and shift the market structure into bullish territory.
Stay focused, Paradisers. Be the hunter, not the hunted.
MyCryptoParadise
iFeel the success🌴

XLM/USD Main trend. Timeframe 1 week. Channel. Radiant Star of 2218) One of the most “silent” cryptocurrencies. Unlike its fellow clone, pumped up by the community on the ears of pseudo-esoterics (although 589 is not going anywhere, which is, that is, it is not price))))....
Note that past secondary trend reversals are shrinking after significant dips. We are now in the lower zone of the channel, but not at the lowest potential values. Never “catch” the lows and highs, but work most of your position near those values, and you will be happy and relaxed.
I advise you to combine pyramiding (up) + martingale (down), and you won't care where the price goes, because you'll be happy with either direction. It is also rational to protect your profits with stops, but not near intraday volatility.
It is also natural for your peace of mind to forget about two things if you have a mind:
1) Forget margin trading. Work only on spot.
2) Forget the 1 “world's most reliable exchange” (diversification of trading and storage).
Coinmarket: XLM
About the enlightenment: .
1) Instant (less than 3 sec) transactions,
2) Conditionally free transactions $0.000001 (0.00001 XLM micro payments),
3) No network congestion (30 sec refund in case of failed transaction (not to be confused with exchange),
4) Smart contacts and NFT (2022),
5) "Transaction rollback" (this is an advantage, not a disadvantage for real use, not speculation),
6) Support for multi-currency transactions.
7) Interest in XLM blockchain by states.
And much more...
Roughly speaking, all the best worked out solutions from thousands of temporary “faith cryptocurrencies” over the last 10+ years.
Incidentally, many states will be making “transitional” fiat currencies on this blockchain. For example, the long-suffering Ukraine. But then when there will be “total sadness”. Creating a problem—presenting a ready-made solution.
Here's what this important zone looks like on the 1-day timeframe. Key reversal or trend continuation zone.
Breakout of the local symmetrical triangle +10% to the mirror resistance level of 0.2022.

XLM/USDT Secondary trend. 14 04 2025Logarithm. Time frame 3 days. After a big pump "with a stick" (so that the "waiters" who want "a little cheaper" would not have time to buy) +8.5X from the accumulation zone of 2.4 years, now a descending wedge is forming on the rollback, similar to 2017. Breaking through its resistance (breaking the downward trend) - the second wave of price growth:
1) through consolidation and sideways movement (cutting the zone, dumping "in waves").
2) aggressive pump as in 2017 "with a stick" and entry into the main distribution zone (late autumn 2025)
The previous idea of the secondary trend was published on 14 01 2024 Exactly when the position was being collected in the horizontal channel in the 4 zones shown, as well as the reversal zone and the percentage of this first strong pump (under XRP).
XLM/USDT Secondary trend. 14 01 2024
XLM/USD Main trend. Timeframe 1 week. Channel. Publication in 2022.
Local wedge breakout zone.

Sorry StellarI think price movements will continue in this way between parallel lines.
* The purpose of my graphic drawings is purely educational.
* What i write here is not an investment advice. Please do your own research before investing in any asset.
* Never take my personal opinions as investment advice, you may lose your money.

XLM - Still Moving With XRP XLM has made a strong move along with XRP and has perched itself on top of the Monthly Gaussian Channel
I have posted the comparable move that occurred in 2017 which puts price above $40, I doubt it will perform as well as previously but its cool to see.
Very bullish on this Monthly

XLMUSDT, We are near buy zone areaHello everyone
According to the chart that you can see , the price is in correction wave and we think the price should come and do the end of corretion in buy zone area and after that is ready to move up , you can buy in 2 part in each of the buy zone area and after that at least 50% percent profit is near to us.
Be lucky
AA

XLM charts with April 'flash crash' thesis zones.Here's my latest XLM chart, which includes potential levels that could be hit, along with an alternative path for the 5th wave, assuming the bottom is already in on the chart.
- If wave 4 is already complete, then the wave 6 "flash crash" low would likely be higher than the chart shows.
- If wave 4 isn't complete, then the wave 6 "flash crash" would likely sweep that low, prior moving into the real breakout beginning in the month of May.
- The real breakout, the 7th wave, would likely take out the previous pattern high making a run for what could potentially become a new all-time high in XLM.
Keep in mind that the "flash crash" in April is a theory and may not come to fruition or could be off in timing. However, I do believe that the breakout will begin in May, even if the "flash crash" does not occur in mid to late April as I've theorized.
Good luck, and always use a stop loss!

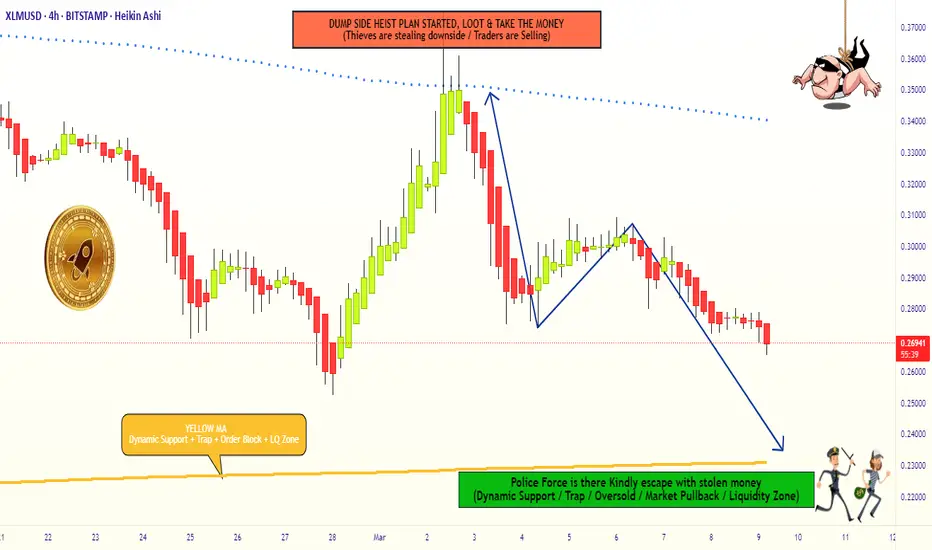
XLM/USD "Stellar vs US Dollar" Crypto Market Heist Plan🌟Hi! Hola! Ola! Bonjour! Hallo! Marhaba!🌟
Dear Money Makers & Robbers, 🤑💰✈️
Based on 🔥Thief Trading style technical and fundamental analysis🔥, here is our master plan to heist the XLM/USD "Stellar vs US Dollar" Crypto market. Please adhere to the strategy I've outlined in the chart, which emphasizes short entry. Our aim is the high-risk Green Zone. Risky level, oversold market, consolidation, trend reversal, trap at the level where traders and bullish robbers are stronger. 🏆💸Book Profits Be wealthy and safe trade.💪🏆🎉
Entry 📈 : "The vault is wide open! Swipe the Bearish loot at any price - the heist is on!
however I advise to Place buy limit orders within a 15 or 30 minute timeframe most recent or swing, low or high level. I Highly recommended you to put alert in your chart.
Stop Loss 🛑:
Thief SL placed at the recent / swing low level Using the 4H timeframe (0.30000) swing trade basis.
SL is based on your risk of the trade, lot size and how many multiple orders you have to take.
Target 🎯: 0.23000 (or) Escape Before the Target
🧲Scalpers, take note 👀 : only scalp on the Short side. If you have a lot of money, you can go straight away; if not, you can join swing traders and carry out the robbery plan. Use trailing SL to safeguard your money 💰.
XLM/USD "Stellar vs US Dollar" Crypto market is currently experiencing a Bearish Trend,., driven by several key factors. 📰🗞️Read Fundamental, Macro, COT Report, On Chain Analysis, Sentimental Outlook, Intermarket Analysis, Future Prediction:
📌Keep in mind that these Fundamental factors can change rapidly, and it's essential to stay up-to-date with market developments and adjust your analysis accordingly.
⚠️Trading Alert : News Releases and Position Management 📰 🗞️ 🚫🚏
As a reminder, news releases can have a significant impact on market prices and volatility. To minimize potential losses and protect your running positions,
we recommend the following:
Avoid taking new trades during news releases
Use trailing stop-loss orders to protect your running positions and lock in profits
💖Supporting our robbery plan 💥Hit the Boost Button💥 will enable us to effortlessly make and steal money 💰💵. Boost the strength of our robbery team. Every day in this market make money with ease by using the Thief Trading Style.🏆💪🤝❤️🎉🚀
I'll see you soon with another heist plan, so stay tuned 🤑🐱👤🤗🤩
Stellar XLM price analysisWhile CRYPTOCAP:XRP price has already firmly established itself above the 2021 highs, the junior "padawane" CRYPTOCAP:XLM has not yet succeeded.
But compared to other alts, the price of #XLMUSDT is still very well held and moves from level to level.
There was a nice rebound from $0.226 to the current $0.27
Of course, it would be nice to test $0.19-0.20 as a courtesy gesture according to TA canons, but if it doesn't, it will only confirm the strength and serious intentions of buyers.
⁉️ Who knows, maybe this year the alt-season will come, and the #Stellar price will reach the current #Ripple levels around $2.30
How much will CRYPTOCAP:XRP cost then?)

XLM Looks Bearish (1D)It seems to be pulling back within the internal structure. From the supply zone, it may move toward the green zone. The green zone is a strong area where we can consider rebuying.
A daily candle closing above the invalidation level will nullify this analysis.
For risk management, please don't forget stop loss and capital management
Comment if you have any questions
Thank You

XLM short termHello
this time I am posting a short term idea (few days to few weeks).
After explosion in Q4 of 2024 XLM has formed a downtrending channel which can potentially turn into a bull flag.
Currently XLM price is sitting at a bottom of this channel.
Short term traders can look to purchase some XLM now and wait till it comes towards the top of the channel to sell and get some profit. If it reaches top of the channel potential is 50% price increase.
If the market turns bullish in next few days to weeks XLM might even break upwards out of this bull flag but do not count on it just yet.
This idea is somewhat risky so proceed with extreme caution and with tight stop-loss below the channel.
Good luck.

Downward Trend Alert: Stellar Set to Drop 30% to $0.27Hello and greetings to all the crypto enthusiasts, ✌
I aim to provide you with a comprehensive overview of the future price potential for Stellar ,💡
The price is currently in a descending cycle and has lost nearly all significant support levels, signaling a continued bearish momentum. Based on the current market structure, a further decline of approximately 30% is expected for Stellar, with a potential drop towards the target price of $0.27. 📚🙌
This outlook reflects a broader market correction, and to assist with a more comprehensive understanding, key support and resistance levels have been highlighted on the accompanying chart. 📚✨
🧨 Our team's main opinion is: 🧨
The price is in a downward trend, has broken major support levels, and could drop another 30%, reaching a target of $0.27, with key support and resistance marked on the chart for clarity.
Give me some energy !!
✨We invest countless hours researching opportunities and crafting valuable ideas. Your support means the world to us! If you have any questions, feel free to drop them in the comment box.
Cheers, Mad Whale. 🐋

XLM/USDT(BUY)hello friends
According to the formation of a QM model, it is possible to enter into a transaction with risk and capital management.
*Trade safely with us*

XLM is going to put some smiles on people's faces very soon!The XLM chart appears to be showing some serious potential for growth. Currently trading within a descending wedge pattern and displaying a 5th wave internal wave count, XLM could outperform many people's expectations if the 5th wave plays out. Although many people tend to prefer XRP over XLM, I wouldn't count it out just yet, as—with recent price increases—it has potentially become more desirable compared to XRP due to its lower entry price range. As we know, many people don’t have a lot of extra cash just lying around nowadays.
Good luck, and always use a stop loss!

XLM Buy/Long Setup (12H)After heavy drops, it is approaching a key support level.
It is expected to bounce upward upon hitting this support.
A daily candle closing below the invalidation level will invalidate this analysis.
Let’s see what happens.
Do not enter the position without capital management and stop setting
Comment if you have any questions
thank you

$3.00 + XLM by September is very likely! It's no mystery that XLM and XRP often trade like they are family. Much like an older brother, XRP generally paves the way for XLM—the younger sibling—and the two share a similar charting structure. However, since the "Trump election pump," although both have broken out, XLM has yet to break above the upper trendline of the current wedge pattern. This leads me to believe that we may soon see XLM surprise everyone. Instead of following, it may take the lead this time by breaking out of the wedge pattern, setting a new all-time high, and then entering price discovery along with its older brother, XRP. Together, they will likely lead the entire crypto market, as they are two of the ISO 20022-compliant tokens with the most potential for widespread adoption.
Keep an eye on XLM—I believe it will not only play catch-up but may even lead XRP and the broader crypto market in the next leg up.
Good luck, and always use a stop-loss!

XLMUSD - SHORT SETUPCoin: #XLM/USDT
Short Set-Up
Leverage: 5-10x
#XLM already breaked down the symmetrical triangle and looking bearish.
Entry: 0.278 - 0.284$(Enter partially)
Targets: 0.272 - 0.266 - 0.260 - 0.254 - 0.242 - 0.230$(Short term)
Stop-loss: 0.290$
Please support with a like/boost and follow for more useful crypto updates!

Will there be one more liquidation candle for XLM?XLM closely follows XRP's price action. Many investors, traders, and speculators understand that this relationship can provide distinct advantages at times, depending on market circumstances. However, it appears that XLM may have one more liquidation event in mind before the next leg up. Although there is no guarantee that this will occur, I believe it is very likely, as the weak doji candle—currently at the $0.23 cent level—would allow another liquidation event to clear the last remaining remnants of sell-side liquidity currently resting below the previous liquidation candle. I could be wrong, but this is an area to keep your eyes on in the event that the price continues to move downward.
Good luck, and always use a stop-loss!
