Xlm - trade for Quick 23% gains Xlm bull flag is about to breakout.
Look for quick 23% gains incoming.
XLMUSD

Let me tell you buddy
The high price of Stellar in 2017 was $1 and this would be the 2021 target.
For more details see attached idea.
XLM vs XRP:
Now, XLM is cheaper and faster than XRP.
Jan 2021 XLM was 0.435 $ (Bitcoin was 35000 $):
Jan 2021 XRP was 0.356 $:

XLMUSD - Some Explanation Leading Into The NFP's - ARIASWAVE 101In this video I talk about waves, what's new?
The waves are the only important thing you should be observing on a chart!
Aside from the waves what else would you be looking at?
A higher high? A lower low? Indicator? Oscillator, Alligator, News, Planet Alignment, troll comments?
They are all useless.
So far no one has any good argument against proper wave analysis which you can only find here.
By the way this is just the beginning, I have only just begun to get my feet wet here.
Stay tuned.
See related ideas linked below.
Remember to use Disciplined Money Management Principles to ensure longevity as a trader.
Just remember: I am not a financial advisor, I suggest using this only as a guide. Always do your own research.
If you don't know the long term pattern shouldn't you be doing your research instead of just following the crowd?
Each video idea I post builds on the previous idea as I use AriasWave to try and navigate the waves in Crypto Markets.

XLM Continues Testing Resistance: Big Uptrend ExpectedHey traders 👋
As the chart shows 📈 :
- XLM is testing Resistance again and again 🦾 , this means that buyers are propense to buying even near resistance → signal of buying strength
- It's also forming interesting patterns (see attached idea)
In my opinion, the best time to buy is near the short-term support(which in long-term is nearly the resistance area), I am expecting big uptrend in the following days/weeks

Should I buy XRP or XLM ? Should I buy XRP or XLM ?
Historic ratios actually suggest you should hold both !!!
December and January was the time to sell XLM for XRP (I sold XLM for XRP indeed).
Now we are in NEUTRAL ZONE.

Should I buy XLM or XLP ? As I said earlier: December 2020 / January 2021 was the time to sell XLM (you could buy more than 1 XRP with 1 XLM) !!!
There has been a time to sell XRP for XLM (during most of 2019 or 2020 you could buy 4 XLM with only 1 XRP) !!!
Now the time is to hold both..... or if you prefer, you can buy both. We are in neutral territory.
Whatever you will choose to do .... God bless you and your investment !!

Let's Go Alreadaaay!1st Target $0.32
No reason why we can't go to $0.40 soon though.
XRP is also looking super hot. Like ooooh dang. That's a spicy meataball!!
(Not financial Advice)
"Do I really look like a guy with a plan...?"
-Heath Ledger as The Joker

Stellar (XLM) - August 3Hello?
Welcome, traders.
By "following", you can always get new information quickly.
Please also click "Like".
Have a nice day.
-------------------------------------
(XLMUSD 1W Chart)
If the price holds above the 0.16420803-0.23438790 range, it is expected that the uptrend will continue.
(1D chart)
If the price holds above the 0.23438790 point, it is expected to turn into an uptrend.
In order to continue the upward trend, it should rise above the 0.4293161-0.44798284 section.
If it declines from the 0.16420803 point, there is a possibility of entering the mid- to long-term investment area, so careful trading is required.
--------------------------------------
(XLMBTC 1W chart)
If it rises from the bottom box section, 428 Satoshi-746 Satoshi, and maintains the price above the 746 Satoshi point, it is expected to turn into an uptrend.
If the price is maintained above the 1103 Satoshi-1288 Satoshi section, it is expected to create a new wave.
(1D chart)
We'll have to see if we can get support by going up to the 731 Satoshi-817 Satoshi section.
If the price holds above the 817 Satoshi point, it is expected that it will turn into an uptrend and move higher.
If it falls from the 731 Satoshi point, there is a possibility of entering the mid- to long-term investment area, so careful trading is required.
------------------------------------------
We recommend that you trade with your average unit price.
This is because, if the price is below your average unit price, whether it is in an uptrend or in a downtrend, there is a high possibility that you will not be able to get a big profit due to the psychological burden.
The center of all trading starts with the average unit price at which you start trading.
If you ignore this, you may be trading in the wrong direction.
Therefore, it is important to find a way to lower the average unit price and adjust the proportion of the investment, ultimately allowing the funds corresponding to the profits to regenerate themselves.
------------------------------------------------------------ -----------------------------------------------------
** All indicators are lagging indicators.
Therefore, it is important to be aware that the indicator moves accordingly with the movement of price and volume.
However, for the sake of convenience, we are talking in reverse for the interpretation of the indicator.
** The wRSI_SR indicator is an indicator created by adding settings and options to the existing Stochastic RSI indicator.
Therefore, the interpretation is the same as the traditional Stochastic RSI indicator. (K, D line -> R, S line)
** The OBV indicator was re-created by applying a formula to the DepthHouse Trading indicator, an indicator disclosed by oh92. (Thanks for this.)
** See support, resistance, and abbreviation points.
** Support or resistance is based on the closing price of the 1D chart.
** All descriptions are for reference only and do not guarantee a profit or loss in investment.
Explanation of abbreviations displayed in the chart
R: A point or section of resistance that requires a response to preserve profits.
S-L : Stop Loss point or section
S: A point or section where you can buy to make a profit as a support point or section.
(Short-term Stop Loss can be said to be a point where profit and loss can be preserved or additional entry can be made through split trading. It is a short-term investment perspective.)
GAP refers to the difference in prices that occurred when the stock market, CME, and BAKKT exchanges were closed because they are not traded 24 hours a day.
G1 : Closing price when closed
G2: Opening price
(Example) Gap (G1-G2)

STELLAR - Shorts Looking LikelyStellar came down from a massive impulse in the last few months and we are currently in an expanding correction.
Within that expanding correction, we are in an ascending correction which is often a reversal pattern. We could see Stellar revisit the recent lows of 0.2 where we previous had a double bottom.
SHORT IDEA:
Wait for ascending correction to break and enter with stops above 0.302.
Targeting: 0.2
LONG IDEA:
Wait for a bullish break out of that expanding correction. Enter on the first bullflag breakout


Xlm golden cross Xlm always follow xrp so xlm push is coming and this golden cross is screaming it loud.

Ascending Broadening XLMUSD / ETHBTCAs seen on the ETHBTC chart this formation can break out bullishly
We can see the formation on XLM still within the wedge
Will it follow through and break out like ETH/BTC
We shall see through this post

ARIASWAVE MARKET UPDATE - USD\DOW JONES\BITCOIN\STELLAR XLMAs we head towards the end of the month, we can see the tide turning in the US Dollar.
This is important because the US Dollar is the driving factor when it comes to ALL MARKETS .
AriasWave joins the dots and brings you invaluable insights as to where these markets are heading.
As the US Dollar continues to decline in Wave E, it is very obvious that something BIG is brewing under the hood.
This is very apparent using the AriasWave methodology because of what the pattern suggests lies ahead over the next few years.
Markets will become increasingly volatile from this point on due to underlying economic factors that the world will be facing during this time.
I have linked some previous ideas below to help you get up to speed if you are new to AriasWave.
Remember to use Disciplined Money Management Principles to ensure longevity as a trader.
Just remember: I am not a financial advisor, I suggest using this only as a guide. Always do your own research.
If you don't know the long term pattern shouldn't you be doing your research instead of just following the crowd?


Now, XLM Is so cheap. Take the chance!
Dear traders:
XLM has the potential for extraordinary gains.
I think XLM will rocket to a staggering $6 by 2022. Therefore, Stellar Is good for investment.
Now XRP is 0.73 $ and XLM is 0.27 $, fight (face-to-face) is near!
Also, 9 -years analysis is shown in the chart.

XLMJust put this out into my group. Full disclosure this is my 4th attempt to swing trade XLM. I hold of course because it is the best coin IMO but trying to swing has been tricky. Let's see.

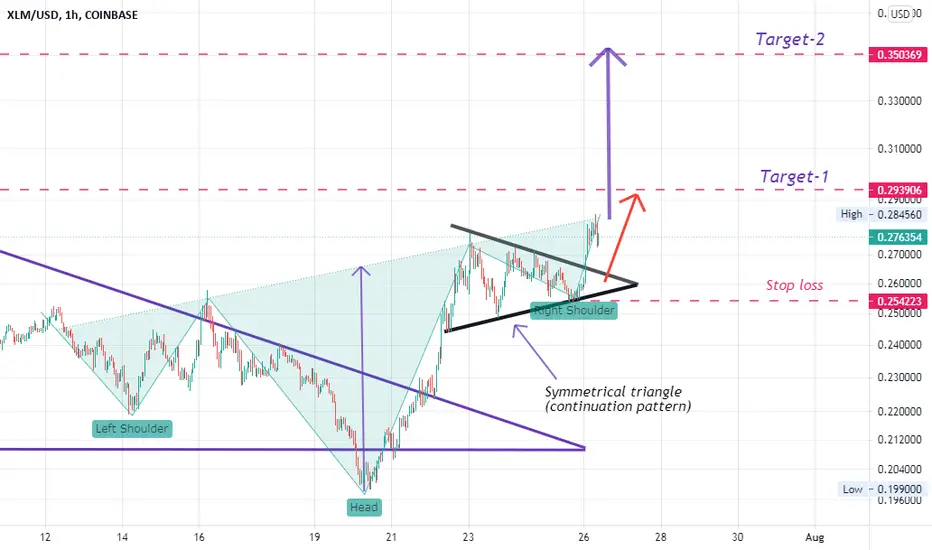
An inverse head and shoulders
Dear traders:
The Inverse Head-And-Shoulder pattern is an example of a bullish reversal pattern.
BULLISH

XLM USD is ready to go higherXlm has found support around 20 cents and short term support above 25 cents
Xlm has seen a massive retracement from the recent high nearly 3x the current price, people were willing to pay 80 cents for it not to long ago so why should you be afraid to buy it at 25 cents? Some of you guys really need to pick a project you can get behind and stick with it instead of chasing these pumps! DCA into a coin you believe in! Don’t miss out chasing things and be caught saying that you knew that was a gem but you were to busy dicking around with sketchy projects to just buy back then what is a small fortune in the future!
Stellar is a very fast moving coin if you look at the history of price is tends to explode upward in a parabolic manner and slowly sell off before the next leg up. I think that next leg up is coming shortly. Stellar has smart contracts on a very fast network with much more decentralization than ripple.
I will be accumulating as much as possible below 50 cents especially around 20 cents. Don’t be surprised if you get caught waiting for a dip and it takes off. I think DCA is the way to go here because of the explosive nature of xlm’s price action.
Checkout my previous analysis on Xlm as well!

Ready to (sudden) Jump
Dear Traders: A possible scenario is shown in the chart.
I think a pump (without any prior notice) is possible (Max Next 24 hours). Now, Stellar (XLM) is on my Watchlist.
Stop-loss is your smart friend, Smart friends make us smarter ;)

Stellar is on the move $XLM #XLMStellar is on the move. After breaking a downtrend, Stellar moves up again. Upcoming resistances and price targets are plotted in the chart.
Currently, due to the increase in the bitcoin range and its movements, all altcoins will be affected by it. The analysis is just a series of probabilities.
I hope you find this analysis useful🌹
Follow for more...
