XLM ; the pamp. the time has come. you animals.XLM ; the pamp. the time has come. you animals.
Gather here ye stellar soldiers. If you kept the faith. You shall be rewarded son.
Let us pray to Jed.
XLMUSD

XLM - Update + Psychological Reminders + Unsubstantiated ClaimsIn this video not only do I give you an update on the current moves.
I also test your rational thinking and make you question, why is it that you think the way you do?
Have you heard of the 4 stages of competence?
You can make all sorts of assumptions by using a myriad of information and tactics.
But when you know what is really going on, that's a game changer.
I even use the Mario game analogy on this one.
Enjoy the video. Keep it real friends.
See related video ideas below.
Remember to use Disciplined Money Management Principles to ensure longevity as a trader.
If you don't know the long term pattern shouldn't you be doing your research instead of just following the crowd?
Just remember: I am not a financial advisor, I suggest using this only as a guide. Always do your own research.

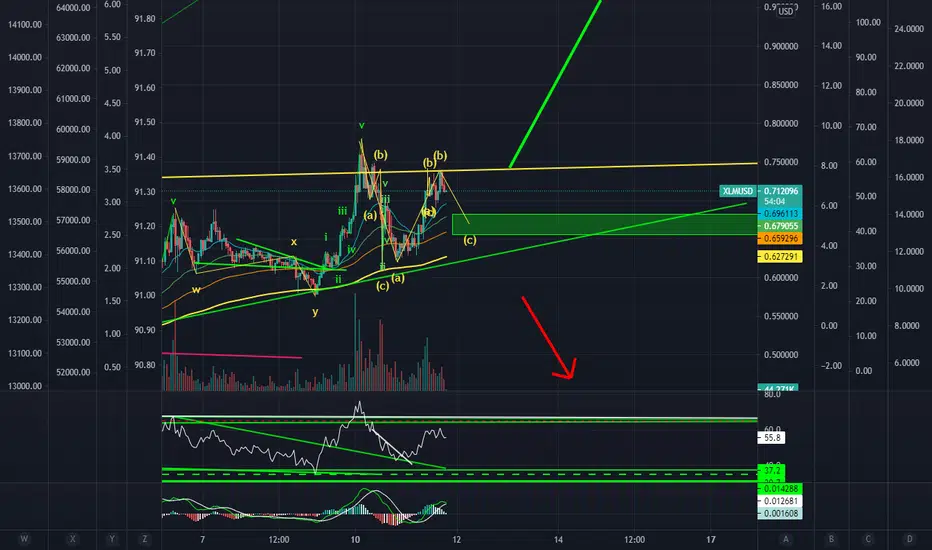
XLMUSD Short-term target of ~0.60 USD. 15th/ 16th of Maya correctional descending triangle parttern which will throw the price to new ATHs.
But, till then, there is a short/ buy opportunity in these few days.


XLMBTC Massive Breakout ImminentStrong Candle through the resistance levels on the weekly, weekly close here would look extremely good. possible small retracement to the 38fib level and a continuation upwards towards 2 targets given. Long term hold for this one. (4-8 weeks). Trade Safe.

XLM - Ease Your Mind - This Is Not A Top - Let Me Explain.Forget the hype, forget the bears and in particular ignore Elon.
Just keep one thing in mind, I live and breathe waves.
My mission objective is to make you learn the 4 stages of competence.
If I prove this Wave (C) is going to $55 please don't be surprised, just realize that there are things you must learn in order to succeed in this field.
Nature will always take it's cause, how much do you understand nature?
Play the game, enjoy yourself. Get burnt a few times. After all that learn the waves.
That's my trading career in a nutshell.
Enjoy the video. Peace.
Remember to use Disciplined Money Management Principles to ensure longevity as a trader.
If you don't know the long term pattern shouldn't you be doing your research instead of just following the crowd?
Just remember: I am not a financial advisor, I suggest using this only as a guide. Always do your own research.

XLM / USDTHello again.
Stellar and Ripple are two successive products. Stellar though slower, doesn't stop following. I think Ripple and Stellar will attract more attention and maintain the upward trend after the environmentalist statements.
Prost .

XLM/BTC now 100% up from our entry zone congrats guys#XLM/BTC Profit Update:-
#XLMBTC currently trading at 1400 Satoshi
And hope you are enjoying my signals.
106% pure profit from entry after market dump also #XLM in green zone.
Entry:- 690 Satoshi
TP1:- 794 Satoshi ✅
TP2:- 878 Satoshi ✅
TP3:- 993 Satoshi ✅
TP4:- 1453 almost done went upto 1413 Satoshi
Still I am expecting from #XLM
I can expect 2000/3000 Satoshi
But only hold profit not try to hold 100% positions.
Always book profit partially time to time.
🚨:- This analysis is not for fresh entry.
Support:- 1300/1200/1000 Satoshi
Resistance:- 1453/2000/3000 Satoshi
Please click like button and Appreciate my hard work.
Must follow me for latest crypto real time updates.

XLMBTC breakoutXLMBTC breaks out from the 2 years long consolidation, it's an easy 2x play buying from current levels
(Rectangles tends to not only fulfill but double or even triple depending on how long the consolidation phase it had)
###NOT FINANCIAL ADVICE###


STELLAR - Purple War Zone!STELLAR rejected the upper red trendline ... WHAT NEXT?
XLM is overall bullish trading inside our red channel so we will be looking for Trend-Following Buy setups as it approaches the lower red trendline.
Moreover, the 0.5 in blue is a strong round number.
So the highlighted purple circle with the blue arrow is a very strong area to look for buy setups as it is the intersection of 0.5 round number and lower red trendline.
As per my trading style:
I will be waiting for XLM to approach the highlighted purple circle (area) to look for possible buy setups (like a double bottom, trendline break, and so on...)
Always follow your trading plan regarding entry, risk management, and trade management.
Good luck!
All Strategies Are Good; If Managed Properly!
~Rich

XLM - Corrections Take Time - But We Can Make Sense Of ThemIn this video I give you the daily update and if it is not daily that means not much happened prior to that.
Here we are seeing what could potentially be the do or die moment for this count.
Let's see how it pans out.
If you don't know the long term pattern shouldn't you be doing your research instead of just following the crowd?
Just remember: I am not a financial advisor, I suggest using this only as a guide. Always do your own research.


XRP ARE YOU READY FOR THE NEXT CURRENCY ?? YEAH I AM STRONG BUYY XRP 1.40-1.50
TARGET PRICE $3.0 IN 3 MONTHS
DO YOUR RESEARCH
NOT AN ADVICE JUST A VETERAN TRADER

XLMUSDT UPDATE!!!! Hi Traders,
XLM is currently very much in a bullish channel. The way it currently looks its set for new all time highs very soon. We will look for support in either of the confluence zones drawn on the chart. Increasing buy side volume can also been seen which is a good indication for prices to break out higher.
As always if you enjoy the content don't forget to click the like button and make a comment on your opinion.
Thanks
MS
⬇️⬇️⬇️⬇️⬇️⬇️⬇️⬇️⬇️⬇️⬇️⬇️⬇️⬇️⬇️⬇️⬇️⬇️⬇️⬇️⬇️⬇️⬇️⬇️⬇️⬇️⬇️⬇️⬇️⬇️⬇️⬇️⬇️⬇️⬇️⬇️⬇️⬇️⬇️⬇️⬇️⬇️⬇️⬇️⬇️⬇️⬇️⬇️⬇️⬇️⬇️⬇️⬇️⬇️⬇️⬇️⬇️⬇️⬇️⬇️⬇️⬇️⬇️⬇️⬇️⬇️⬇️⬇️⬇️

Altcoins Update: Stellar LumensVolume and Price action shows:
Target 1: 1.18
Target 2: 2.2
Target 3: 5.4
P.S: Anything I say or do, should always be taken with a pinch of doubt. You might make or lose money based on my opinion, but you are solely responsible for your own actions. I am not your financial advisor!

XLMUSD H16: BEST Level to BUY/HOLD 140% gains(SL/TP)(NEW)Why get subbed to me on Tradingview?
-TOP author on TradingView
-15+ years experience in markets
-Professional chart break downs
-Supply/Demand Zones
-TD9 counts / combo review
-Key S/R levels
-No junk on my charts
-Frequent updates
-Covering FX/crypto/US stocks
-24/7 uptime so constant updates
-setups that make money no fluke
XLMUSD H16: BEST Level to BUY/HOLD 140% gains(SL/TP)(NEW)
IMPORTANT NOTE: speculative setup. do your own
due dill. use STOP LOSS. don't overleverage.
🔸 Summary and potential trade setup
::: XLMUSD 16hour/candle chart review
::: sequence of higher lows - BULLISH
::: chart looks good /strong
::: price contained within bullish channel
::: speculative bullish setup in progress
::: two primary options for BULLS
::: BUY at market and/or
::: focus on buying 10-20% dips later
::: BULLS seek to BUY/HOLD exit +140%
::: 140% gains BUY/HOLD setup
::: exit near point D +140% gains
::: BULLS got a cycle low at point C
::: and BUY/HOLD after pullback
::: BULLS get ready to BUY near C
::: TP bulls is +140% gains later
::: exit near point D +140% gains
::: expecting re-test of heavy resistance
::: details: see chart
::: FINAL TP is +140% gains
::: recommended strategy: BUY/HOLD 10-20% dips
::: recommended strategy: BUY DIPS/PULLBACKS
::: TP BULLS +140% gains
::: SWING TRADE: BUY/HOLD IT
::: bull run not over yet
::: good luck traders!
::: BUY IT and get paid. period.
🔸 Supply/Demand Zones
::: N/A
::: N/A
🔸 Other noteworthy technicals/fundies
::: TD9 /Combo update: N/A
::: Sentiment mid-term: BULLS
::: Sentiment short-term: BULLS
RISK DISCLAIMER:
Trading Crypto, Futures , Forex, CFDs and Stocks involves a risk of loss.
Please consider carefully if such trading is appropriate for you.
Past performance is not indicative of future results.
Always limit your leverage and use tight stop loss.

Possible pullback in progress.Looks like we might get another little pullback, but I wouldn't be worried.
I'm gonna give it tonight and maybe tomorrow, we'll see how quick it plays out. If you look at the long term tops, we're right up on that resistance trying to break through. I think we hit that yellow line once or twice and then we'll see some +50% days.
Just my opinion though...
XLM BULLISH ideaAfter the bearish trend due to the previous price breakout XML is forming a new UPtrend
Price got rejected at the 0.786 fibonacci level forming a bullish divergence
RSI level is ~50 leaving still much space to grow futher
Nice parabolic formation pretty similar to the previus one.
I am BULLISH about XLM thinking we are going to repeat a parabolic movement , at this point we may be at the yellow marked zone

XLMUSD-Our turtle has turned into a rabbit!Our turtle (XLM) Reach our previous target ()
and has turned into a rabbit!
If the wolf ( BTC dip) does not scare our rabbit, it can become a leopard and return itself to top 10 in just a few steps 👀
First target is 0.87-0.93$
Stop loss: under 0.60 to 0.62500
****This is just an idea, not a financial advisor*****

XLM PREPARING FOR TAKE OFF STRONG BUYY WITH TARGET PRICE $5STELLAR LUMEN Is A BRIDGING CURRENCY DESIGN FOR EMERGING MARKETS who is in DIRE NEEDS FOR BETTER EXCHANGE RATE against USD and againts OTHER COUNTRIES
WITH UKRAINE GOVERNMENT ADOPTING STELLAR TO DEVELOP THEIR OWN NATION DIGITAL CURRENCY
THIS PROOF THAT STELLAR HAS THE WORLD to back her up
STELLAR in the most promising Crypto and i would keep pushing this until $5 achieved
MY YOUTUBE ; INDO Sydney

XLM - This Could Potentially Be The Small Degree Count...This is a follow-up chart to the video idea I posted moments ago titled: XLM - About To Fly High In A Short Amount Of Time
I have linked this video idea below in related ideas.
Assuming we are seeing this Wave ii correction nearing completion early than previous thought...
A break of the last high at around .77cents would be confirmation that we are about to see a third-of-a-third wave unfold.
This is a very interesting point in time given that I expect XLM to head straight up towards $55 USD.
Remember to use Disciplined Money Management Principles to ensure longevity as a trader.
If you don't know the long term pattern shouldn't you be doing your research instead of just following the crowd?
Just remember: I am not a financial advisor, I suggest using this only as a guide. Always do your own research.

XLM - About To Fly High In A Short Amount Of Time.In this video I bring you the STRUSDT chart which was recommended by one of my loyal followers.
Here I break it down right from the beginning in a very clear and concise manner.
I spend a lot of time thinking about waves at different times of the day with different states of mind because it stimulates creative thinking.
The truth is that there can only truly be one correct count, the trick is to track it as it happens.
We all know hindsight Harry is great and knows everything about the charts but he is usually late to the party.
Everything happens for a reason which is why you should always keep an open mind.
Always admit when you're wrong because it helps eliminate unnecessary mental blocks in your quest to find that one true count before it's too late.
Remember to use Disciplined Money Management Principles to ensure longevity as a trader.
If you don't know the long term pattern shouldn't you be doing your research instead of just following the crowd?
Just remember: I am not a financial advisor, I suggest using this only as a guide. Always do your own research.
