Xlmusdlong
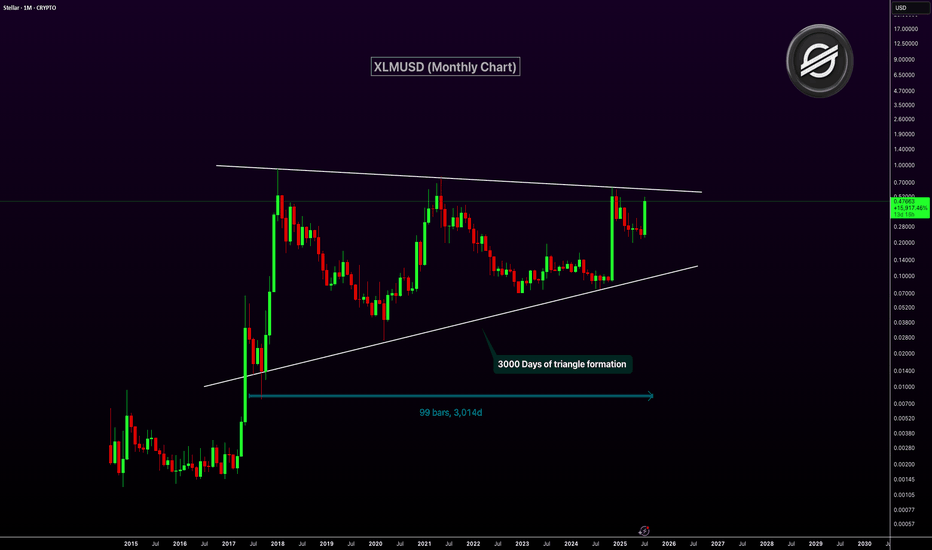
XLMUSD Nearing Breakout After 3,000-Day Triangle FormationXLM has been consolidating inside a massive symmetrical triangle for over 3,000 days. This long-term pattern on the monthly chart dates back to 2017. The price is now approaching the upper resistance trendline of the triangle. A breakout from this structure could ignite a major bullish rally.
The current monthly candle shows strong momentum with over 100% gains. A confirmed breakout above resistance could mark the start of a macro uptrend. This triangle is one of the most significant technical setups in XLM’s history.
Target 1: $1.00
Target 2: $2.50
Target 3: $5.00
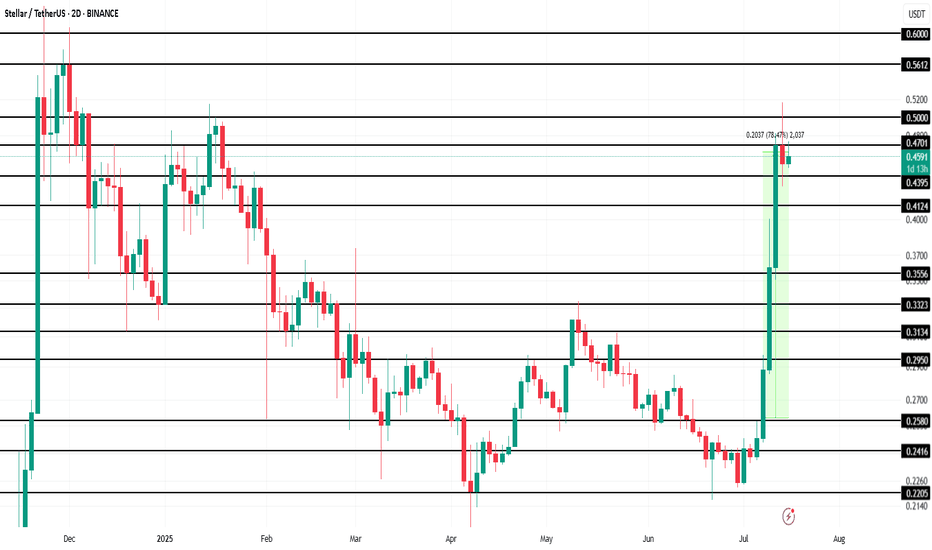
Stellar (XLM) Makes History Amid 78% Price Surge This WeekBINANCE:XLMUSDT is currently trading at $0.46, up 78.5% over the past week . However, the altcoin faces resistance at $0.47, a level it has struggled to breach in recent days. The ability to break this resistance is crucial for continued growth, as it will determine whether XLM can push higher.
BINANCE:XLMUSDT futures market activity has also surged, with Futures Open Interest hitting an all-time high of $520 million in the last 24 hours. This indicates that traders are increasingly interested in the asset's derivatives, which are capitalizing on its rise.
Given the strong sentiment from futures traders and the technical indicators, it is likely that BINANCE:XLMUSDT will push past the $0.47 resistance and target $0.50 in the coming days . A successful breakthrough could lead XLM toward its next target at $0.56, marking an eight-month high. This would signify continued strength for the asset.
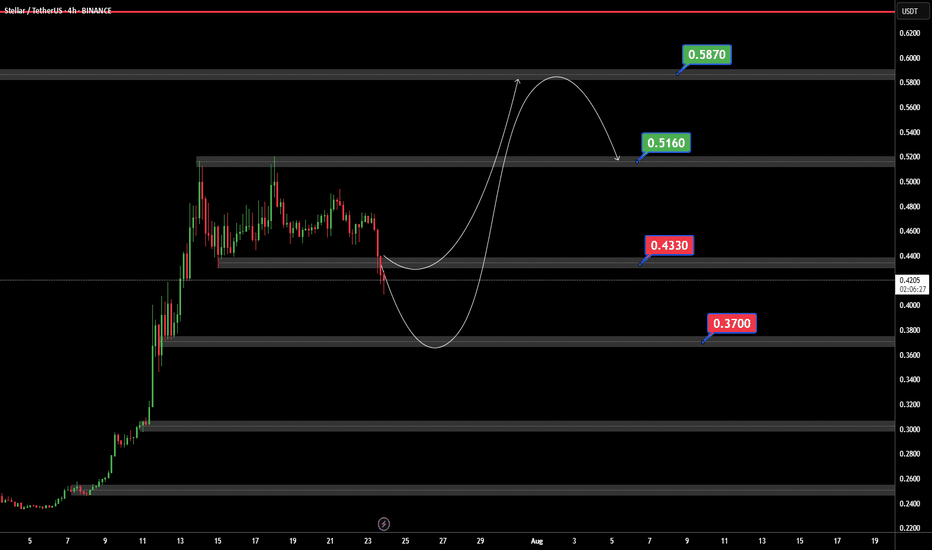
However, if the broader market sentiment shifts or investors begin to sell their holdings, BINANCE:XLMUSDT could face a significant pullback. If the price falls below the key support levels of $0.43 and $0.41 , it could slide further to $0.35, which would invalidate the current bullish outlook.
XLM Is About to Trap Thousands of Traders ?Yello Paradisers are you prepared for the next major move on XLM, or are you walking straight into the bull trap? We’re now approaching a critical decision point on XLMUSD that could shake out a lot of traders who are only reacting instead of planning. Here's exactly how we're playing it, step by step.
💎#XLMUSDT is currently trading inside a descending channel. As of now, we see a high-probability scenario where the price gets rejected from the descending resistance, setting up an ideal short opportunity with the current structure still favoring sellers. Should this rejection play out, we expect a breakdown of the moderate support level, with our target set at the $0.1970 zone.
💎Adding more weight to this bearish outlook is the fact that XLM is trading below both the 50 EMA and 200 EMA. This technical alignment confirms broader weakness in the trend and reinforces that any breakout attempts at this stage are likely to be reactive rather than sustainable simply small retracements within a dominant bearish macro setup.
💎However, if price fails to respect the descending resistance and pushes higher, our next major decision area is the supply zone at $0.2537. At that point, as always, we’ll wait with full discipline for confirmation. We’ll be watching closely for clear bearish reversal patterns, such as an Evening Star or a Shooting Star, before taking action. Only a strong and confirmed breakout above the $0.2537 level would invalidate our bearish outlook and shift the market structure into bullish territory.
Stay focused, Paradisers. Be the hunter, not the hunted.
MyCryptoParadise
iFeel the success🌴
XLM short termHello
this time I am posting a short term idea (few days to few weeks).
After explosion in Q4 of 2024 XLM has formed a downtrending channel which can potentially turn into a bull flag.
Currently XLM price is sitting at a bottom of this channel.
Short term traders can look to purchase some XLM now and wait till it comes towards the top of the channel to sell and get some profit. If it reaches top of the channel potential is 50% price increase.
If the market turns bullish in next few days to weeks XLM might even break upwards out of this bull flag but do not count on it just yet.
This idea is somewhat risky so proceed with extreme caution and with tight stop-loss below the channel.
Good luck.
XLMUSDT Weekly LONG This is a weekly technical analysis for educational purposes on XLMUSDT. I believe that Stellar will find new higher high levels in the middle of the 2025 Bull Season.
As I mentioned before on my ALGOUSDT Weekly Analysis ;
"Considering the global economic crisis, the technical recession in the United States, the suppression of gold and other commodities, the real estate and unemployment crisis in China, and the European Union countries' struggle with inflation, I believe that market makers (the bulls) may create a false FOMO (Fear of Missing Out) during the 2024 BTC halving period, potentially driving BTC to levels of perhaps 50K+ before ending the year 2024 around the 20-25K range. When we consider the global effects, the real bull season is likely to occur between 2025 and 2026.
Reaching 100K in Bitcoin by 2024 wouldn't make much sense if most people don't have the financial means. It's important to remember that patient wealthy individuals often capitalize on the impatience of those with fewer resources. (let's say poors with high dreams) Those with limited means may not have the capital to participate in the market for couple of years.
This is not "clever riches profit from the idiot riches game". Never was. I believe.
I may be wrong, :)
Regards,
XLMUSD - Weekly forecast, Technical Analysis & Trading IdeasMidterm forecast:
0.1625 is a major support, while this level is not broken, the Midterm wave will be uptrend.
Technical analysis:
A trough is formed in daily chart at 0.3030 on 02/09/2025, so more gains to resistance(s) 0.3552, 0.3875, 0.4521 and more heights is expected.
Take Profits:
0.3552
0.3875
0.4521
0.4965
0.5602
0.6080
0.6905
0.7975
__________________________________________
❤️ If you find this helpful and want more FREE forecasts in TradingView,
. . . . . Please show your support back,
. . . . . . . . Hit the 👍 BOOST button,
. . . . . . . . . . . Drop some feedback below in the comment!
🙏 Your Support is appreciated!
Let us know how you see this opportunity and forecast.
Have a successful week,
ForecastCity Support Team
#XLM/USDT Ready to go higher#XLM
The price is moving in a descending channel on the 1-hour frame and sticking to it well
We have a bounce from the lower limit of the descending channel, this support is at 0.4300
We have a downtrend on the RSI indicator that is about to be broken, which supports the rise
We have a trend to stabilize above the moving average 100
Entry price 0.4434
First target 0.4590
Second target 0.4746
Third target 0.4927
xlm long!"🌟 Welcome to Golden Candle! 🌟
We're a team of 📈 passionate traders 📉 who love sharing our 🔍 technical analysis insights 🔎 with the TradingView community. 🌎
Our goal is to provide 💡 valuable perspectives 💡 on market trends and patterns, but 🚫 please note that our analyses are not intended as buy or sell recommendations. 🚫
Instead, they reflect our own 💭 personal attitudes and thoughts. 💭
Follow along and 📚 learn 📚 from our analyses! 📊💡"
Be patient with XLMUSD, it's time will comeHello everyone,
today I choose to talk about XLM.
Many consider it a dead coin, since it did not make a new ATH in 2021. But I prefer trading with verified coins that have been around for long enough to establish patterns in their charts. And I trade based on these patterns.
This is a weekly chart of XLMUSD.
It is one of the sleepiest coins. But when it wakes up, it is a rocket.
How to read my chart:
- When XLM is in bull market, it respects 21 weekly EMA -> price action above it. (arrow up)
- When XLM is in bear market, it respects 21 weekly EMA -> price action below it.
- In accumulation, price action plays with 21 weekly EMA, goes above it then below, then again above it, and below... (rectangle)
Sure, this does not help, right. How could you know if we are still playing with 21 weekly EMA or is this cross above start of parabolic rise. Well, the answer lies in RSI.
XLM goes parabolic once weekly RSI crosses above 70 (circle). We are not there yet so I do not expect fireworks tomorrow. Remember, XLM is one of the last ALTs in the bull run to wake up, that is why its bull runs are so violent. Because once it wakes up it makes up for all the sleeping in matter of few weeks.
More info on XLM:
- XLM created its base (red line). It has respected it since 2018. It has touched it in 2023 and 2024.
- People think XLM slept through 2023 bull run and hence is dead. But the fact is that the 2023 bull run is still not over and XLM will mark the end of it with its parabolic run.
I have started to slopwly accumulate XLM with the money gained from BTC and other ALTs that have already surged.
XLM potential is from 5x to 15x. You choose and determine where you want to take profit. BUT MAKE SURE TO TAKE THE PROFIT!
And remember: If you buy low, you do not need coin to break ATH to make substantial amount of money. Buying price is much more important then selling price.
Good luck.
P.S. Check my other posts. If you find value in my ideas, boost and share them.
If you want to stay notified, follow me.
#XLM/USDT#XLM
The price moves in an inverted head and shoulders pattern
The right shoulder is now complete
Wall is expected for the upper border of the shoulder
We have a higher stability moving average of 100
We have bullish momentum on the RSI and an uptrend
We have a current breakout of the channel to the upside
Entry price is 0.2500
The first target is 0.3000
The second target is 0.3500
The third goal is 0.4000
#XLM/USDT#XLM
The price is moving in a descending channel on the 1-hour frame and is holding it tightly and is about to break out to the upside
We have a bounce from the lower limit of the channel at 0.0900
We have a bearish trend of the RSI that is about to break out, which supports the upside
We have a trend to stabilize above the 100 moving average
Entry price 0.900
First target 0.0920
Second target 0.0988
Third target 0.1031
XLMUSDT.P 4H - Double Bottom - Consolidation - FlyingXLMUSDT.P 4H - Double Bottom - Consolidation - Flying
I think it's easy to understand XLM's momentum. After making a DOUBLE BOTTOM again, it is consolidating the price at higher levels to, surely, raise its price.
LEVELS:
SL: 0.0850
TP1: 0.1133
TP2: 0.1633
TP3: 0.1975
As always, we must design a strategy to safeguard our investments that have clearly defined Stop Loss.
These strategic alternatives can be configured with TradeX BoT, since it allows positioning in both directions without having to block any amount per position. It will only be necessary for the conditions to be met, so that the orders are executed in one direction or another, taking the necessary tokens from your wallet.
TradeX BoT (in development): Tool to automate trading strategies designed in TradingView. It works with both indicators and graphic design tools: parallel channels, trend lines, supports, resistances... It allows you to easily establish SL (%), TP (%), SL Trailing... multiple strategies in different values, simultaneous BUY-SELL orders, conditional orders.
This tool is in the development process and the BETA will soon be ready for testing.
FOLLOW ME and I will keep you informed of the progress we make.
I share with you my technical analysis assessments on certain values that I follow as part of the strategies I design for my portfolio, but I do not recommend anyone to operate based on these indicators. Inform yourself, train yourself and build your own strategies when investing. I only hope that my comments help you on your own path :)
Long Position on XLMUSDT / Volume ProjectionBINANCE:XLMUSDT
COINBASE:XLMUSD
SL2 ---> Mid-risk status: 5x-8x Leverage
SL1 ---> Low-risk status: 3x-4x Leverage
👾The setup is active but expect the uncertain phase as well.
⚡️TP:
0.1045
0.1055
0.1070
0.1085
0.1100
0.01112(In Optimistic Scenario)
➡️SL:
0.0977
0.0955
🧐 The Alternate scenario:
🔴If the price stabilizes below the trigger zone, the setup will be cancelled.
XLM (Stellar) Technical Analysis and Trade Idea 📈🚀Taking a comprehensive view of XLM (Stellar) , we observe a prevailing bullish trend, particularly evident when analyzing the weekly charts. Although there was a recent minor downturn, the daily chart exhibited bearish movements. However, the overall sentiment is optimistic once again. Notably, we’ve identified bullish price action—a decisive break in market structure on the 4-hour timeframe—which could potentially shift the 4-hour trend to bearish in trhe short term before it continueds bullish. In our video, we delve into trend analysis, explore price action dynamics, dissect market structure, and introduce key technical analysis concepts. Toward the video’s conclusion, we present a trade idea. It’s essential to emphasize that this information serves educational purposes only and should not be construed as financial advice. 📈🚀📊
#XLM/USDT#XLM
The price broke the downward channel and began to rise after breaking the downtrend with oversold saturation
The current price is 0.12800
Initial target 0.1328
A restriction that results in a correction in the price and then goes to
The second target is 0.14460
Then the third target is 0.16930
This rise is supported by oversold conditions


