This Move Of Stellar Lumens XLM Can Be A Confirmation Of AnotherHi friends hope you are well and welcome to the new update on Stellar.
Broke down the channel and H & S:
On a 4-hour time frame, XLM formed a down channel and during the movement within the channel, the priceline also formed a Head & Shoulder pattern. Finally, XLM broke down the neckline of H & S and the support of the channel.
The target for the Head & Shoulder pattern to the downside was $0.15 and the price action even moved lower than this target. Right now the pricline line is moving up and if it will be rejected by
the support of the channel (which is now working as a resistance) then it can set another lower low.
Short-term support and resistance levels.
On a 1-hour time frame, there is $0.14 support and the priceline has bounced from there and now moving between the $0.15 support and $0.16 resistance levels. If it breaks out $0.16 the next
resistance levels will be $0.17 and then $0.18.
Huge falling wedge:
On a weekly view, Stellar has formed a huge falling wedge pattern and now moving down to the support of this pattern. If XLM tests the support of the wedge then it can drop at $0.12. But after
testing the support a big reversal move is possible.
Conclusion:
On a smaller time frame, If the priceline will not be able to breakout the support of the channel as resistance, then the next move can be $0.12. But on a bigger view, after testing the support of the wedge big bullish reversal will be started.
Xlmusdlong

This Is Why Stellar Lumens XLM Should Be Your Top PickHey friends hope you are well, and welcome to the new update on Stellar coin.
Breaks down significant support:
On a weekly time frame XLM is breaking down a very significant support of $0.16. This $0.16 level has been working as strong support and resistance since Mar 2018. Now the next major
support will be at $0.12.
Broke down channel and H & S:
On a 4-hr time frame, XLM has broken down a down channel and a Head & Shoulder pattern as well. The target to the downside for H & S pattern was $0.15 and XLM has reached there.
XLM might test the support of big wedge:
On a monthly time frame, XLM is moving in a huge falling wedge pattern. Now after breaking down $0.16 support, it is possible that Stellar may retest the support of this wedge.
We should remember that previously when stellar broke out a huge channel we had around 1400% move and from the low to the high, that was about 3000% rally. Same is the previous move XLM can start another massive rally after breaking out this new falling wedge.
Conclusion:
Ona bigger time frames, stellar is moving in a falling wedge pattern, which is considered to be a bullish biased. Therefore, there is a high probability that after testing the support of
this wedge, XLM once again starts a long-term bull run.

Stellar Lumens XLM Dumped Once Again But Still Has Big PotentialHi friends hope you are well and welcome to the new update on XLM:
Fake out:
On a 4-hr time frame, a few hours back XLM was breaking out the down channel but infact it was a fake out. Because, after breaking out while re-testing the previous resistance of channel as support stellar has re-entered the same channel.
Long-term support zone:
Now there is a long-term support zone that starts from $0.18 and goes to $0.16. Right now priceline of Stellars is moving in this zone. This support area has been working as strong support and resistance since Mar 2018.
Huge wedge formation:
On the monthly time frame, there is a huge falling wedge has been formed. Previously in the same time frame, XLM broke out a big channel and started a big bull run. Therefore, after breaking out the current wedge we can expect the same move.
Conclusion:
On the short term, there is a sell-off, but in the long-term XLM has a huge potential to start a massive move.
Note: Above idea is for educational purpose only.

💡Don't miss the great buy opportunity in XLMUSD @StellarOrgTrading suggestion:
". There is a possibility of temporary retracement to the suggested support line (0.1995).
. if so, traders can set orders based on Price Action and expect to reach short-term targets."
Technical analysis:
. XLMUSD is in a range bound, and the beginning of an uptrend is expected.
. The price is below the 21-Day WEMA, which acts as a dynamic resistance.
. The RSI is at 58.
Take Profits:
TP1= @ 0.2062
TP2= @ 0.2122
TP3= @ 0.2187
TP4= @ 0.2265
TP5= @ 0.2342
SL= Break below S2
❤️ If you find this helpful and want more FREE forecasts in TradingView
. . . . . Please show your support back,
. . . . . . . . Hit the 👍 LIKE button,
. . . . . . . . . . Drop some feedback below in the comment!
❤️ Your support is very much 🙏 appreciated! ❤️
💎 Want us to help you become a better Forex / Crypto trader ?
Now, It's your turn !
Be sure to leave a comment; let us know how you see this opportunity and forecast.
Trade well, ❤️
ForecastCity English Support Team ❤️

XLM LONG POSITION SHORT TERMWe just bounced off of a strong demand zone, XLM has a strong correlation with XRP and since XRP is rising we are expected to see XLM rise as well, Our targets are at liquidation zones that market made by going down.
Indicators:
AROON: Already is showing strong bullish momentum
EMA: We just crossed 50 EMA zone that shows bullish momentum
Bollinger bands: We bounced off of a bottom Bollinger band.
Entry: 0.206510
Invalidation: 0.160401
Target 1: 0.257
Target 2: 0.3064

xlm looking good xlm is looking great to accumulate down here,
could potentially be close to breaking the down trend

Final Moments To Catch Stellar Lumens XLM At This SupportHi friends, hope you are well, and welcome to the new update on XLM.
Falling wedge:
On a daily time frame, XLM is bounced from the support of falling wedge pattern with bullish divergence.
Broke out broadening wedge and a re-test:
On a 4-hr time frame, Stellar broke out the resistance of a broadening wedge. Now the priceline is testing the resistance of this wedge as support. There is also a 50 simple moving average support as well.
Tested strong support:
On a weekly time frame, XLM has already tested the $0.18 support and is also likely to form a double bottom as well. Once the priceline will be able to breakout the resistance of the falling wedge
which is formed on a daily time frame then it can reach the big resistance of $0.44.
Conclusion:
If XLM successfully re-tests the resistance of broadening wedge as support and starts a bullish reversal move from here, then there will be a high probability for the breakout from the falling wedge as well.

Stellar XLMUSDT THE BEST TIME TO BUY I think stellar bullish around @0.12 target 4$ at September
Buy @ 0.12
Target @ 4 $
Stop out 0.07

XLMBTCXLM shows a very good chart and I think we can trust XLM and publicly we see a positive movement in the coming days

xlmusdt is good for quick profit xlm didn't run last few months and it's now at a good point where you can buy and hold for the next few days I am expecting the coming month xlm could test 1$ easy
buy and sell targets are on the chart
if you like this idea please like and share thank you

XLM BIG MOVE LOADING📉📉📉Expect bullish price action on this coin as price takes out liquidit below 0.25000 and consolidates above with bullish momentum on the d1, we should go way above 0.3500 if momentum keeps building.
What do you think ? Comment below..

Stellar flag pattern breakoutEasiest long of my life, blue lines are a flag pattern, I will be using this for my conviction, if we form a lower low and breakout of the corrective channel then I will be bearish (red) otherwise my thesis is bullish (green) using green resist as support would be #1 for bulls

XLM Key LevelIf XLM price breakdown the purple support, XLM will go to 0.1616-0.1200, this area will be a very good price to entry long, better we wait XLM at 0.1616-0.12 to entry, I don't recommend you to make short position

XLM CLEAR BREAKOUT INCOMING WATCH NEXT DAILY OPENif you are looking to short or long XLM here is your chance were in a rising channel which is usually a bullish sign but with the bearishness of the market you may want to look for a short... Either way here are key support and resist lines as well as how I expect and bearish scenario (red) and a bullish scenario (blue) to play out

Xlm curve longBeen watching this coin for a long time it has been on a downtrend against btc for pretty much its whole existence however it could pick up some weight here against btc on this curve, id watch this one for the next week because in my opinion were going up huge.


💡Don't miss the great buy opportunity in XLMUSD @StellarOrgTrading suggestion:
". There is a possibility of temporary retracement to the suggested support line (0.3453).
. if so, traders can set orders based on Price Action and expect to reach short-term targets."
Technical analysis:
. XLMUSD is in a range bound, and the beginning of an uptrend is expected.
. The price is above the 21-Day WEMA, which acts as a dynamic support.
. The RSI is at 69.
Take Profits:
TP1= @ 0.3686
TP2= @ 0.3926
TP3= @ 0.4175
TP4= @ 0.4409
TP5= @ 0.4672
SL= Break below S2
❤️ If you find this helpful and want more FREE forecasts in TradingView
. . . . . Please show your support back,
. . . . . . . . Hit the 👍 LIKE button,
. . . . . . . . . . Drop some feedback below in the comment!
❤️ Your support is very much 🙏 appreciated!❤️
💎 Want us to help you become a better Forex / Crypto trader?
Now, It's your turn!
Be sure to leave a comment; let us know how you see this opportunity and forecast.
Trade well, ❤️
ForecastCity English Support Team ❤️

💡Don't miss the great buy opportunity in XLMUSD @StellarOrgTrading suggestion:
". There is a possibility of temporary retracement to the suggested support line (0.3453).
. if so, traders can set orders based on Price Action and expect to reach short-term targets."
Technical analysis:
. XLMUSD is in a range bound, and the beginning of an uptrend is expected.
. The price is above the 21-Day WEMA, which acts as a dynamic support.
. The RSI is at 69.
Take Profits:
TP1= @ 0.3686
TP2= @ 0.3926
TP3= @ 0.4175
TP4= @ 0.4409
TP5= @ 0.4672
SL= Break below S2
❤️ If you find this helpful and want more FREE forecasts in TradingView
. . . . . Please show your support back,
. . . . . . . . Hit the 👍 LIKE button,
. . . . . . . . . . Drop some feedback below in the comment!
❤️ Your support is very much 🙏 appreciated! ❤️
💎 Want us to help you become a better Forex / Crypto trader ?
Now, It's your turn !
Be sure to leave a comment; let us know how you see this opportunity and forecast.
Trade well, ❤️
ForecastCity English Support Team ❤️

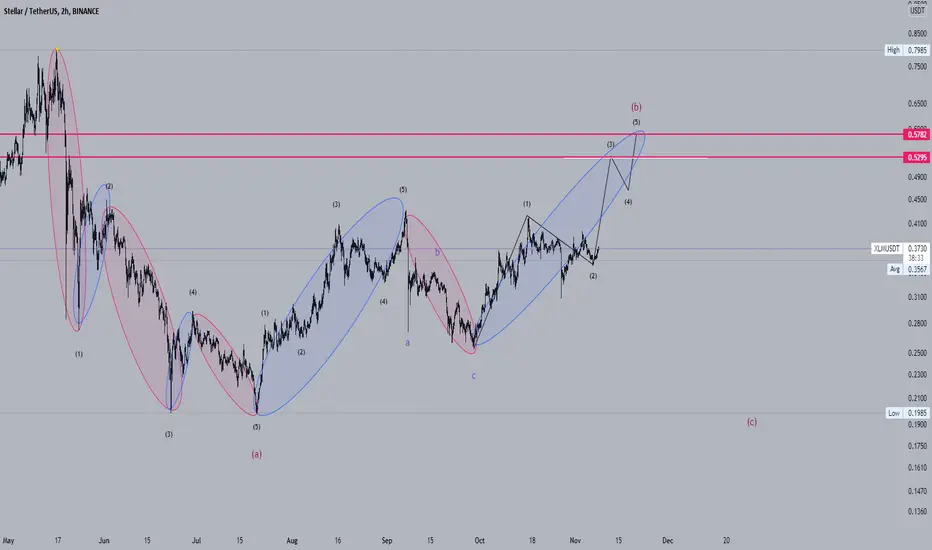
$XLM Head & Shoulders+ Reversal Head & Shoulders
+ bulllish pattern (if breakout)
+
Targets :
TP1 : 0.5095 (30%)
TP2 : 0.6374 (60%)
TP3 : 0.77-ATH (100%)
SL : Daily close below 0.3300

Stellar Analysis XLMUSDAn analysis for XLMUSD using Gann and Fibonacci circle
The fib circle shows a clear passage through 2.618 following a previous rejection at this level (red arrow), this could lead to a breakout
The gann portrays the length of the bear and current bull run
Price is also sitting right above 0.618, which is established from the previous ATH
We still have some steam (steem) left in the tank for the bull run
Happy trading

XLM inside Falling Wedge PatternXLM is inside the Falling Wedge pattern, better we wait for a breakout from the pattern to minimize the risk, the yellow support is strong support from weekly price action, and the resistance too

XLMUSDT - Enjoy 🚀🚀🚀 (1H Signal) Follow me, its good IDEA :)
Now XLM is very interesting for a little time frame scalping. (1,5,15m)
for a long position we need hard confirmation for a trend.
Please share your opinion in the comments
This is not financial advice !!!