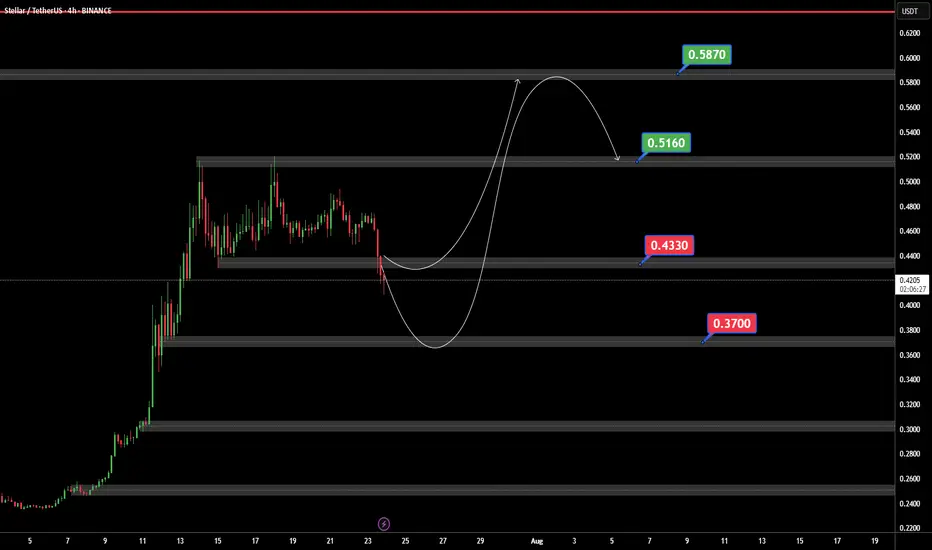
XLMUSDTIf BINANCE:XLMUSDT can support 0.4430 $ ready for jump to 0.5160 and best target in 0.5873 $.
But if XLM can price breaked 0.4330$ support we ready for a bear trend.
Xlmusdtechnicalanalysis
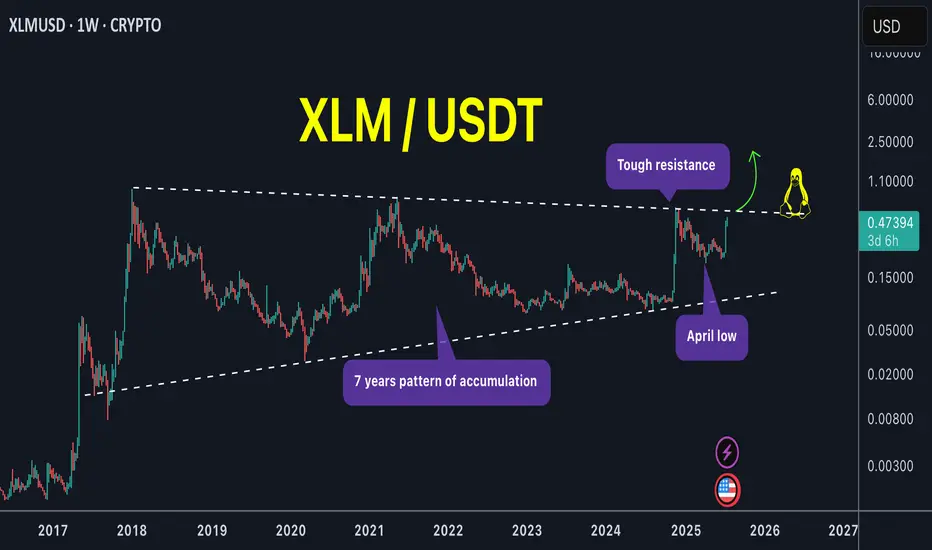
XLM is the pump over or just getting started !XLM / USDT
What a huge weekly candle! We catched its strong move very early around 0.29$ a week ago (75% profits locked in spot)
With a zoom out chart we can see price is setting up nicely with several tests of pattern boundary. Next test of the upper boundary can lead to huge breakout of this mega pattern !
NOTE: Price must not close below april low and should close above upper boundary unless that its just a range
Keep an eye on it closely !
$XLM/USDT Breakout Alert: 80% Move on the Table?CRYPTOCAP:XLM just broke out of its downtrend after months of being stuck in a falling channel.
The breakout came with a strong 12% pump, and price is now holding above both the trendline and the 40MA, a solid bullish sign.
If this move holds, we could see XLM push toward the $0.4540 zone (that’s nearly 80% up).
A quick retest around $0.2646 might be the next best entry.

XLM Breakout Alert – Hidden Gem About to Explode?XLM/USDT is showing signs of a potential breakout from a long-term descending trendline that has been in play since November 2024. Price recently rebounded from a key demand zone (highlighted in yellow), suggesting strong buying interest at lower levels.
📉 Descending Trendline Resistance
The pair has consistently respected a strong downward trendline, rejecting all breakout attempts—until now. Price action is tightening near the apex, increasing the probability of an upward breakout.
🟨 Key Demand Zone
The $0.2150 - $0.2410 area has proven to be a strong accumulation zone, providing a solid foundation for a potential reversal. Price has shown multiple bullish reactions from this area.
📈 Upside Targets Upon Breakout Confirmation: If a confirmed breakout occurs, the following resistance levels can serve as potential profit-taking targets:
$0.2573 (breakout confirmation zone)
$0.3040
$0.3512
$0.4903
$0.5603
📌 Ideal Scenario:
Potential long entry after a confirmed breakout and retest of the trendline (~$0.25 - $0.26)
Stop loss below the demand zone (~$0.2150)
Attractive risk-to-reward setup with minimum 30% upside potential.
⚠️ Note: Wait for confirmation before entering the trade. Be cautious of false breakouts, especially under high market volatility conditions.

XLMUSDT short Wait for Good EntryLike & Follow me for more details
GLMR Short,
BTC will break upward trend soon.
Will reach 103k

XLMUSDT 1D AnalysisXLM ~ 1D Analysis
#XLM Buy gradually from here if you still have confidence in this coin with a short term target of at least 10%+ from here.

XLM/USD Stellar Heist: Snag the Bullish Breakout Loot!🚀XLM/USD Stellar Surge Strategy🚀
Hello, Wealth Warriors & Market Mavericks! 💸 Ready to conquer the Stellar vs. Tether (XLM/USD) crypto battlefield? 📊 This *Cosmic Trading Blueprint* fuses razor-sharp technicals with real-time market pulse to chase a bullish breakout. Follow this strategy, ride the wave, and exit before the Danger Zone strikes. Let’s bag those profits as a squad! 🤝🎯
📈 **Strategy Snapshot: XLM/USD Stellar**
- **Market**: XLM/USDT (Crypto) 🌍
- **Bias**: Bullish Breakout ✨
- **Timeframe**: 6h (Swing Trade) ⏳
**Entry Points** 📡
- **Breakout Entry (Entry 1)**: Spot the breakout above the 50-period MA at 0.33500 and dive in—stellar gains await! 🚀
*Smart Tip*: Place buy stop orders above the MA or buy limit orders at the latest 15/30-min swing low for pullback entries. 🔔 Set a TradingView alert for the 0.33500 breakout to stay ahead of the game!
- **Pullback Entry (Entry 2)**: Wait for a dip near 0.32500, confirmed by bullish price action, for a safer entry. 📉
**Stop Loss** 🛡️
- **Breakout Traders**: After breakout confirmation, set Stop Loss below the recent 1D swing low at 0.28000 to guard against reversals. ⚠️
- **Pullback Traders**: Adjust Stop Loss based on risk tolerance (e.g., 1-2% of account), factoring in lot size and multiple entries. 📏
- **Risk Note**: This trade’s high-energy! Keep position sizing disciplined to protect your capital. 🔥
**Target** 🎯
- Aim for 0.45000, near the Danger Zone (overbought area prone to consolidation or reversal). 🏁
- **Exit Strategy**: Take profits early if bearish signals (e.g., high volume, reversal patterns) emerge near 0.45000. 💰
**Scalpers** 👀
- Target quick long-side scalps with tight trailing stops. Pair with swing traders for the full strategy or snag fast profits if capital allows. 💵
📊 **Why This Trade Shines (May 18, 2025)**
XLM/USDT is poised for action, driven by:
- **Technicals**: Breakout above the 50-day MA (~0.33500) with higher lows on the 4h chart signals strong momentum. 📈
- **Sentiment Analysis (May 18, 2025)**: Web sentiment shows 70% positive buzz for XLM, with altcoin hype growing. Fear & Greed Index at 74 (Greed), urging caution near overbought levels. 😎
- **Fundamentals**: CFTC’s COT report (May 16, 2025) indicates a 10% WoW increase in institutional long positions in crypto futures, reflecting big-player optimism. 📰
- **Seasonal Advantage**: Q2 historically boosts altcoins, aligning with this setup. 📅
- **Market Dynamics**: USD weakness (DXY down 0.9% this week) and altcoin strength fuel XLM’s upside. 🌎
⚠️ **Risk Management: Secure Your Gains**
- **News Caution**: Avoid new trades during high-impact events (e.g., CPI, FOMC) to dodge volatility spikes. 🗞️
- **Trailing Stops**: Activate trailing Stop Loss as price approaches 0.42000 to lock in profits. 🔒
- **Position Sizing**: Limit risk to 1-2% per trade for a steady strategy. 🚨
💥 **Launch the Surge!** 💥
Join the *Cosmic Trading Blueprint* crew—like, comment, and follow for more dynamic trade setups! 🚀 Your engagement fuels our market quests, driving precision wins. Let’s crush XLM/USDT together! 🤝🏆🎉
**Stay Ready**: Another stellar plan is in the works. Keep your charts primed, traders! 🐱🚀😎
📡 **Real-Time Data (May 18, 2025, UTC+1)**
- **XLM/USDT Price**: ~0.33200 (aggregated exchange data).
- **COT Report (May 16, 2025)**: Institutional long positions in crypto futures up 10% WoW, per CFTC.
- **Sentiment**: 70% positive, Fear & Greed Index at 74 (Greed).
- **USD Index (DXY)**: Down 0.9% WoW, supporting altcoin momentum.

XLMUSDT 1D AnalysisXLM ~ 1D Analysis
#XLM Buy on retesting this support block or buy after successfully breaking the resistance line on this pattern with a short term target of at least 10%+.

XLM/USDT Breakdown: Structure Shift & Bearish Retracement Setup🚀 XLM/USDT Trade Outlook 🔎
I've been reviewing the XLM/USDT pair, and it's showing a very familiar setup compared to other majors. 🔁 On the daily timeframe, we've seen a notable shift in structure, with a clear break to the downside. 🧱📉 Dropping into the 4-hour chart, that structural break is even more apparent, adding confidence to a bearish bias. 🔍
Currently, the pair is extended away from value—and I’m anticipating a pullback into the fair value zone, where I’ll be watching closely for a potential short setup. 📐💼
🎯 In the breakdown video, we cover:
The prevailing trend context 🌊
How market structure is unfolding across timeframes 🔂
Price action cues to validate the setup 🎥📈
Key support and resistance areas for both entry and target planning 🎯
For risk management, I’m positioning the stop above the retracement high, using roughly 2x ATR for calculated protection 🛑⚙️. A potential reward could extend to 5–6x ATR, depending on how price reacts around prior structure levels on the left. ⬅️📊
As always, I’m cross-checking with my Fibonacci levels for extra confluence—and the alignment here is looking solid. 🔢🧲
Remember, this is not financial advice. Always do your own due diligence. ⚠️💡📉

XLMUSDT 1D AnalysisXLM ~ 1D Analysis
#XLM Buy after successfully penetrating this resistant line with a short -term target of at least 10%+ from here.

Is #XLM Setting Up for a Bull Trap Before a Major Drop?Yello, Paradisers! Is XLMUSD gearing up for a breakout, or is this just a classic liquidity grab before the next major dump? Let’s break it down.
💎Right now, #XLMUSDT is testing a minor resistance at $0.28464, a level where price has repeatedly struggled to push higher. While there is a possibility of a breakout, the presence of strong liquidity around the unmitigated supply zone at $0.31917 suggests that any move higher could be a trap before a significant drop. If price does manage to break above this resistance, traders should be cautious it’s likely just a liquidity grab before a larger move to the downside.
💎Once the price reaches the unmitigated supply zone, a rejection is expected, leading to a downward move toward the key support zone at $0.22699. This level has historically been a strong demand area where buyers could step in, potentially causing a temporary bounce or consolidation before any further downside.
💎As CRYPTOCAP:XLM moves lower, it’s crucial to watch volume activity. If the decline happens with high volume, it will confirm strong selling pressure and increase the likelihood of a deeper drop. However, if the price approaches $0.22699 with low volume, it could indicate a lack of seller conviction, leading to a short-term bounce before resuming the downtrend.
💎The EMA 200 continues to act as dynamic resistance, reinforcing the bearish outlook. As long as price fails to hold above $0.28464 or gets rejected from the supply zone, the bearish setup remains intact. In that case, a move toward $0.22699 and potentially even $0.19151 becomes highly probable. Watching volume reactions at these key levels will be essential to confirm the next move.
💎The only scenario that could invalidate this bearish setup is a strong close above $0.36172 with high volume. That would signal a potential shift in market structure and could indicate renewed bullish momentum.
Paradisers, patience and precision are key in this market. Let the levels guide you, trade strategically, and stay disciplined. Avoid emotional decisions this market punishes the impatient and rewards those who stay focused.
MyCryptoParadise
iFeel the success🌴

"Stellar vs Tether" Crypto Market Heist Plan (Swing Trade)🌟Hi! Hola! Ola! Bonjour! Hallo! Marhaba!🌟
Dear Money Makers & Robbers, 🤑 💰💸✈️
Based on 🔥Thief Trading style technical and fundamental analysis🔥, here is our master plan to heist the XLM/USDT "Stellar vs Tether" Crypto Market. Please adhere to the strategy I've outlined in the chart, which emphasizes long entry. Our aim is the high-risk Red Zone. Risky level, overbought market, consolidation, trend reversal, trap at the level where traders and bearish robbers are stronger. 🏆💸"Take profit and treat yourself, traders. You deserve it!💪🏆🎉
Entry 📈 : "The heist is on! Wait for the MA breakout (0.2900) then make your move - Bullish profits await!"
however I advise to Place Buy stop orders above the Moving average (or) Place buy limit orders within a 15 or 30 minute timeframe most recent or swing, low or high level.
📌I strongly advise you to set an alert on your chart so you can see when the breakout entry occurs.
Stop Loss 🛑:
Thief SL placed at the recent/swing low level Using the 2H timeframe (0.2600) swing trade basis.
SL is based on your risk of the trade, lot size and how many multiple orders you have to take.
🏴☠️Target 🎯: 0.3400 (or) Escape Before the Target
🧲Scalpers, take note 👀 : only scalp on the Long side. If you have a lot of money, you can go straight away; if not, you can join swing traders and carry out the robbery plan. Use trailing SL to safeguard your money 💰.
XLM/USDT "Stellar vs Tether" Crypto Market Heist Plan (Swing Trade) is currently experiencing a bullishness,., driven by several key factors.
📰🗞️Get & Read the Fundamental, Macro, COT Report, On Chain Analysis, Sentimental Outlook, Intermarket Analysis, Future trend targets.. go ahead to check 👉👉👉
📌Keep in mind that these factors can change rapidly, and it's essential to stay up-to-date with market developments and adjust your analysis accordingly.
⚠️Trading Alert : News Releases and Position Management 📰 🗞️ 🚫🚏
As a reminder, news releases can have a significant impact on market prices and volatility. To minimize potential losses and protect your running positions,
we recommend the following:
Avoid taking new trades during news releases
Use trailing stop-loss orders to protect your running positions and lock in profits
💖Supporting our robbery plan 💥Hit the Boost Button💥 will enable us to effortlessly make and steal money 💰💵. Boost the strength of our robbery team. Every day in this market make money with ease by using the Thief Trading Style.🏆💪🤝❤️🎉🚀
I'll see you soon with another heist plan, so stay tuned 🤑🐱👤🤗🤩

XLMUSDT 1DXLM ~ 1D Analysis
#XLM Coin dinosaur 🦖 , Buy in this pattern, with a short -term target of at least 10%.

XLM/USD "Stellar vs US Dollar" Crypto Market Heist Plan🌟Hi! Hola! Ola! Bonjour! Hallo! Marhaba!🌟
Dear Money Makers & Robbers, 🤑💰✈️
Based on 🔥Thief Trading style technical and fundamental analysis🔥, here is our master plan to heist the XLM/USD "Stellar vs US Dollar" Crypto market. Please adhere to the strategy I've outlined in the chart, which emphasizes short entry. Our aim is the high-risk Green Zone. Risky level, oversold market, consolidation, trend reversal, trap at the level where traders and bullish robbers are stronger. 🏆💸Book Profits Be wealthy and safe trade.💪🏆🎉
Entry 📈 : "The vault is wide open! Swipe the Bearish loot at any price - the heist is on!
however I advise to Place buy limit orders within a 15 or 30 minute timeframe most recent or swing, low or high level. I Highly recommended you to put alert in your chart.
Stop Loss 🛑:
Thief SL placed at the recent / swing low level Using the 4H timeframe (0.30000) swing trade basis.
SL is based on your risk of the trade, lot size and how many multiple orders you have to take.
Target 🎯: 0.23000 (or) Escape Before the Target
🧲Scalpers, take note 👀 : only scalp on the Short side. If you have a lot of money, you can go straight away; if not, you can join swing traders and carry out the robbery plan. Use trailing SL to safeguard your money 💰.
XLM/USD "Stellar vs US Dollar" Crypto market is currently experiencing a Bearish Trend,., driven by several key factors. 📰🗞️Read Fundamental, Macro, COT Report, On Chain Analysis, Sentimental Outlook, Intermarket Analysis, Future Prediction:
📌Keep in mind that these Fundamental factors can change rapidly, and it's essential to stay up-to-date with market developments and adjust your analysis accordingly.
⚠️Trading Alert : News Releases and Position Management 📰 🗞️ 🚫🚏
As a reminder, news releases can have a significant impact on market prices and volatility. To minimize potential losses and protect your running positions,
we recommend the following:
Avoid taking new trades during news releases
Use trailing stop-loss orders to protect your running positions and lock in profits
💖Supporting our robbery plan 💥Hit the Boost Button💥 will enable us to effortlessly make and steal money 💰💵. Boost the strength of our robbery team. Every day in this market make money with ease by using the Thief Trading Style.🏆💪🤝❤️🎉🚀
I'll see you soon with another heist plan, so stay tuned 🤑🐱👤🤗🤩
XLMUSDT - JUST ANOTHER IDEA OKAY!Crypto trends been down for awhile after all those uptrend euphoria failed badly..
The more you see those influencers on youtube hyping some coins, of course it crashed at some points, after all that is what those big power institutes wanted to suck all the money inflow, and especially they killed off people who wanna get rich quick who went for high leverage trades.. even with just 2X you will get liquidized with 50% drop for altcoins..
So enough said, if another crash is expected, probably it s going to be the bottom,.. so we can expect great recovery.. I am not an expert, but as XLM being down beautifully as it seems like a flag pattern, so we can expect rebound for XLM some where @0.191.. and expecting higher-high at bigger time frame..
How high? for now no body knows..
So, trade wisely and don't forget your stoploss..
Have a nice day & Happy trading guys!~

#XLMUSDT is showing signs of growth📈 Long BYBIT:XLMUSDT.P from $0.26325
🛡 Stop loss $0.25955
🕒 1H Timeframe
⚡️ Overview:
➡️ The main POC (Point of Control) is at 0.25511, indicating the area with the highest trading volume.
➡️ The 0.25955 level acts as a local support, as the price previously bounced from this zone.
➡️ The volume and market profile highlight areas of high trader activity, especially in the 0.24984 – 0.26325 range.
➡️ The chart shows a forming bullish structure, confirming the potential for further upward movement.
🎯 TP Targets:
💎 TP 1: $0.26630
💎 TP 2: $0.26930
💎 TP 3: $0.27240
📢 Monitor key levels before entering the trade!
📢 If 0.25955 is broken downward, the trade may be invalidated.
📢 If the price holds above 0.26325 and continues rising, the bullish momentum remains intact.
BYBIT:XLMUSDT.P is showing signs of growth—expecting further upside movement!

XLMUSDT Weekly LONG This is a weekly technical analysis for educational purposes on XLMUSDT. I believe that Stellar will find new higher high levels in the middle of the 2025 Bull Season.
As I mentioned before on my ALGOUSDT Weekly Analysis ;
"Considering the global economic crisis, the technical recession in the United States, the suppression of gold and other commodities, the real estate and unemployment crisis in China, and the European Union countries' struggle with inflation, I believe that market makers (the bulls) may create a false FOMO (Fear of Missing Out) during the 2024 BTC halving period, potentially driving BTC to levels of perhaps 50K+ before ending the year 2024 around the 20-25K range. When we consider the global effects, the real bull season is likely to occur between 2025 and 2026.
Reaching 100K in Bitcoin by 2024 wouldn't make much sense if most people don't have the financial means. It's important to remember that patient wealthy individuals often capitalize on the impatience of those with fewer resources. (let's say poors with high dreams) Those with limited means may not have the capital to participate in the market for couple of years.
This is not "clever riches profit from the idiot riches game". Never was. I believe.
I may be wrong, :)
Regards,

XLMUSDT 1DXLM ~ 1D Analysis
#XLM The Bullish flag was formed on the 1D time frame. Buy gradually in this support block with a minimum target of 10%++.

XLM/USD "Stellar Lumen vs US Dollar" Crypto Market Heist Plan🌟Hi! Hola! Ola! Bonjour! Hallo!🌟
Dear Money Makers & Robbers, 🤑💰🐱👤
Based on 🔥Thief Trading style technical and fundamental analysis🔥, here is our master plan to heist the XLM/USD "Stellar Lumen vs US Dollar" Crypto market. Please adhere to the strategy I've outlined in the chart, which emphasizes long entry and short entry. 🏆💸Be wealthy and safe trade.💪🏆🎉
Entry 📈 :
"The loot's within reach! Wait for the breakout, then grab your share - whether you're a Bullish thief or a Bearish bandit!"
Buy entry above 0.3400
Sell Entry below 0.30500
However, I recommended to place buy stop for bullish side and sell stop for bearish side.
Stop Loss 🛑:
Thief SL placed at 0.3100 (swing Trade Basis) for Bullish Trade
Thief SL placed at 0.34000 (swing Trade Basis) for Bearish Trade
Using the 2H period, the recent / nearest low or high level.
SL is based on your risk of the trade, lot size and how many multiple orders you have to take.
Target 🎯:
-Bullish Robbers TP 1st target - 0.3850 / Last target - 0.4800 (or) Escape Before the Target
-Bearish Robbers TP 0.23000 (or) Escape Before the Target
📰🗞️Fundamental, Macro, COT, Sentimental Outlook:
XLM/USD "Stellar Lumen vs US Dollar" Crypto market is currently experiencing a Neutral trend (there is a higher chance for Bullishness)., driven by several key factors.
💱 Fundamental Analysis: Bullish
- Stellar's fundamentals are strong, with a growing ecosystem and increasing adoption of its
blockchain technology.
- Partnerships with major companies like IBM and Deloitte are driving growth.
💱 Macro Economics: Neutral
- The global economic outlook is uncertain, but Stellar's decentralized nature makes it less
susceptible to traditional economic factors.
- Increasing institutional investment in cryptocurrencies is a positive macroeconomic factor.
💱 COT Report:
- Non-Commercial Traders (Speculators): 35% Long, 65% Short
- Commercial Traders: 40% Long, 60% Short
- Non-Reportable Traders: 25% Long, 75% Short
💱 Sentimental Market Analysis: Bullish
- The overall market sentiment for XLM/USD is bullish, with many traders expecting a price
increase.
- This sentiment is driven by Stellar's strong fundamentals and increasing adoption.
💱 Positioning:
- Institutional Traders: 40% Bullish, 30% Bearish, 30% Neutral
- Banks: 35% Bullish, 35% Bearish, 30% Neutral
- Hedge Funds: 45% Bullish, 25% Bearish, 30% Neutral
- Corporate Traders: 30% Bullish, 40% Bearish, 30% Neutral
- Retail Traders: 50% Bullish, 20% Bearish, 30% Neutral
💱 Price Prediction:
- Short-term (next 30 days): $0.15-$0.25
- Medium-term (next 3 months): $0.20-$0.35
- Long-term (next 6 months): $0.30-$0.50
💱 Overall Outlook: Bullish
- The overall outlook for XLM/USD is bullish, driven by Stellar's strong fundamentals, increasing adoption, and positive market sentiment.
⚠️Trading Alert : News Releases and Position Management 📰 🗞️ 🚫🚏
As a reminder, news releases can have a significant impact on market prices and volatility. To minimize potential losses and protect your running positions,
we recommend the following:
Avoid taking new trades during news releases
Use trailing stop-loss orders to protect your running positions and lock in profits
📌Please note that this is a general analysis and not personalized investment advice. It's essential to consider your own risk tolerance and market analysis before making any investment decisions.
📌Keep in mind that these factors can change rapidly, and it's essential to stay up-to-date with market developments and adjust your analysis accordingly.
💖Supporting our robbery plan will enable us to effortlessly make and steal money 💰💵 Tell your friends, Colleagues and family to follow, like, and share. Boost the strength of our robbery team. Every day in this market make money with ease by using the Thief Trading Style.🏆💪🤝❤️🎉🚀
I'll see you soon with another heist plan, so stay tuned 🤑🐱👤🤗🤩

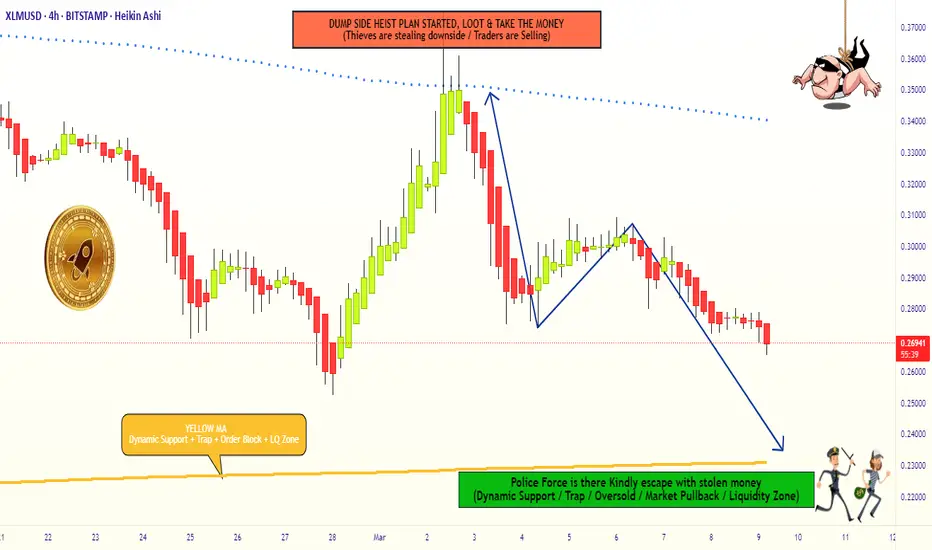
XLM/USD "Stellar vs US Dollar" Crypto Market Bearish Heist Plan🌟Hi! Hola! Ola! Bonjour! Hallo!🌟
Dear Money Makers & Robbers, 🤑 💰
Based on 🔥Thief Trading style technical and fundamental analysis🔥, here is our master plan to heist the XLM/USD "Stellar vs US Dollar" Crypto market. Please adhere to the strategy I've outlined in the chart, which emphasizes short entry. Our aim is the high-risk Green Zone. Risky level, oversold market, consolidation, trend reversal, trap at the level where traders and bullish robbers are stronger. 👀 Be wealthy and safe trade.💪🏆🎉
Entry 📉 : Traders & Thieves with New Entry A bull trade can be initiated at any price level.
however I advise placing sell limit orders within a 15 or 30 minute timeframe. Entry from the most recent or closest high level should be in retest.
Stop Loss 🛑: Using the 2h period, the recent / nearest high level.
Goal 🎯: 0.38666 (OR) Before escape in the bank
Scalpers, take note : only scalp on the Short side. If you have a lot of money, you can go straight away; if not, you can join swing traders and carry out the robbery plan. Use trailing SL to safeguard your money 💰.
Fundamental Outlook 📰🗞️
The XLM/USD (STELLAR vs U.S Dollar) market is expected to move in a bearish direction, driven by several key factors.
Fundamental Analysis
1. Decreasing Trading Volume: XLM's trading volume has been decreasing over the past few months, indicating a lack of interest from traders and investors.
2. Stagnant Price Action: XLM's price has been stuck in a narrow range for several months, failing to break out or show any significant upward momentum.
3. Low Network Activity: Stellar's network activity, such as transaction count and block creation, has been relatively low compared to other blockchain networks.
Macro Analysis
1. Competition from Other Cryptocurrencies: Stellar faces intense competition from other cryptocurrencies, such as Ripple, Bitcoin, and Ethereum, which have larger market capitalizations and more established ecosystems.
2. Regulatory Uncertainty: The regulatory environment for cryptocurrencies is still unclear in many countries, which can create uncertainty and hesitation among investors and users.
3. Lack of Institutional Investment: Despite some partnerships and collaborations, Stellar has yet to attract significant institutional investment, which is necessary for long-term growth and adoption.
Market Sentiment
1. Bearish Trader Sentiment: The sentiment among traders is currently bearish, with many expecting the price to decrease in the short term.
2. Low Retail Interest: Retail interest in XLM has been waning, with fewer investors and traders showing interest in the cryptocurrency.
3. Negative Social Media Sentiment: Social media sentiment towards XLM has been negative, with many users expressing disappointment and frustration with the cryptocurrency's performance.
Upcoming Events
1. Potential Regulatory Crackdown: There is a risk of a regulatory crackdown on cryptocurrencies, which could negatively impact XLM's price and adoption.
2. Competition from New Cryptocurrencies: New cryptocurrencies and blockchain projects are emerging, which could potentially compete with Stellar for users and investors.
3. Technical Challenges: Stellar's network has faced technical challenges in the past, such as congestion and scalability issues, which could impact its performance and adoption.
Sentiment Analysis:
Overall Sentiment:
Bearish (60%)
Sentiment Breakdown:
- Bearish: 60%
- Negative sentiment driven by decreasing trading volume, stagnant price action, and low network activity.
- Neutral: 25%
- Mixed sentiment due to uncertainty around regulatory environment and lack of institutional investment.
- Bullish: 15%
- Positive sentiment driven by potential for partnerships and collaborations, and optimism around Stellar's technology.
Market Sentiment Indicators
- Trader Sentiment: Bearish (55%)
- Retail Sentiment: Bearish (62%)
- Social Media Sentiment: Bearish (58%)
- News Sentiment: Neutral (50%)
Technical Analysis Indicators
- Moving Averages: Bearish (60%)
- Relative Strength Index (RSI): Neutral (50%)
- Bollinger Bands: Bearish (55%)
Trading Alert⚠️ : News Releases and Position Management 📰 🗞️ 🚫🚏
As a reminder, news releases can have a significant impact on market prices and volatility. To minimize potential losses and protect your running positions,
we recommend the following:
Avoid taking new trades during news releases
Use trailing stop-loss orders to protect your running positions and lock in profits
Please note that this is a general analysis and not personalized investment advice. It's essential to consider your own risk tolerance and market analysis before making any investment decisions.
Keep in mind that these factors can change rapidly, and it's essential to stay up-to-date with market developments and adjust your analysis accordingly.
💖Supporting our robbery plan will enable us to effortlessly make and steal money 💰💵 Tell your friends, Colleagues and family to follow, like, and share. Boost the strength of our robbery team. Every day in this market make money with ease by using the Thief Trading Style.🏆💪🤝❤️🎉🚀
I'll see you soon with another heist plan, so stay tuned 🫂

XLM/USD "Stellar vs U.S Dollar" Crypto Market Bullish Heist Plan🌟Hi! Hola! Ola! Bonjour! Hallo!🌟
Dear Money Makers & Robbers, 🤑 💰
Based on 🔥Thief Trading style technical and fundamental analysis🔥, here is our master plan to heist the XLM/USD "Stellar vs U.S Dollar" Crypto market. Please adhere to the strategy I've outlined in the chart, which emphasizes long entry. Our aim is the high-risk Red Zone. Risky level, overbought market, consolidation, trend reversal, trap at the level where traders and bearish robbers are stronger. Be wealthy and safe trade.💪🏆🎉
Entry 📈 : You can enter a Bull trade at anypoint,
however I advise placing Buy limit orders within a 15 or 30 minute timeframe. Entry from the most recent or closest low or high level should be in retest.
Stop Loss 🛑: Using the 2H period, the recent / nearest low or high level.
Goal 🎯: 0.55000 (or) Escape Before the Target
Scalpers, take note 👀 : only scalp on the Long side. If you have a lot of money, you can go straight away; if not, you can join swing traders and carry out the robbery plan. Use trailing SL to safeguard your money 💰.
Warning⚠️ : Our heist strategy is incompatible with Fundamental Analysis news 📰 🗞️. We'll wreck our plan by smashing the Stop Loss 🚫🚏. Avoid entering the market right after the news release.
Fundamental Outlook 📰🗞️
Considering these factors, the XLM/USD pair may experience a Bullish trend in the short-term, driven by:
Growing adoption and usage of XLM for cross-border payments and remittances.
Increasing demand for fast and low-cost digital payments, driven by growing global trade and commerce.
Favorable regulatory environment, driven by growing recognition of the benefits of cryptocurrencies and blockchain technology.
🐂Bullish Factors:
Growing adoption and usage of XLM for cross-border payments and remittances.
Increasing demand for fast and low-cost digital payments, driven by growing global trade and commerce.
Favorable regulatory environment, driven by growing recognition of the benefits of cryptocurrencies and blockchain technology.
Growing interest in blockchain technology and its applications, driven by its potential to increase efficiency and reduce costs.
Increasing investment in XLM and other cryptocurrencies, driven by their potential for long-term growth and returns.
Market Sentiment:
Bullish sentiment: 75%
Bearish sentiment: 25%
Neutral sentiment: 0%
Please note that this is a general analysis and not personalized investment advice. It's essential to consider your own risk tolerance and market analysis before making any investment decisions.
Take advantage of the target and get away 🎯 Swing Traders Please reserve the half amount of money and watch for the next dynamic level or order block breakout. Once it is resolved, we can go on to the next new target in our heist plan.
Keep in mind that these factors can change rapidly, and it's essential to stay up-to-date with market developments and adjust your analysis accordingly.
💖Supporting our robbery plan will enable us to effortlessly make and steal money 💰💵 Tell your friends, Colleagues and family to follow, like, and share. Boost the strength of our robbery team. Every day in this market make money with ease by using the Thief Trading Style.🏆💪🤝❤️🎉🚀
I'll see you soon with another heist plan, so stay tuned 🫂

XLMUSDT 1DXLM ~ 1D
#XLM At Time Frame 1D Forms a bullish Flag. Buy after breaking through the resistance of this pattern. Minimum target 20%++

#XLM/USDT Ready to go higher#XLM
The price is moving in a descending channel on the 1-hour frame and sticking to it well
We have a bounce from the lower limit of the descending channel, this support is at 0.4300
We have a downtrend on the RSI indicator that is about to be broken, which supports the rise
We have a trend to stabilize above the moving average 100
Entry price 0.4434
First target 0.4590
Second target 0.4746
Third target 0.4927
