XLP

Paper Portfolio vs S&P500 - Update #1This is the first update for the video series here to grow the paper portfolio on TradingView in an attempt to beat the 'S&P index real time. Normally, I will compare the portfolio to the market, talk about weak vs strong stocks and sectors & go into what I will be changing moving forward. The portfolio has been able to get ahead of the general market and below are the specific percentage changes if they weren't clear in the video:
AUGUST 2018
Portfolio = +1.83%
'S&P Index ('SPX) = +1.36%
'SPY ETF = +1.57%
So far there is only a small difference between the market and the portfolio, but with adjustments and the market moving however it wants to, the changes should be expected to be more different over time. In general and in brief, my process of dealing with my portfolio according to my trading strategy is to check the health of my portfolio to determine where weakness is coming from, then run a stock screen according to my very own specific criteria to pick out the stocks that have high chance of performing very well, and finally an analysis of the market sectors to make sure changes I make will make sense.
So this time around my portfolio suggested reducing exposure to stocks in Energy, Financials and Industrials. My stock screen, compared to the previous stock screen run at the beginning of the portfolio, suggested reducing exposure to stocks in Energy, Financials, Technology & Utilities and increasing exposure in Basic materials, Consumer goods, Healthcare and Industrials. The market sector ETFs from the video also echoed a similar idea, and so the orders will be placed for Monday. I am considering putting more weight in the stocks that have a better chance of doing well than before but we will see what happens over the next month.
Again this is will not be a one time "get rich quick" process with excessive risk-taking or gambling, but a more disciplined approach to trading. It takes some work and it can be tough to maintain discipline, but after a while it becomes routine. Again, monthly updates on the current state of the portfolio will be continued and the next one can be expected to be made on 10/06/18 (1 month from now) and every month from that point onward.
Starting capital - $10,000
Risk per trade - 1%
Max. positions at a time - 20
Investment style - Equities long only (no short-selling, only stocks >$7, technical analysis > fundamental analysis)
The stocks shown will not be shown as investment advice but rather shown as a form of education only. Comment on what you would like to see or hear more about!
Thanks and stay tuned (will try to keep videos not too long)!

General Market OverviewThis video is the first of many, and I discuss the behaviors of the sectors and potential markets that are poised to trend in the near future. The "freshest" sectors quietly trying to start a new trend are the Industrial and Consumer Discretionary Sectors. The sectors (along with their industries) I think should be on every trend follower's radar are:
XLF - Financials Sector (including some real estate stocks): setting up to break out of its 5 month range; main movers are the bank industry (not the Goldman Sachs and Morgan Stanley kind of banks)
XLI - Industrials Sector: breaking out today with the possible trend beginning here in an unpopular sector; main movers are the service industries
XLK - Technology Sector: obvious uptrend that should be followed with caution, but is getting ready to continue; main movers are the software and IT services & consulting industries
XLP - Consumer Staples Sector: in early stages on uptrend with possible correction or continuation in the near future; moved by multiple industries
XLRE - Real Estate Sector: also in the early stages of possible uptrend; main movers of sub-sector have been REITs
XLU - Utilities Sector: also in the early stages of possible uptrend; main movers are electric utilities industry
XLV - Health Care Sector: uptrend already in motion with test of all-time highs today, with great potential for trend continuation; main movers are medical equipment and managed health care industries
XLY - Consumer Discretionary Sector: breaking out today with the possible trend beginning here in a sector where the media does not favor much; main movers are the apparel, discount, footwear and auto industries (mostly retail)
I am going to do more videos on how I diversify my portfolio, and how to create such a portfolio according to what is moving in the whole market so it would be great to get feedback from this video that I can include in those, and also ideas on material you would like to see more of!
Thanks, enjoy.

GIS is a buy!Shares of General Mills (GIS) have been terrible to own lately. But they're finally finding support at a major support level (breakout from 2012-2013) at about $41.
They recently acquired Blue Buffalo Pet Foods, which should help drive growth to the bottom line, as the humanization of pets continues to accelerate.
At current prices, it's also sporting a solid 4.4% dividend (54% payout ratio, 5.2% 5-year annual average dividend growth, but new revenue/income streams should give them the ability to grow dividends more significantly going forward).
As a "consumer staple," it's no doubt out of favor... and that makes me like it even more! Buy when others sell, sell when other buy. Right?! :)
The valuation is attractive at 14x 2018's estimated E.P.S., and again, the new revenue/income streams from recent acquisitions should help raise E.P.S. estimates in the next few quarters.
To be fair in my analysis, the PEG ratio is a bit high at 2.3. Also, I've noticed some insider selling, so I'm curious about that. But insiders sell for a ton of reasons, so in and of itself, its not a reason to be scared away, just something to watch.
Option open interest is 22% higher than average, and favors bulls, with 1.2 calls for every one 1 put. I also wanted to point out that the MACD experienced a bullish cross (on weekly chart), so any dips from here should be bought!
Long this name as a core position in a long-term account, as well as long September calls in my trading account.

Risk on/Risk off, XLY:XLP ratios, THE Real money flow indicator.Was recently shown this little gem of a ratio chart that will help gauge strength to certain markets such as the stocks and other financial instruments as the S&P, Dow Jones etc
So what does it all mean??
The ratio of two diametrically opposed asset classes often provides insightful clues about what investors are doing.
The XLY:XLP ratio is a perfect example. Its not a hypothetical as it uses real money data based on what investors are DOING and NOT what they maybe thinking or projecting...
XLY represents the Consumer Discretionary Select Sector SPDR ETF.
XLP represents the Consumer Staples Select Sector SPDR ETF.
XLY is the ETF which tracks the consumer
discretionary sector XLY’s top 5 holdings are...
Comcast (CMCSK),
Walt Disney (DIS),
Amazon.com (AMZN),
Home Depot (HD),
McDonald’s (MCD).
XLP tracks the consumer staples sector, with
top holdings of...
Procter & Gamble (PG),
Coca-Cola (KO),
Philip Morris (PM),
Wal-Mart (WMT),
CVS Caremark (CVS).
So how does this affect markets?
When the chart value rises its a clear indicator that people are happy to spend freely and without caution, investors will look to increase risk, where as if the value starts to go down and decline, people are spending more on everyday essential items and thus stock markets are in shrinkage, decline and investors are taking LESS risk.
we can clearly see how this chart reflects current highs on the stock indices if we compare to the current S&P500, Russel, Dow Jones and so on
If this article has helped or you have any further questions, please leave them in the comments below.....

A Trillion Dollar Tailwind As Apple Helps Will the Stock Market It's a celebration! Apple (AAPL) made history by breaking the trillion dollar market. After some delay, the stock market joined the party.
"A Trillion Dollar Tailwind As Apple Helps Will the Stock Market Higher" drduru.com $SPY $QQQ $AAPL #AT40 #T2108 #VIX $CMG $DPZ $MSFT $XLP $CAT $RIO $BHP $X

Stock Market Bears Increase the PressureThe trading action over the last 2 days validated my bearish stance as small caps and tech finally sustained a tumble deep enough to matter.
Stock Market Bears Increase the Pressure drduru.com $SPY $QQQ $XLP $XLF $XLI $XLP $AXON #VIX #AT40 #T2108$BHP $USO $SLV $BOTZ $CAT $INTC $KMX $RHT $SPLK $WHR $WIX

TUP long term supportShares of TUP are approaching a critical long-term support level at $39-42, depicted on this weekly chart with the blue line.
The daily chart is also looking favorable, with shares now trading above the 50-day moving average, and my 5/13ema's are in a buy mode.
I'm a buyer with a stop on a weekly close below $39.

Ofensive Sector vs Defensive Sector on SPXOfensive Sector (Tech + Discretionary) vs Defensive Sector (Utils + Staples) on SPX index.

THE WEEK AHEAD: TSLA EARNINGS, EEMAlthough AAPL and GILD announce earnings next week, the only earnings announcement that interests me from a premium selling standpoint is TSLA, with a background implied volatility of over 65%.
The 73% probability of profit May 11th 255/330 short strangle is paying 5.83 at the mid (off hours quotes) with its defined risk counterpart, the 68% probability of profit May 11th 250/255/330/335 iron condor paying 1.06, which is less than I'd like to see out of a 5-wide.
On the exchange-traded fund front, most of the most liquid funds are sub-35% implied volatility, which generally makes for less than compelling premium selling plays. For what it's worth, however, the top five ranked by implied volatility are: XOP (30.4%), OIH (30.2%), EWZ (27.4%), GDXJ (25.5%), and FXI (23.1%). I'm already in XOP and GDX plays, so I might consider having another go at "the Brazilian" in the June cycle -- the June 15th 39/47 short strangle (18 delta) is paying .77. Naturally, more aggressive delta strikes pay more, and it may be amenable to a short straddle/iron fly, depending on your account size, risk appetite, and patience for managing an underlying that seems to whip all over the place on occasion ... .
Alternatively, I might go with another net credit double diagonal due to setup flexibility over a static one-off play, this time in the fairly broad market EEM, which has been closely tracking FXI of late, but is of greater liquidity: the June/Sept 44/47/47.5/50.5 double net credit diagonal is .26 at the mid for a three-wide, and I'd probably look to bail on it at 20% the width of the 3.00 wings ... .
I'll also look at bullish directional shots in IYR, XLI, XHB, and/or XLP, which appear to be the weakest of the sectors currently. Pricing those out in non-New York hours tends to be non-productive since the deep-in-the-money back months show wide bid/ask in off hours, so it's tough to tell how much you're going to have to commit buying power wise to play ... .

The Stock Market Swings From Bullish Signs to Stop Signs.A snipper from my latest post.... drduru.com
The stock market faded from bullish undertones and back into the resting position. Now we can just look back at what could have been.
For the first time in a long time, I feel compelled to change my short-term trading call from neutral. While the S&P 500 (SPY) still sits well within a trading range of churn, I see several signals which give me bearish vibes starting with my favorite technical indicator: AT40 (T2108), the percentage of stocks trading above their respective 40-day moving averages (DMAs).
Through Wednesday, April 18th, AT40 rallied relatively consistently with 9 up days out of 12 trading days. The last two up days featured weakening momentum and the top, an intraday high of 67.6%, came just short of the overbought threshold of 70%. I typically interpret a rejection at the overbought threshold as a bearish event. I am particularly keen to follow this interpretation given a similar rejection preceded the big February sell-off, and I was very slow to react to that rejection. AT40 swiftly fell all the way back to 55.2% to close the week. I am now eager to see AT40 hold a higher low.
The S&P 500 (SPY) provided one component of a bearish confirmation. At its last high, the index closed just about even with its close after the Fed’s last decision on monetary policy. Not only did the index fail to maintain momentum from there, but also the subsequent selling pushed the S&P 500 right back below its 50DMA. The NASDAQ and the PowerShares QQQ ETF (QQQ) both pulled up short of their post-Fed closes before dipping below their 50DMAs to the end the week.
The volatility index, the VIX, might as well have sealed the deal. Last week, the VIX traded right down to the 15.35 pivot and convincingly held that level as support over the next 3 trading days. While the VIX did not pop as much as I would have expected, I am still respecting this hold of support. I am staying patient before shorting the iPath® S&P 500 VIX Short-Term Futures™ ETN (VXX) again, and I am holding onto call options on the ProShares Ultra VIX Short-Term Futures ETF (UVXY).
The Australian dollar (FXA) versus the Japanese yen (FXY) provided one more piece to the puzzle by breaking down below its 50DMA again. Just a week ago, AUD/JPY looked like it was leading financial markets higher. Now it looks set to grease the skids pointing downward....

PG Long Term SupportPG has found long term support from a rising trend line that coincides with a major 61.8% retracement. This is a great place to buy for a longer term play on a great company.

Where to Short #Clorox? Specific Levels to Watch for $CLX Bearish Break for Clorox occurred in early February 2018. On the chart you can see 4 horizontal lines. Notice that the Yellow and the Red Lines can be used as a good place to short, since Clorox is in a bear market currently.
These custom support resistance indicator lines show decent places to enter or exit.
The Blue indicator line serves as a Bullish Trend setter.
If your instrument closes above the Blue line, we think about going Long.
If your instrument closes below the Red line, we think about Shorting.
For Stocks, I prefer to use the Yellow line as my Bearish Trend setter (on Daily charts).
Find out more. Send Private Mail (PM) to @MasterCharts

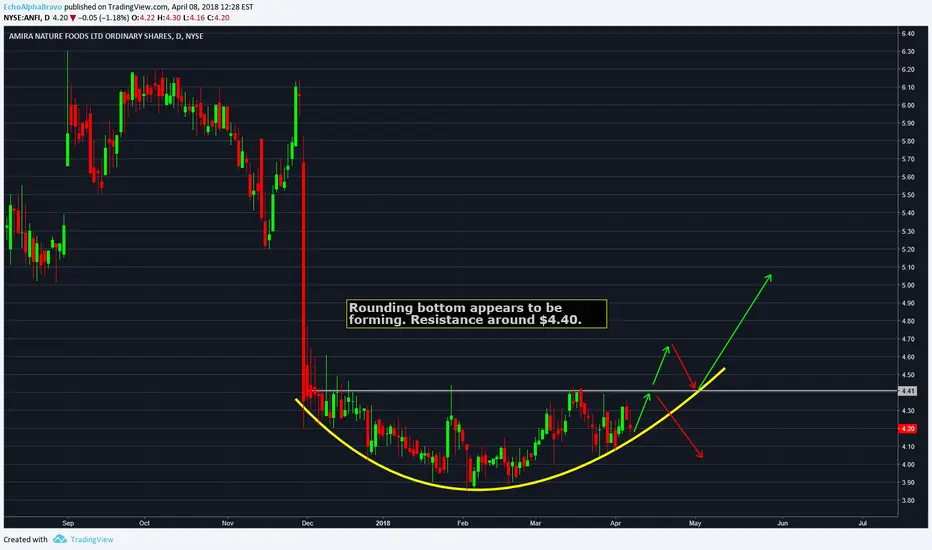
Picture perfect rounding bottomShares of ANFI appear to be forming a rounding bottom, with resistance overhead at $4.40. A breakout above could cause shares to rally, but a failure opens the door for a retest of the lows or extend lower.
To be fair, I don't know much about this company's fundamentals (yet), so I'll update this as I sift thru the financials. I just wanted to point out this damn-near perfect rounding bottom. If I end up positioning one way or the other, I'll update this idea. For now, I'm neutral.
Comments? Thoughts?
Relative Performance XLK-SPY-XLPThe XLK has largely erased losses since the correction while the Staples are still underperforming the broad market. SPY is showing strength despite concerns about steel tariffs and with the 10-year yields retracing, I see a higher likelihood of the SPY catching up with XLK than retesting the lows.

Consumer staples has potential to trade higher short termStaples has lagged behind compared to other sectors with positive estimate revisions. Consumer staples is among the worst performing sectors in the s en p 500 over the last twelve months. Buy what is cheap.

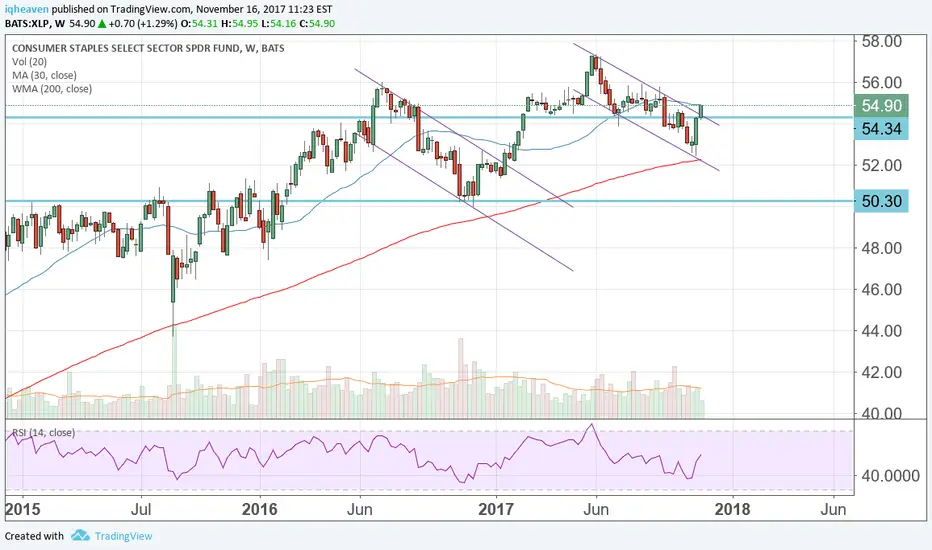
XLP long-term buyI came across an interesting pattern on consumer staples ETF (XLP).
The pattern is a channel spanning almost 9 years. The pattern is well tested and respected (7 reversals on the lower bound, 6 reversals on the upper bound)
Over the past two years, the ETF has consolidated gaining only 2% per year. Despite the consolidation, the ETF has an annual return of 22% for the past 9 years!
today we saw the price break and close above the previous weekly high, a bullish sign.
I love this trade because of the long-term price action and minimal risk.
my stop loss is at $54.02 (6.7% risk).
Economically speaking this space is extremely sound as consumers buy these products no matter the economic landscape. As shown by the price action this space offers slow and steady growth, due to the low elasticity and constant demand.


Short at the Teal line, or bottoming action? ..General Mills could be bottoming. $XLP #consumer #staples


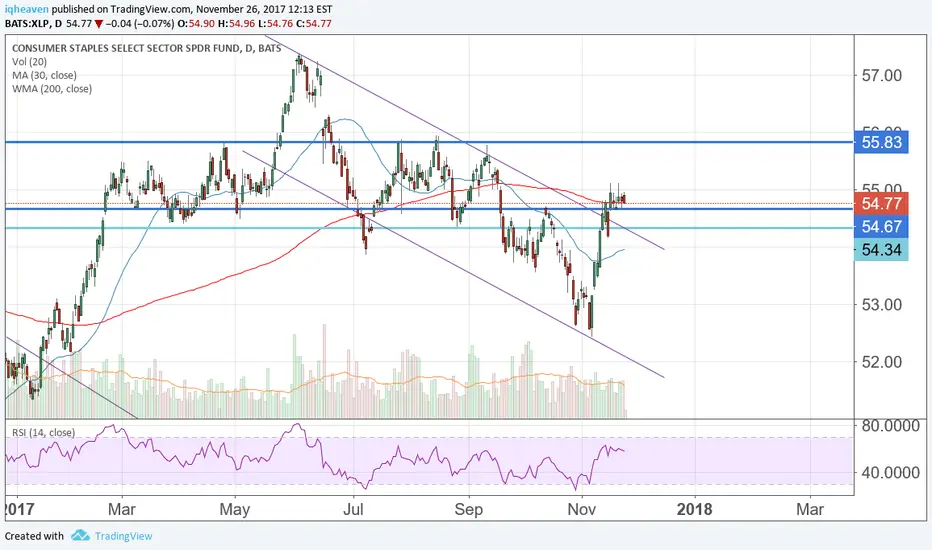
$xlp further short term breakdownhigher time frame is showing defined uptrend with an over-extension on breakout pulling back
mid time frame is showing markup to distribution to consolidation for the next leg down
descending triangle is forming against downtrend line and multiple test of support is showing weakness
possible breakdown to breakout level of 55.7x on higher time frame- first level 56.2x
lower time frame is showing range bound action with sellers slightly in control
descending triangle is also forming- worth monitoring price action
