XMR waiting to cross ATH very soon..XMR - Monero the great privacy coin going above and beyond its ATH.. Be ready to scoop some up guys..
Xmrusd


Golden Pocket Retracement to $380 for Monero! 🚀🚀🚀Hey Traders,
As you can see, the Weekly Candles of XMR (Xonero) reveal a Falling Wedge pattern via the bodies. After a large downtrend, the 0.618 level from the peak to the trough is the most common retracement zone (AKA the Golden Pocket). The price breakout out of the falling wedge is also set near $400 (based on the first impulse-up move within the pattern). The ABCDE Elliot wave is not that accurate so it is just for show... Tp at $380
Another reason why XMR recently pumped is that an exchange had someone's balance on paper, not actually in reserves. So someone with a very large amount needed to withdraw so the exchange bought the XMR all at once in order for the person to move it. This was a coordinated move by the Monero community to test the exchange's reserves which ultimately proved correct.
Safe Trading,
-Pulkanator

The beginning of the Monero rainbow... (XMR)This is a video that details where the path of this rainbow began.
It also just goes over how that whole ROYGBIV parallel channel thing can help anyone out in terms of indications, alerts, etc.

MONERO OVER THE RAINBOW!It never, ever gets old when you find out-- you were right .
XMR and here we ARE!
It's all happening, ladies and gentleman.
Daddy's buying a new pair of shoes. Still a chance to get in at a good spot here right above 250 with a SL of somewhere underneath 244... just sayin.

Monero XMR inverted head and shouldersMonero is showing another head and shoulders formation in the chart -- she's looking towards the sky...
"Sir.... we were cleared for style="color:#FFFF00">take off over an f'ing week ago, standing by at mandatory hold M-69-420 awaiting departure clearance." ... 🛫
🤞🏼 - 🙏
♠️🤫🐿

Update For XMR/USD Analysis 📈📉Hello traders ,
In the past analysis that I posted for Monero , it was almost successful and finally reached my target and even a little went beyond.(🎯~ 340%💰)
so now!
-------------------------------------------------------------------------------------------------------------------
📊Technical
As you can see on weekly timeframe for XMR/USD , since reaching its major resistance zone ,it has been declining and correcting
so far . but after 6 bullish candle it reached the pivot zone , so today according to bar pattern we are witnessing a new attempt to attack higher price and even reach previous ATH , if only if it be able to maintain the current pivot zone , then it can continue its uptrend . but otherwise it can drop on lower supports.
🛑resistance level: $258 -268///$486-536
🆚pivot zone: $217- 226$
❇️support levels: $120-130///$60-100///ascending trendline
--------------------------------------------------------------------------------------------------------------------
👉This analysis is my personal opinion ,not a financial advice ,so do your own research.
💜 if you're a fan of my analyses PLZ follow me and give a big thumbs 👍 OR drop comment 🗯💭

XMR LONGThe XMR is upwards and after reaching the resistance, it has a fall
If the number of followers reaches 100 this week, I will put pure analysis every day.
Follow fractal_analysis98

Monero breakout! (XMR) poised for a run!I realize that it is floppy Friday, (...and tax day for us stupid Americans) .
However, Monero has been continually making positive moves throughout this entire last bearish 10-14 days we've had with BTC and the rest of the crypto-verse.
I have been following Monero more closely than any other coin/token/currency that I chart.
I've been mining XMR using cheap CPUs since 2018, and have been heavily invested since fall of 2017.
I personally just sold all of my Ethereum and threw it into XMR. if anything... I'd be on the lookout
♠️🤫🐿

XMRUSD More rise ahead or pull-back to lows?Monero (XMRUSD) has been very strong since the February 25 Double Bottom as it almost reached the early January High. In doing so, it broke above the Lower Highs trend-line of the May 07 All Time High (ATH) and the 1D MA200 (orange trend-line). It is possible that within this month, it will form a 1D Golden Cross (when the 1D MA50 (blue) crosses above the 1D MA200).
The last time the price broke above such a long-term Lower Highs trend-line and formed a 1D Golden Cross after, was in early 2019 when Monero and the whole market was starting to recover from the 2018 Bear Cycle. The difference is that in 2019 it peaked just below the 0.5 Fibonacci retracement level after forming the Golden Cross, while now it has already come very close to the 0.5 Fib without having formed the Golden Cross. The question is, are we too soon or too late on the fractal?
The RSI on the 1W time-frame seems to support that we are too soon and there is still room to rise, despite having almost reached the 0.5 Fib already. Basically it looks quite a lot like the Golden Cross of May 2020, when the market was recovering from the March COVID flash crash. In both cases, the price always tested the 1D MA50 before rising any further and that is what we are expecting to happen here before a new rally to the 0.618 Fib at $307.00.
--------------------------------------------------------------------------------------------------------
Please like, subscribe and share your ideas and charts with the community!
--------------------------------------------------------------------------------------------------------

Monero (XMR) insanely undervalued!Throughout the last 7 weeks since the beginning of the geo-political turmoil, XMR has continued a steady, albeit slow, predictable rise through all manner of chop coming from BTC and ETH.
You can even see large parabolic downshifts in which -within a matter of hours, or a couple days- Monero returns to the exact same trend, as if nothing had ever taken place.
I am currently working on a video about this overall positive Monero trend going on; with that being said, Monero is incredibly undervalued right now.
♠️🤫🐿

XMR aint ready yet?Nice pumpypump but looky bitty correctivyyy
--- or break 278
Hold my beer pls
----
No financial advice, do your own research, don't be stupid

Update on Monero double bottom Looks like Monero is gonna trigger this double bottom that I posted an idea on last week or so. $240 is the target *not financial advice*

Miners inching closer to triggering this double bottom.Looks like if this triggers it should head to $240. Luna has already reached its double bottom measured move target and the market as a whole has only recently switched from the downtrend correction back to an uptrend s this all increases the probability of this double bottom on mongers both triggering and reaching its measured move target. Of course yas always you should always wait for confirmation of the breakout. I don’t own any modern but couldn’t resist charting this obvious double bottom scenario. *not financial advice*

Monero (XMR) - April 11hello?
Traders, welcome.
If you "follow", you can always get new information quickly.
Please also click "Like".
Have a nice day.
-------------------------------------
(XMRUSDT 1W Chart)
Resistance: 280.3-311.3
Support: 125.0-156.0
(buy)
- After confirming the support in 239.9
- After confirming the support in 218.2
(Stop Loss)
- When it falls below 190.0
(Sell)
- When receiving resistance in the section 280.3-311.3
- When receiving resistance near 404.5
Careful trading is necessary as there is a possibility of a wiggle up and down to cross the 60 SMA line passing near 239.9.
If it rises above the 280.3-311.3 section, it is expected to surge.
------------------------------------------------------------ -------------------------------------------
** All indicators are lagging indicators.
Therefore, it is important to be aware that the indicator will move accordingly as price and volume move.
However, for convenience, we are talking in reverse for the interpretation of the indicator.
** The MRHAB-O and MRHAB-B indicators used in the chart are indicators of our channel that have not been released yet.
(Since it was not disclosed, you can use this chart without any restrictions by sharing this chart and copying and pasting the indicators.)
** The wRSI_SR indicator is an indicator created by adding settings and options to the existing Stochastic RSI indicator.
Therefore, the interpretation is the same as the traditional Stochastic RSI indicator. (K, D line -> R, S line)
** The OBV indicator was re-created by applying a formula to the DepthHouse Trading indicator, an indicator disclosed by oh92. (Thanks for this.)
** Support or resistance is based on the closing price of the 1D chart.
** All descriptions are for reference only and do not guarantee a profit or loss in investment.
(Short-term Stop Loss can be said to be a point where profit and loss can be preserved or additional entry can be made through split trading. It is a short-term investment perspective.)
---------------------------------


Monero Breaking Out to the upsideBullish breakout of long term down trend line minimum target is $279. Monero is what crypto is supposed to be, fundamentally this is one of the best coins to own for the long term.

Monero XMR Price Targets and Stop LossXMR/USDT
Entry Range: $217 - 233
Take Profit 1: $256
Take Profit 2: $273
Take Profit 3: $294
Stop Loss: $206


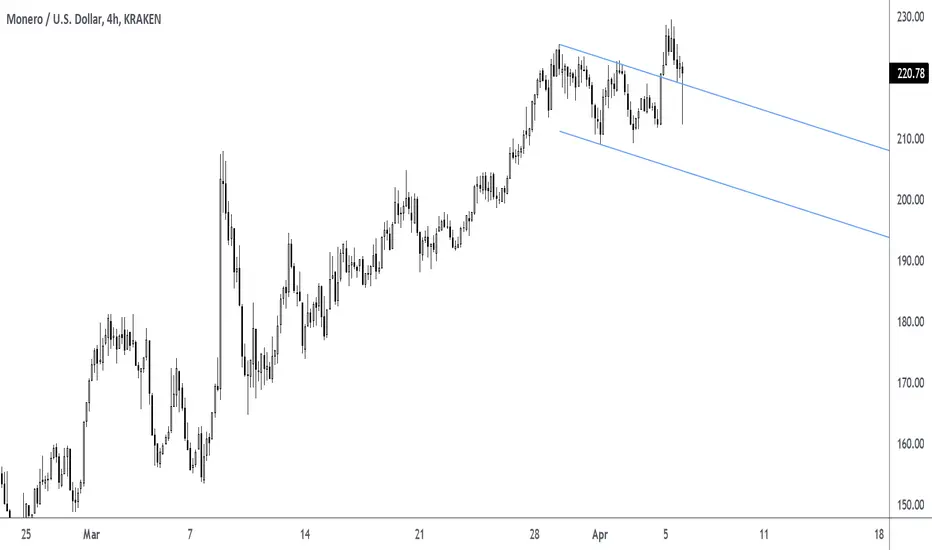
XMR is gonna Decrease to 180$( at least!)XMR IS in a Rising Wedge Pattern. This means the Price is Gonna Become Bearish Soon.No break out has accrued yet, but It's gonna be a Bearish one. The Price will fall to 180$ in best Scenario and It is possible to Decrease to the Bottom of The Pattern as well.
_ _ _ _ _ _ _ _ _ _ _ _ _ _ _ _ _ _ _ _ _ _ _ _ _ _ _ _ _ _ _ _ _
Thank you for seeing idea .
Have a nice day and Good luck

Too attractive to miss outThis looks perfect. This is one of those setups which just make sense and it is a shame to miss out.
Stop under the weekly pivot, take profit at last resistance.
Good luck.

Monero (XMR) formed bullish Gartley | A good long opportunityHi dear friends, hope you are well and welcome to the new trade setup of Monero coin (XMR) with BTC pair.
On a 4-hr time frame, XMR has formed bullish Gartley pattern.
