An Important Bullish Breakout in the Natural Gas MarketThe price of natural gas in USD rose sharply on Thursday after the US Energy Information Administration (EIA) reported a slightly smaller-than-expected weekly increase in domestic natural gas inventories.
At the same time, an important breakdown of the contracting triangle pattern formed by 2 lines (shown in blue) has formed on the XNG/USD natural gas chart.
Presumably, this triangle delineates a market stage in which large players could accumulate long positions at low prices after the downtrend that has been in place in the natural gas market since the beginning of 2023.
On Friday morning, the bulls are able to keep the progress made, keeping the price of XNG above the former resistance at 2.575, which can now serve as support.
This breakdown may become a stage in the development of an important bullish trend. We previously reported that according to EIA forecasts, the average price of natural gas in 2023 could exceed USD 4.
Start trading commodities with tight spreads. Open your trading account now or learn more about making your money go further with FXOpen.
This article represents the opinion of the Companies operating under the FXOpen brand only. It is not to be construed as an offer, solicitation, or recommendation with respect to products and services provided by the Companies operating under the FXOpen brand, nor is it to be considered financial advice.
Xngusd

XNGUSD Silver is coming down as us cpi data comes strong and us dollar gain let see how it react at demand zone

XNGUSD showing StrengthBased on Daily timeframe, XNGUSD almost last 52 trading days defending it's low level. Now we see some strength from lower level.
can we see XNGUSD at 5.5$ in coming trading days?

XNGUSD ready to reverse recent downtrend LONGOn the daily chart here XNGUSD had a head and shoulders or double top last summer and fall
and has now trended down to support. I see this as a prime place to take a long position.
The decline of the overvalued USD contributes to this idea as does the persistent demand in Europe
for compressed / liquid NG and the ongoing war there that could eventually grind into WWIII.
ETFs such as BOIL , UNG and UNL may be a good way to make this trade if not in the forex market.

XNGUSD....4H= Technical analysis of natural gas against the US dollar on the 4-hour chart
= The analysis is based on price channels and trend analysis
= When it exceeds the level of 2.811, its first target becomes = 3.693
= If it exceeds the level of 3.693, its target becomes = 4.812

XNGUSD ready to reverse recent downtrend LONGXNGUSD has been on a long downtrend. On the 1 H Chart,
a falling wedge is seen awaiting a breakout. Moving Average slopes are
decreasing their negativity towards zero. ATR / Volatility is decreasing
as is the downtrend momentum on the average directional index indicator.
I see this as a long swing trade setting up for forex or alternatively
a natural gas ETF like UNL / UNG or a natural gas stock like LNG. This
trade would be propelled by the dollar losing strength, inflation being
sustained, WW III in Europe continuing and the weather turning cooler the
remainder of the winter.


NATGAS (XNGUSD) ALL NEAR Support and Resistence AreasNatural gas (XNGUSD) is currently trading near key support and resistance levels. The near-term support and resistance levels are important to watch, as they can provide insight into the direction of the commodity’s price.
15M Chart:

XNG| GAS |DECRYPTERS | XNGUSD ForecastHi people Welcome to Team Decrypters
lets keep it simple we are at Multi month low on XNG so here is a possible upside in short to Mid term , I hope this can be a good Trade for every one

Possible BOIL Cup and Handle in formation ENERGY PLAY LONGBOIL could be setting up a long continuation trade
Now working on the handle. MACD shows the lines crossed
while under the histogram is very often an excellent sign.
Time will tell- My preferred trade will be call options
expiring in late January or February.
( This is a triple-leveraged natural gas play with
the upcoming winter heating season expected to be
expensive especially in Europe. The inverse is KOLD
which would be a good put option right now.)
AMEX:BOIL

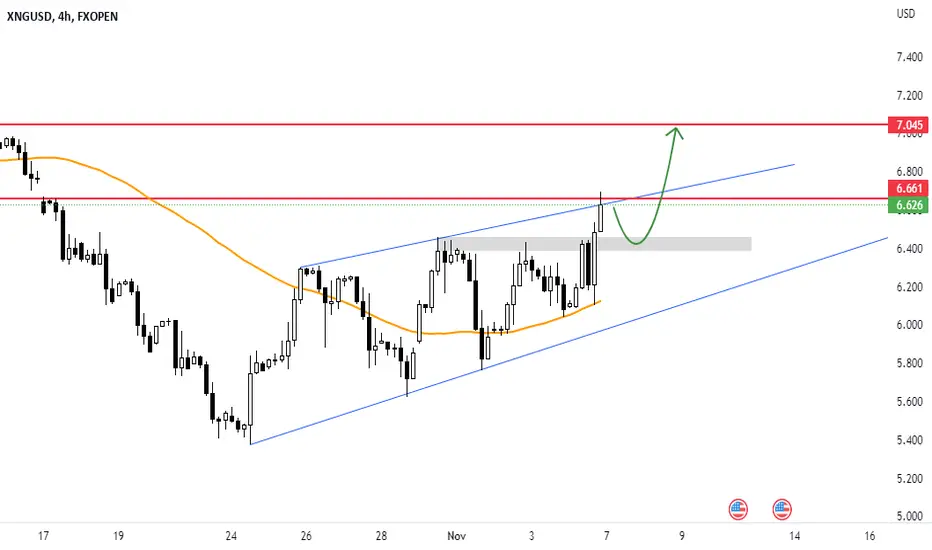
XNGUSD - NGAS NEXT WEEK MOVEGas this week had a strong bullish movement, and I expect it to complete this movement next week, with a correction that may target 6.40 levels, from which it may launch towards 7.0 levels.The gas has been in an ascending channel for 11 days, but will it breach it and rise towards the 7.0 levels? We wait next week to see what it has in store.
🔥💥 Like, Shared and subscription 💥🔥
Note: If you are a beginner trader, you should be aware of these rules:
1: Do not covet
2: Don't trade too much
3: Secure your positions after entering the profit
4: Enter contracts that fit your portfolio
5: Adhere to all recommendations
gaz naturel et buy now This market is witnessing an unusual movement and the possibility of a rise is very high
My advice is to buy

LNG Natural Gas Energy Play LongAMEX:LNG
LNG having trended down with the fall in the price of natural gas is now sitting in the support zone.
I anticipate an up-trending retracement to potentially as up as the resistance zone.
Rising relative volume and rising relative strength lend support to a reversal as does
the consolidation in the price of natural gas after a recent fall.
As a swing long trade the stop loss is below the support zone with the first target of about $ 160 or a 50% retracement
and the final target at $ 167 before resistance.

XNGUSD ready to reverse recent downtrend LONGGLOBALPRIME:XNGUSD
XNGUSD a few weeks back downtrended afer breaking the neckline of a head and shoulders pattern down to
the support of a double bottom formed in early August. Volume profiles are added to the 30 minute chart.
I see an uptrend retracement of the recent downtrend and accordingly the following:
Stop Loss at 7.64 just below the recent swing low
Target 1 8.59 the bottom of the high volume areas and near the Fib 0.382
Target 2 8.84 just under the Fib 0.50
Target 3 9.15 just under the POCs of the volume profiles and the neckline of the head and shoulders pattern.
Fundamentals: decreasing DXY will cause a relative rise in commodities; winter is coming storage of compressed NG
is underway and increasing demand.
All is all, this forex pair is ready for a long trade.

BOIL beginning a round bottom reversal LONGAMEX:BOIL
BOIL a triple leveraged ETF based on natural gas as a commodity and its futures
on the 15-minute chart has begun a round bottom reversal into an uptrend. The AO / Candle indicator
confirms this as does the curve of the accumulation /distribution indicator. Fundamentally, natural gas price
is rising especially with the DXY dollar value in a mild correction. Winter heating season is upcoming and the energy
crisis in Europe accelerating with Russia shutting down ( for now only ?) its remaining active pipeline.
Right now long BOIL looks to be an excellent setup.

XNGUSD/ NGAS Long UpdateGood day traders,
Following all our NGAS signals hitting massive Take profit points, we have one current trade running on the monthly timeframe. After a successfull retest an ABCD bearish harmonic trend hike is currently beign formed, we are almost at the end of that trend hike. We now expect the XNGUSD/ #NGAS/ Natural Gas to reach 11.3 before retracing to meet our final take profit point 14.
Disclaimer
NASDAQ Guru offers general trading signals that does not take into consideration your own trading experiences, personal objectives and goals, financial means, or risk tolerance.

XNGUSD Long - Week 07 + 08 - 02Cup and Handle in formation on all 1h/2h/3h/4h charts.
Possible reversal confirmation - still pending

NATURAL GAS - BAT PATTERN IN MAKINGNATURAL GAS is printing a bullish bat pattern. It is still in early stage as point C has defined its place. Pattern will complete at point D which is projected at 4.
The price has already been rejected at the key resistance on the daily chart, and RSI is headed downwards. There has also been a continuous decrease in volume from the first time the price tested the key resistance.
This may confirm that the price doesn’t have enough momentum to break through the resistance and is now set for a correction. There are a lot of contributing factors pointing to a bearish scenario for natural gas. Although the price might be bearish, watch out for relief pumps, especially on the support levels.
What do you think of the idea?

WK-07 (XNG/USD)Short Call! FXOPEN:XNGUSD
Hey Traders!
Strong Resistance on a 4hour timeframe!
Rejection from Resistance!
Broke Trendline!
Recommended RR=1:1 or ride the Bear Run!

XNG LongXNG has respected the long term support and showing strengths of reversal. Supported by FIB levels also. Chart has minimal projection if the upmove is sustained.

Crude Oil [USOIL] Daily Outlook |Jun 23Hi All,
here's what am looking at today. Will price hit our targets?
We shall see...
Live trading session at 8:45AM EST (Mon-Fri)
Regards,
Kings

US Natural Gas XNGUSD Short at 1D timeframe A clear uptrend is visible on the chart in the form of HH and HL. Then this trend breaks upon a LH and LL which indicate the trend reversal. So its likely to go down as per DOW theory.
You can sell short here with the stop loss of 9.126.

XNGUSD TAPPED 4H ORDER-BLOCK 📈🚀XNGUSD tapped in 4h order block, trade has been opened, prices are likely to move up!
