XNGUSD - LongAccording to chart analysis, we can see it is clearly bullish and made a strategy to get profit.
Xngusd


xngusd natural gasXngusd Natural Gas
making AB=CD pattern
Sell From 6.52 - 6.8
Tp1 6.39
Tp2 6.22
Tp3 6.06
Tp4 5.906
SL 6.95

NGas LongHi traders,
Following our last NGAS signal that hit our massive take profit I noticed an ABCD trendhike on the weekly timeframe and will hold my remaining positions to new take profit point $8

XNGUSD -Trading StrategyAccording to chart analysis, it is maybe a trend reversal because of the divergence in RSI but in case it is a correction there is a plan B.
Plan A: Short
Entry: 6.977
SL: 8.207
TP: 5.840
Plan B: Long
Entry: 8.207
SL: 7.295
TP: 9.436

XNGUSD - Trading StrategyAccording to chart analysis, It is in a bullish trend and we have great ride till now so the strategy would be with RR: 1:3
Plan A: Long
Entry: 7.977 (current)
SL: 7.572
TP: 9.220
Plan B: Short
Entry: 7.570
SL: 7.975
TP: 6.363

Wheat, Naturalgas, Brent, Coffee and Cotton vs BTCWheat, Naturalgas, Brent, Coffee and Cotton vs BTC in one chart, all long!


Natural Gas (xngusd)I think Natural Gas(xngusd) is a good opportunity for short again. It's already nice rejection on 50% fib level ........

NATURAL GAS ...GAMBLERS PARADISEIf you go with support & resistance can catch short opportunity when breaks 3.9 for upto 3.5.
nevertheless god knows where it gonna go if russian nose in ukrain starts sneezing.
best luck.

Natural Gas: Bubble explosionTrade: short
Target: $4.85 - $4.75 range
Russian President Vladimir Putin instructed Gazprom to increase supplies to the company's storage facilities in Europe. This announcement of the Russian President pressed gas prices.
XNG/USD has formed a "head-with-shoulders" pattern. The price is about to break through the neckline. After the breakout, we expect a tiny pullback with the retest of the neckline from below. After that, we await a massive down movement with the target at the $4.85 - $4.75 range.
If the price breaks through this range, the next support will be only at $4.20!

XNGUSD top-down analysisHello traders, this is the full breakdown of this pair. We will take this trade if all the conditions are satisfied as discussed in the analysis. Smash the like button if you find value in this analysis and drop a comment if you have any questions or let me know which pair to cover in my next analysis.

Looking to go long XNGUSD (Natural Gas)This commodity has been in a bullish run since April 2021. It found resistance at 3.810 but after a few attempts, on 20 July it broke above this ceiling. These last few days it has been trying to retest this level and I am hoping that it will do that early next week (starting 02 Aug).
My intention is to place a pending buy order in the region of 3.80/3.84 with a stop below 3.760. If my analysis is correct and the bullish trend continues, we should be able to get to 4.08 with ease. This has the potential to be a 2.5R trade or more (with patience).
If you like my analysis, please give it a “thumbs up” and follow me to get immediate notifications.
Always use sound money and risk management in all your trades.

NG1 // XNGUSD Natural gas is moving in an upward direction
And it will continue to rise until it reaches the price of 4 dollars

The diagonal pattern in the range of $ 3.08
( Daily Chart )
In the daily chart, the first 5 ascending waves have ended in the range of $ 3.40 and the price has entered the corrective phase of this uptrend.
Note that this is one of the most likely scenarios.
The first corrective wave is finished around $ 2.25 (a wave a) and the corrective movement of this wave is around $ 3.08 in accordance with the RSI.
In the 240-minute chart, you can see the structure of the sub-waves, and in the 60-minute chart the price is currently in the first descending trend, which could fall to the short-term target of $ 2.53.
Very important notes:
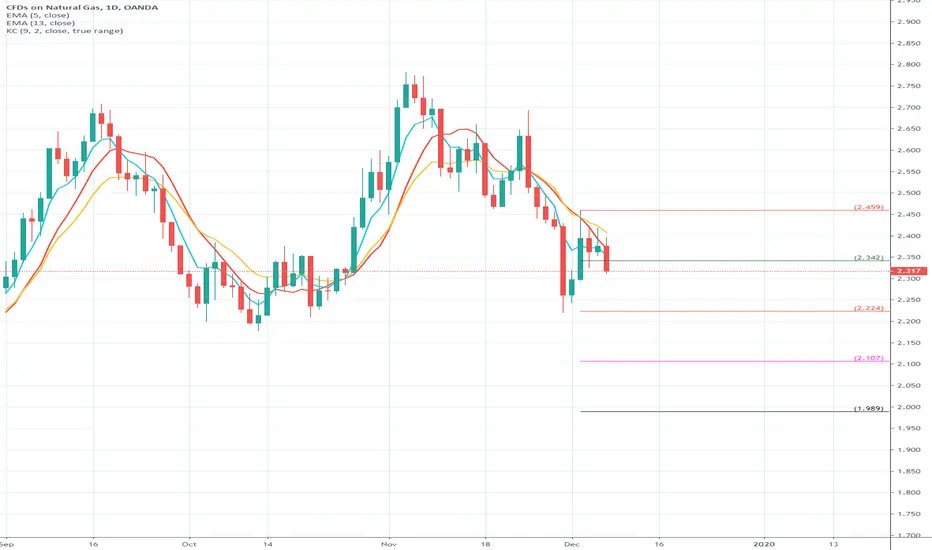
The long-term target for natural gas (XNG), as has been shown in the daily chart is in the $ 1.92 range, which is the overlapping point of the two Fibonacci ratios.
- The trend line drawn in the 240-minute chart is very important and the price should be fixed below this range to confirm this scenario.

NATURAL GAS DAILYNATURAL GAS daily trend line breakout and retest. I think it is a good opportunity for long position.

NATGAS XNGUSD SELL LIMIT ORDER expecting some manipulations so if the price doesnt hit until tuesday i will cancel the sell limit but generally a good supply zone you may wanna keep it


NATURAL GAS XNGUSD Trend ContinuationTrading method: RSADVANTAGE Stage 5 system setup 95% accurate system manually forward tested over 3 years designed to stay out of ranging markets and only target strong trends. This system is made of custom technical indicators that properly detect trends very early and provides exit signals at the possible dynamic S/R zones.
UNGUSD
Technical Outlook
To open SHORT positions for XNGUSD , it is required:
In this situation we are now waiting for Awesome Osci to go into NEGATIVE territory alongside of our other system indicators to confirm trade entry confirmation for movement to the downside and but if the market trend begins to range this signal will become invalid. Market execution for entry, confirmation will be required for entry. The market enviroment is still ranging but we will monitor the activity of our negative readings until signal is in the appropriate conditions.
Risk Description: Once signal is confirmed 140 pips will be up for grab with small risk SL at swing high. The 2 previous signal on this pair was 231 pips since NOV 15/2017 to current date. We have seen quite a bear run this pair in november and we are now looking to capture for the bears to another wave to the downside to continue this trend.
Profit expectations: 7 day trade length expected before hitting profit target I will post exit strategy when signal receives a exit signal.
Current Dynamic S/R Levels:
Swing high: 3.10
Swing Low: 2.96

