LONG XOMExpecting bounce from extremely oversold weekly and daily levels. If stop breached, be prepared to catch new daily reversal on lower levels with a tight stop.
XOM

Exxon ShortSeeing another great Head & Shoulders pattern here on XOM. Looking very close to breaking down from the neckline support. Could be a great multi-month short.
* Not financial advice -- opinion only. *

Crude Oil - Buying the DipsOil prices are coiling up for a move which will eventually head towards to the mid $60s for the following reasons:
- Bankruptcies
- DXY destruction
- Demand bottoming
- Chaos in the Middle East at some point
Pit stops along the way are marked by the fib extension from the first impulsive move - 0.5 and 0.618 being the most significant.
The simplest strategy is to assume the fib levels are to at first sell the resistance levels and then buy when it flips to support.
Right now it looks like the 0.236 level is now support. Below that you have a possible floor at the macro fib level around $40 - any dips here will likely be bought up quick.
Still long QM @ $42.85
Total Oil P/L: $1,930
All trades linked below.

Elon Musk`Hyperloop Channel discovered on XOM chartExxon Mobil is leaving the Dow. Someone just discovered a Hyperloop Channel on XOM. The trend is downward.

Crude Oil - Black GoldCommodities are rallying today as the Dollar index loses value and right on cue, oil has hit my target at $43 (the 50 week EMA) and could pullback soon.
I've closed my positions for a $1,237.50 gain (entry/exit linked below) and am looking to buy dips moving forward.
I believe oil is heading higher by the end of the year and the fib extensions should help map out buy/sell points and hint on the strength of the moves. That pink trend line also will likely come into play at some point.
Goodluck.

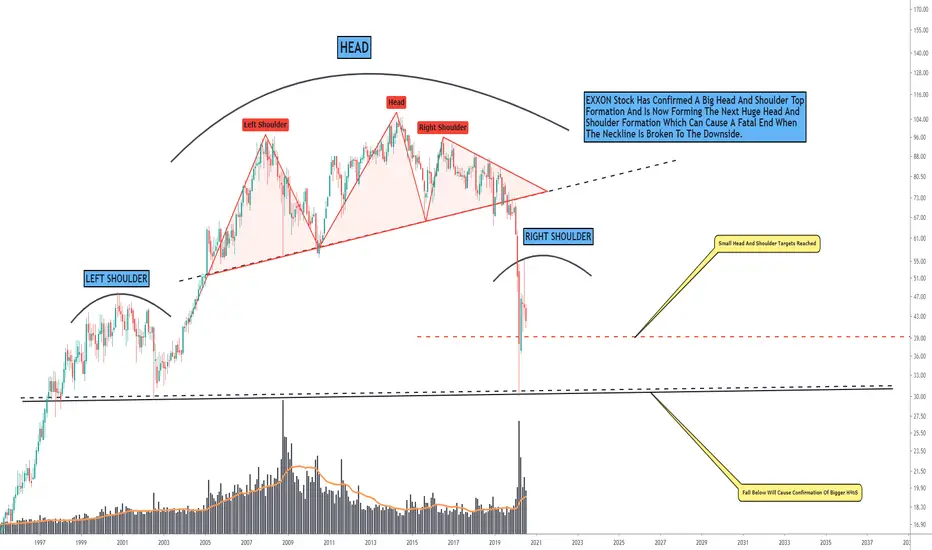
XOM, Massive Intertwined Head And Shoulder Formations Forming!Hello Traders Investors And Community, welcome to this analysis about the stock value EXXON and its current status on the monthly timeframe perspective, the massive formations which can be derived from it and what to expect from the stock the next times. As I pointed out in previous analysis the corona crisis has opened huge gaps in the economy where real economy struggling with setbacks in growth of economy, in this crisis there were winners which held strong and recovered healthily and there are stocks which did not manage to recover mainly to previous levels, not to mention that the crisis has caused a long-lasting set back in economic growth where the bearish market environment is still not confirmedly over, many people already called for the complete bullish continuation in the main market and major indices but this can not be considered currently one hundred percent for sure as individual stocks and main indices showing.
Looking at my chart you can watch that XOM formed a huge bearish head and shoulder top formation which confirmed already in January this year before the huge corona breakdowns dragged the markets to the downside in February this year, the fact that XOM showed already bearishness before the corona breakdowns began confirmed them much more. In the last weeks, the stock is marginally recovering where it forms the right shoulder of the second and bigger head and shoulder formation you can watch marked in my chart with the grey trendline neckline. When this neckline is broken to the downside and the huge head and shoulder formation confirmed this will cause extreme bearish pressure and visit of low levels which are near to nowhere and therefore possible for consideration in the short-side when the neckline does not hold and the stock confirms it as support the bearish scenario will play out with a decisive confirmation below neckline.
In comparison with the main market, major indices and single stock values this stock is definitely in a weaker state than the rest market although it is a stock within the large market-caps it can increase further bearishness, in a fundamental perspective the significant oil price crashes seen this year can also be a factor for the established breakdowns seen in this stock as it is connected to the oil industry which experienced supply and demand shocks before the oil price fell to zero. The next times will be crucial for this stock and will show if it can recover or fall below the neckline and more bearish pressure will follow. Together with this huge head and shoulder formation, the real oil price can be a source for contemplation where the journey is heading because when oil bearishness increases again this can affect also stocks in the industry, in this case, it is important to not deny the established bearish environment here in order be prepared for volatile downside movements and to realize opportunities possibly coming up on short-sides.
In this manner, thank you for watching, support for more market insight and have a good day!
Comfort and prosperity have never enriched the world as much as adversity has.
Information provided is only educational and should not be used to take action in the markets.
𝗖𝗿𝘂𝗱𝗲 𝗨𝗽𝗱𝗮𝘁𝗲: $CL_F Daily. Nice pop today over 200dmaComing into a resistance area I expect to hold (42.50-43.70) for a pullback. Could be a large one in August which is also when seasonality flips
$USO $XLE $XOM $CVX $XOP $GUSH $DRIP $SPY #Oil #CrudeOil #OOTT 🛢️

XOM 4HR Setup Possible Squeeze The 4HR 200SMA is looking interesting as it's squeezing in on the price. Watching for a possible bullish retrace back near the .382 fibonacci re-tracement level around $45.45


Tasty investment opportunity! Exxon Mobil shares buy signalsExxon Mobil, monthly chart: 38 years long(!) support line + Inside Bar & Dragonfly Doji + Oversold

Crude Oil - Bleed or SqueezeOil is full of surprises so preparation is key. Demand at risk however, bankruptcies/production cuts, among other things are pushing prices up.
Keeping an eye on a potential wedge forming up to $43.30 (the 50 Week EMA).
If this is confirmed and it breaks up, then the fib extensions are valid as well as a possible squeeze up to the 200 Week EMA.
Failure at this level means it's likely there will be chop sideways or a drop lower.

Elliott Wave View: Exxon Mobil Pulling BackElliott Wave View in Exxon (ticker: XOM) shows that the stock has an incomplete bearish sequence against June 8 high. The decline from June 8 high unfolded as a zigzag Elliott Wave structure, where wave (A) ended at 44.75 low. Afterwards, the bounce in wave (B) ended at 49.8 as a zig-zag Elliott Wave Structure in lesser degree. The bounce reached the 100% extension in 3 swing at the blue box area. Up from wave (A) low, wave A ended at 47.76 high and wave B pullback ended at 47.14 low. The stock then extended higher in wave C, which ended at 49.80 high. Exxon then turned lower from the blue box area. The decline has broken below wave (A) low, confirming next leg lower in wave (C) is already in progress.
Down from wave (B) high, wave 1 ended at 45.40 low. The internal subdivision of wave 1 unfolded as 5 waves impulse. Wave ((i)) ended at 47.24 low and bounce in wave ((ii)) ended at 48.75 high. The stock then resumed lower in wave ((iii)) towards 45.77 low and wave ((iv)) bounce ended at 48.20 high. Final leg wave ((v)) ended at 45.98 low, which completed wave 1. Pair then bounced in wave 2 and ended at 47.35 high. Currently, wave 3 is in progress, where wave ((i)) ended at 46.65 low and wave ((ii)) bounce ended at 47.22 high. Wave ((iii)) has resumed lower and near term, while below 49.80 high, expect bounce in 3,7, or 11 swing to fail and Exxon to extend lower again.


XOM - ENTRY Above Resistance at the 236@ 47.73XOM EXXON
ENTRY = Breakout Above resistance at the 236@ 47.73
1st Target = Gap fill 50.60
2nd Target = 58.63
HODL Target = 618@ 76+
________________________________________________
This content is for informational and educational purposes only. This is not in any way, shape or form financial or trading advice.
Good luck, happy trading and stay chill,
2degreez

XOM calls low risk high reward?$XOM is even cheaper now. If the market wasn't getting spooked it might be rallying. Could take advantage of the opportunity to scoop up cheap $XOM calls, which would allow you to have a defined max loss and could have really high upside. Currently sitting this one off due to my rule not to enter too many positions at once, but I like the risk/reward here...

Elliott Wave View: Further Strength in Exxon MobilExxon Mobil (ticker: XOM) shows an incomplete bullish sequence from 3.23.2020 low favoring more upside. Short term, the rally from 5.15.2020 low is unfolding as a 5 waves Impulse Elliott Wave structure. Up from 5.15.2020 low, wave 1 ended at 46.63 and wave 2 dips ended at 43.3. Wave 3 is now in progress as another impulse in lesser degree. Up from wave 2 low at 43.3, wave ((i)) ended at 47.14 and pullback in wave ((ii)) ended at 44.37.
Up from there, the stock rallies and ended wave (i) at 45.97 and dips to 44.80 ended wave (ii). Wave (iii) ended at 49.40 and pullback in wave (iv) ended at 48.16. While above there, and more importantly above 44.37, expect the stock to resume higher in wave wave (v). This move also ends wave ((iii)) in higher degree, then it should pullback in wave ((iv)) and then resumes higher again. The stock should see a few more highs to complete 5 waves up from 5.15.2020 low.
Short term, XOM still needs to break above 49.40 to avoid a double correction. Short Term target higher is 61.8 – 76.4 Fibonacci extension from 3.23.2020 low which comes at 51.9 – 54.7 area. Stock eventually has scope to reach 100% – 123.6% Fibonacci extension from 3.23.2020 low which comes at 59.17 – 63.65.

Just some entries. Updates to comehave yet to go over gold stocks so i will just post it as its own idea later


EXXON MOBILEXOM
XOM is starting a Bull´s Way.
Go in with care, but surely you will earn great %.
Some values for historical objetives.
See what happen, fundamentals say that is undervalued, so might go up.
Bullish and LONG!
See you later!

XOMAnticipate XOM to head to 63 as first target, then 70 area.
Entry: current area
SL: 40
TP1: 63
TP2: 70

Exxon Mobil - XOM - Technical AnalysisNYSE:XOM
Prices are still moving sideways - it seems that there is a possibility to go short for a short term investment, if the top resistance line will not be broken.
In conclusion hold before sell for a short term investment and hold before buying for a long term investment.

