$XOM At Risk of Losing Support at Yellow Support ZoneXOM is at risk of losing support here. There was hope in OIL prices spiking due to the Red Sea crisis, which is affecting shipments of oil tankers. In terms of price action, XOM is at risk of losing support at this yellow support zone. I think we could get some tricky price action with a dip below and a bullish rebound.
Xombuy

XOM Inside Bar w/ Bullish TrendTitle says it all, possible Higher Low being punched in on the 4h with an Inside bar candle stick con firming that sellers are exhausted and buyers may be stepping in to take back over. CALLS valid above green line, Pt white dashed lines.

XOM Triple BottomSimple triple bottom pattern on XOM with macro momentum shifting back bullish after a period of consolidation before the next leg up. Profit target is the highs and runners after if you wish. 20% Stop loss 9/8 expo, after green level is broken. If stop is hit look for re-entry above green level according to 10m chart price action. Expect this play to go 50%+ but nothing in the market is ever 100%.

Exxon dips below $109 continue to attract buyers.Exxon Mobile - 30d expiry - We look to Buy at 108.31 (stop at 105.91)
There is no clear indication that the upward move is coming to an end.
We are trading at overbought extremes.
Levels below 109 continue to attract buyers.
We look to buy dips.
The move has rejected gains and is expected to disappoint buyers.
The hourly chart technicals suggests further downside before the uptrend returns.
This is currently an actively traded stock.
Our profit targets will be 114.32 and 117.32
Resistance: 114.70 / 116.00 / 118.00
Support: 111.00 / 109.50 / 108.00
Disclaimer – Saxo Bank Group.
Please be reminded – you alone are responsible for your trading – both gains and losses. There is a very high degree of risk involved in trading. The technical analysis , like any and all indicators, strategies, columns, articles and other features accessible on/though this site (including those from Signal Centre) are for informational purposes only and should not be construed as investment advice by you. Such technical analysis are believed to be obtained from sources believed to be reliable, but not warrant their respective completeness or accuracy, or warrant any results from the use of the information. Your use of the technical analysis , as would also your use of any and all mentioned indicators, strategies, columns, articles and all other features, is entirely at your own risk and it is your sole responsibility to evaluate the accuracy, completeness and usefulness (including suitability) of the information. You should assess the risk of any trade with your financial adviser and make your own independent decision(s) regarding any tradable products which may be the subject matter of the technical analysis or any of the said indicators, strategies, columns, articles and all other features.
Please also be reminded that if despite the above, any of the said technical analysis (or any of the said indicators, strategies, columns, articles and other features accessible on/through this site) is found to be advisory or a recommendation; and not merely informational in nature, the same is in any event provided with the intention of being for general circulation and availability only. As such it is not intended to and does not form part of any offer or recommendation directed at you specifically, or have any regard to the investment objectives, financial situation or needs of yourself or any other specific person. Before committing to a trade or investment therefore, please seek advice from a financial or other professional adviser regarding the suitability of the product for you and (where available) read the relevant product offer/description documents, including the risk disclosures. If you do not wish to seek such financial advice, please still exercise your mind and consider carefully whether the product is suitable for you because you alone remain responsible for your trading – both gains and losses.

XOM Exxon Mobil | Joe Biden: 'Exxon Made More Money Than God'Want to play the earnings of the company that makes more money than God himself? :)
If you haven`t bought my last call, at $75:
than you should know that before he see this Double Top Bearish chart pattern fulfill, there is still some upside left for XOM.
Looking at the XOM Exxon Mobil options chain, i would buy the $110 strike price Calls with
2022-12-16 expiration date for about
$4.00 premium.
Looking forward to read your opinion about it.


10/5/22 XOMExxon Mobil Corporation ( NYSE:XOM )
Sector: Energy Minerals (Integrated Oil )
Market Capitalization: $413.096B
Current Price: $99.12
Breakout price: $100.00
Buy Zone (Top/Bottom Range): $97.60-$87.90
Price Target: $105.00-$106.20 (3rd), $120.10-$121.70 (4th)
Estimated Duration to Target: 26-29d (3rd), 85-91d (4th)
Contract of Interest: $XOM 10/21/22 100c, $XOM 12/16/22 105c, $3.80/contract
Trade price as of publish date: $2.69/contract, $3.80/contract

XOM Exxon Mobil Net-Zero Greenhouse Gas Emission | Price TargetsToday i have 2 relevant price targets for your from the most prestigious analysts: The Goldman Sachs Group prediction is $83 for XOM, which is most likely (to hit the resistance level) and Bank of America which has an optimistic price target of $95.
The price targets are plausible, since there is a possible disruption to European energy supplies because of Russia - Ukraine border crisis.
and
Crude oil prices will likely stay at the 7 year high since OPEC+ will keep the existing policy of gradual increase of production.
XOM will spend $3bn in the next five years on a new low-carbon business unit. They also bought a 49.9% stake in Norwegian biofuels company Biojet AS to achieve its target for reducing greenhouse gas emissions.
Exxon Goal for 2050 is Net-Zero Greenhouse Gas Emissions.
Exxon Mobil haven`t cut the dividends, like other companies, even though in 2020 they had negative earnings, -22.44Bil.
Looking forward to read your opinion about it.

1/30/22 XOMExxon Mobil Corporation ( NYSE:XOM )
Sector: Energy Minerals (Integrated Oil)
Market Capitalization: 318.703B
Current Price: $75.28
Breakout price: $76.05
Buy Zone (Top/Bottom Range): $73.90-$69.90
Price Target: $85.00-$86.20
Estimated Duration to Target: 112-120d
Contract of Interest: $XOM 6/17/22 75c
Trade price as of publish date: $5.05/contract

XOM Daily TimeframeSNIPER STRATEGY (new version)
It works ALMOST ON ANY CHART.
It produces Weak, Medium and Strong signals based on consisting elements.
NOT ALL TARGETS CAN BE ACHIEVED, let's make that clear.
TARGETS OR ENTRY PRICES ARE STRONG SUPPORT AND RESISTANCE LEVELS.
ENTRY PRICE BLACK COLOR
TARGETS GREEN COLOR
STOP LOSS RED COLOR
DO NOT USE THIS STROTEGY FOR LEVERAGED TRADING.
It will not give you the whole wave like any other strategy out there but it will give you a huge part of the wave.
The BEST TIMEFRAMES for this strategy are Daily, Weekly and Monthly however it can work on any timeframe.
Consider those points and you will have a huge advantage in the market.
There is a lot more about this strategy.
It can predict possible target and also give you almost exact buy or sell time on the spot.
I am developing it even more so stay tuned and start to follow me for more signals and forecasts.
START BELIEVING AND GOOD LUCK
HADIMOZAYAN

EXXON MOBIL CORPORATION Daily TimeframeSNIPER STRATEGY
This magical strategy works like a clock on almost any charts
Although I have to say it can’t predict pullbacks, so I do not suggest this strategy for leverage trading.
It will not give you the whole wave like any other strategy out there but it will give you huge part of the wave.
The best timeframe for this strategy is Daily, Weekly and Monthly however it can work any timeframe above three minutes.
Start believing in this strategy because it will reward believers with huge profit.
There is a lot more about this strategy.
It can predict and also it can give you almost exact buy or sell time on the spot.
I am developing it even more so stay tuned and start to follow me for more signals and forecasts.

ExxonMobil (XOM) Nice Entry Point on D1 timeframe.ExxonMobil (XOM),D1: Mirror support level + Bollinger bands + Spinning tops + Oversold

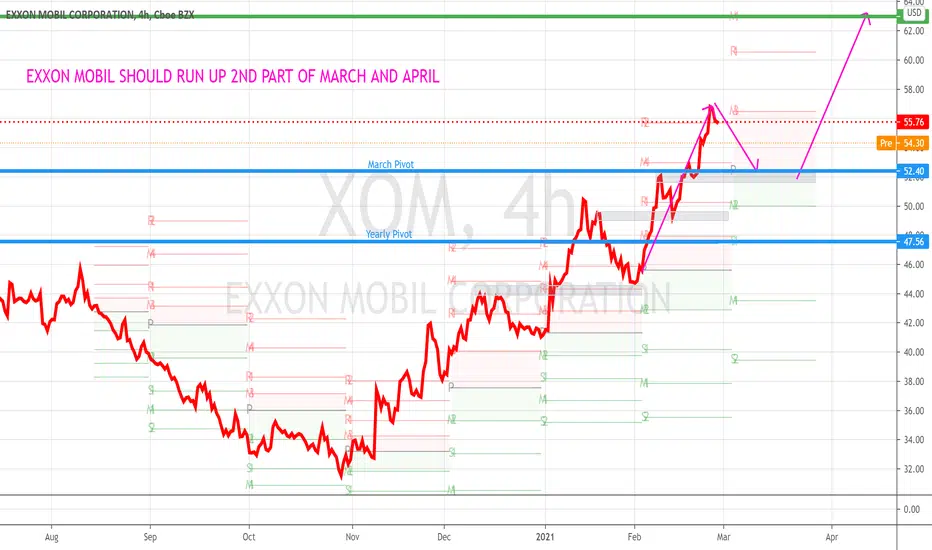
XOM Seasonal advanceOil is undervalued.
XOM is relatively strong compared to SHELL & BP.
XOM did not make a LL while SHELL & BP did.
Chevron is strongest and leading the way.
End March and April are seasonally bullish months for XOM.

XOM APRIL CALL IS A BRAINDEAD BET 35$Here is my reasoning behind buying these calls.
Trump wins oil companies will boom.
Covid-19 daily new cases are on the last wave with the elliot count.
Daily horizontal support.
TD13 on the weekly.
A lot of volume and momentum setups on the table.
Risk reward ratio is juicy.
Lets rock this thing!

XOM - buy support zone with profit targets analysisHello traders,
Description of the analysis:
Exxon mobile (XOM) support zone ideal for timing long positions (gray). Possibly profit targets (red).Trade what you understand, trade carefully and sparingly according to the business plan.
About me:
Hi, my name is Jacob Kovarik and I´m trading on stock exchange since 2008. I started with a capital of 3000 USD. My first strategy was based on OTM options. (American stock index and their ETF ). I´ve learnt on my path that professional trading is based on two main fundaments which have to complement each other, to make a bussiness attitude profitable. I´ve tried a lot of techniques and many manners how to analyze the market. From basic technical analysis to fundamental analysis of single title. My analytics gradually changed into professional attitude. I work with logical advantages of stock exchange (return of value back to average, volume , expected volatility , advantage of high stop-loss, the breakdown of time in options, statistics and cosistent thorough control of risk). At the moment, my main target is ITM on SPM index. Biggest part of my current bussiness activity comes from e mini futures (NQ, ES). I´m trader of positions. I´m from Czech republic and I take care of a private fund (over $4.000.000 USD). During my career I´ve earned a lot of valuable experience, such as functionality of strategies and what is more important, control of emotions. Professional trading is, in my opinion, certain kind of mental training and if we are able to control our emotions, accomplishment will show up. I will share with you my analysis and trades on my profile. I wish to all of you successul trades.
Jacob

Tasty investment opportunity! Exxon Mobil shares buy signalsExxon Mobil, monthly chart: 38 years long(!) support line + Inside Bar & Dragonfly Doji + Oversold

Adding Some Exxon (XOM)I have a channel drawn with an area of potential support.
With a first level Crossover attempt on lower timeframe.
I can't post the lower timeframe here so I will share it in the updates below.
Looking to add 25% of my buy order here.
1-2% stop


HELLO GUYS , WAIT FOR THE RIGHT TIME TO BUY XOM!NYSE:XOM
RESUME OF THE RISING IN MAXIMUM 14 DAYS
Thanks for your reactions!


Elliott Wave View Expects Exxon Mobil To RallyElliott Wave view in Exxon Mobil (ticker: XOM) suggests that the rally from December 26, 2018 low ($64.65) is unfolding as Elliott Wave zigzag. The first leg of the zigzag ended at $73.33 on January 18, 2019 high as wave A. A zigzag is a 5-3-5 structure and wave A should unfold in 5 waves in impulse or diagonal. We can see in the chart below that wave ((iii)) of A ended at $73, wave ((iv)) of A ended at $71.95, and wave ((v)) of A ended at $73.33.
The stock then pullback in wave B with the internal as a zigzag Elliott Wave structure as well. Down from $73.33, wave ((a)) ended at $70.64, wave ((b)) ended at $72.27, and wave ((c)) ended at $70.37. Wave C rally has started and the stock is expected to break above wave A at $73 and could see as high as $79 when wave A = C. To gain confirmation for this view, the stock still needs to break above $73. Otherwise, technically we still can’t rule out a double correction in wave B. Near term, while pullback stays above $73.33, expect Exxon Mobil to extend higher.
