XPTUSD

XPTUSD (PLATINUM US DOLLAR) Platinum, which is used to curb emissions from diesel cars and in jewelry, rose more than 21% in 2019 – the biggest annual gain since 2009.
The long-only exchange-traded funds focused on the precious metal attracted $850 million in 2019. That was the biggest annual inflow on record, according to Bloomberg.
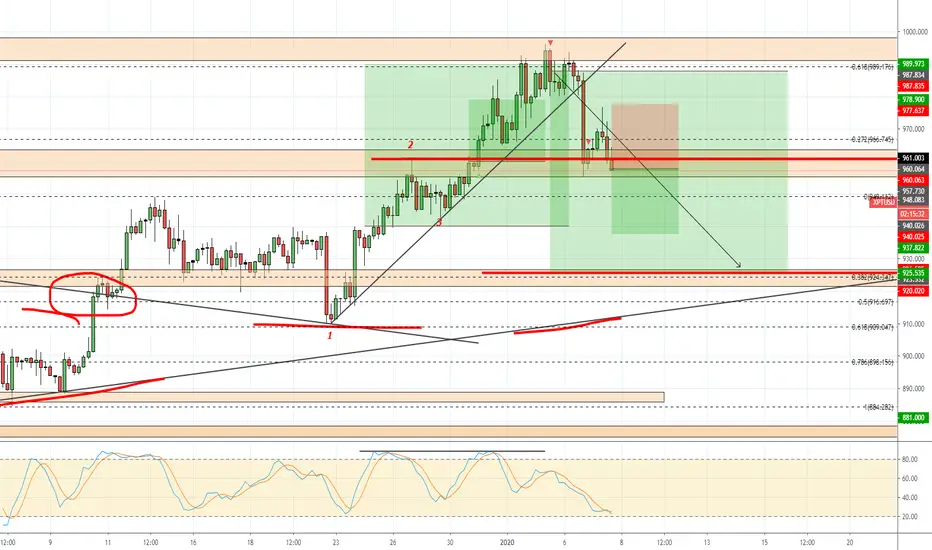
Price is making higher highs and higher lows. Sitting at the .382 fib and the 200 EMA.
Waiting to break through 1000.

Platinum, my other preciousWeekly divergence and successful backtest of wedge. Should hit a target close to 1300 in a few months.

Platinum (XPTUSD): $1,040 Target reached. Expecting a pull back.XPTUSD reached our 1,040 Target on our long since October 31st, 2019 as seen on the buy call below:
The 1M Bullish Megaphone since September 2018 is still holding (RSI = 57.612, MACD = 6.190, ADX = 38.381, Highs/Lows = 74.3178) and in fact the 1,040 top was its Higher High as seen on the chart. We are now expecting its technical pull back which based on the previous 3 occasions should be within -11% to -14%. As a result this puts the Target Zone within 925 - 895. Note: see how harmonic the RSI sequences are both on the bullish and bearish legs of the Megaphone alike.
This short term pull back doesn't mean that we have turned bearish on Platinum. Our portfolio still holds long term buy positions and we have illustrated our long term bullish sentiment on the idea below:
** If you like our free content follow our profile (www.tradingview.com) to get more daily ideas. **
Comments and likes are greatly appreciated.

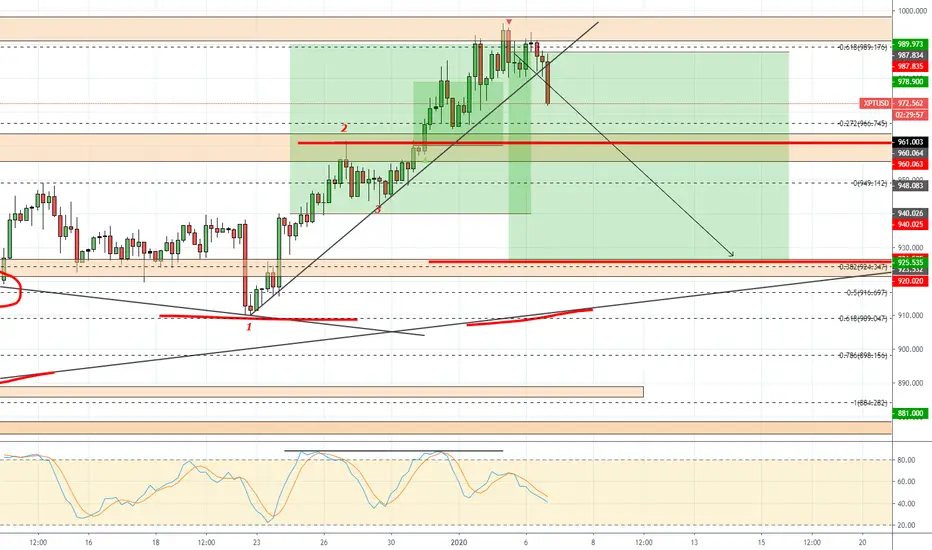
XPTUSD ShortXPTUSD formed a wedge pattern. I waited for the breakout , which was to the downside, to place a trade. I confirmed this movement using the two MA's which did cross over, confirming this downward momentum.

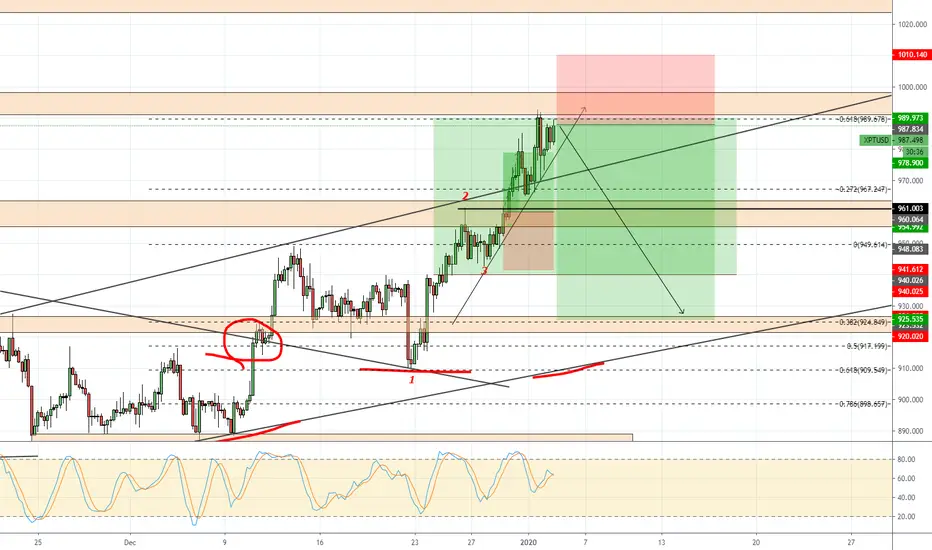
XPT/USD - SELLwe have nice retracement of weekly level and now we have 3-rt point of descending trend line with pin bar

XPT SUPER SWING BUYOn the Weekly timeframe, this pair was on a descending trend, but the past year start making Higher Highs and Higher Lows, forming an ascending channel. the past days broke that descending trend line and the top of the ascending channel, made a retest of that lines and a resistance zone. Right now the price is bouncing on a strong resistance, but i think that got the strenght to broke that resistance, beacuse we got more confirmations to go long. To enter on a super swing trade we will wait to a close of the mentioned resistance zone, and wait for a formation of corrective structure on a lower timeframe to get the full confirmations that the price is going up.
For the full analysis, educational content and quality signals service, contact us on
Telegram:@FedericoGallo - @MrFlawlezz
Instagram: @Forex_society

PLATINUM VIEWPOINT (AS REQUESTED)HERE IS MY VIEWPOINT ON ON PLATINUM. PRICE IS CURRENTLY SAT IN A VERY WELL RESPECTED RESISTANCE ZONE ON DAILY/WEEKLY TIME FRAME SO I'D EXPECT SOME SORT OF PULLBACK FROM THIS ZONE TO THE PREVIOUS STRUCTURAL RESISTANCE WHICH WILL NOW BECOME SUPPORT AND THEN CONTINUE TANKING UPWARDS, ALTERNATIVELY IT WILL BREAK THROUGH THE CURRENT ZONE AND GO STRAIGHT UP TO TARGET (COULD GO LONG ON BREAK OF AREA IF THIS HAPPENS AND PUT SL BELOW HIGHLIGHTED ZONE) AS MY VIEWPOINT IS RESOURCES WILL GO UP IN VALUE (I.E. GOLD, OIL ETC.) THIS COULD ALSO BE A VERY LIKELY OPTION. I HAVE MARKED AN IDEAL ENTRY POINT WITH SL AND TP ZONE MARKED ON THE CHART, OPPORTUNITY IS A GREAT RR SETUP FOR BOTH OPTIONS SO HAVE TO KEEP A VERY CLOSE EYE ON THIS IN THE COMING WEEK AS PLATINUM WAITS FOR NOBODY.

Platinum: 12 Year TriangleDoes the descending triangle complete with the traditional breakdown?
Or does it bounce higher?

Platinum: Time to Buy?I think no.
Price is currently consolidating around the $1017 level after breaking the $998 strong resistance.
$1017 is now a stronger resistance. Platinum broke it in June 2016 and tried to recover it at least four times with no success.
My view is a retracement to the EMA 50 level.
If you like this idea, don't forget to hit the Like Button!
Disclosure: My ideas contain statements and projections based on assumptions on capital markets, and therefore inherently subject to numerous risks and uncertainties.
Before buying or selling any stock you should do your own research and reach your own conclusion or consult a financial advisor. Investing includes risks, including loss of principal.
I am not a financial advisor.


Platinum (XPTUSD): Quick Update. Getting closer to our Target.Platinum is approaching our medium term Target Zone of 1,020 - 1,040 as we posted on this idea in late October:
As the moment, the current 1D Channel Up (RSI = 66.576, MACD = 14.780, ADX = 30.519, Highs/Lows = 23.68000) has just broken above the Higher High trend line again in a move that strongly resembles the late July/ early August break out. That Channel Up was supported by the 1D MA50 (blue trend line) and on a similar RSI action as today's broke to the upside aggressively to form a market top near 1,000.
We assume that as long as the 1D MA50 supports the uptrend, XPTUSD will aggressively break into our Target Zone.
** If you like our free content follow our profile (www.tradingview.com) to get more daily ideas. **
Comments and likes are greatly appreciated.

XPTUSD 1D ASCENDING TRIANGLE BREAKOUT LONG TRADEPlatinum Ascending Triangle Breakout Long Trade
Ascending Triangles are repeatable trading chart patterns.
Ascending chart patterns will have a directional bias depending on the previous incoming trend.
Each chart pattern will have defining trendlines of the support/resistance levels creating the pattern.
What ever time frame you are trading this chart pattern, wait for a candle close outside of the trendline in the direction of the breakout candle. (Our time frame preference is the Daily chart).
Add volume indicator - Volume is the amount of $ that went into a particular candle or in Forex the # of trades that took place.
Add ATR indicator - Volatility is the amount of price movement that occurred. Use the ATR to measure the price movement.
When you see descending Volume bars and descending ATR line (which indicates volatility) this shows
a dis-interest in traders to invest in this pair creating consolidation which creates the chart pattern.
Trade Management after there is a breakout candle close.
1 - Position size (compare volume bar to volume ma line).
a - Breakout candle must be 100% of average volume for a full position size.
b - If 75% of average volume then ½ position size. (To find 75% of Volume
look at the charts volume settings – divide smaller # into larger # = 75%+)
2 - Enter two trades.
3 - SL for both trades will be 1.5 x ATR.
4 - 1st trade TP will be 1 x ATR.
5 - No TP on 2nd trade – letting profit run and adjusting SL to follow price.
6 - When 1st TP hit – move 2nd trade SL to breakeven.
7 - Adjust the 2nd trade SL to follow price.
*8 – After Breakout candle – if price closes back into chart pattern close trade
*9 - When breakout candle is more than 1 ATR from breakout candle open.
a - Enter 1st trade at candle close with ½ position size.
b - Enter 2nd trade with a pending limit order that is 1 ATR of breakout candle open.
c – Price should pullback to that pending limit order for 2nd trade.
d – If Price returns back into chart pattern close trade before SL is hit.

Platinum bullish breakout 2020Based on the price action, this could be one of the best years for platinum since 2007. A break of the confirmed downtrend line and close above it and 200SMA. For extra confirmation, waiting for the close above the $1000 level.
This could be a great long term trade for 2020, targeting $1700 at 61.8% fib level.
Commodities are very bullish at the moment due to brewing conflict between USA and Iran and there seems to be a real threat of war in the air. Investors will seek commodities as safe havens in case of full military action. Not the best start of the new decade...
Good Luck!

Palladium Monthly Chart Short After AB=CD=CD Palladium After a big up move get to a very very strong resistance
Price end AB=CD then make another CD leg, now gonna fall
This trade has a very high success rate to Take profit 1


Platinum Top on the Way..Commercial producers in Platinum have been heavy sellers in the NYMEX contract lately. This action typically bodes poorly for Platinum prices shortly thereafter. Once the commercials get down to -50k contracts, this can be a good signal to short. Using this weeks "Eskom Power Shortage" news to open a new short position on the NYMEX PL contract.
In times passed, any news relating to a South African miner's strike or a Eskom Power issue typically results in a 2-3 day price jump which is short lived as the producers come in to sell it back down. Will add additional contracts every $10 higher. Profit target is when the commercials have covered contracts (or have delivered metal) back into the -20k range which likely means the $780 to $800 range.


We hit XPT with 944. What's next?After our successful plan last time and hit even more than we anticipated. So what now? Our short term plan is to have a small correction as low as 915. Then we go up again for the midterm. As Platinum is quite volatile, short term against the main trend is very risky so we refrain from entering it.
With low leverage, it can be tried like this:
Entry: 935
Stop: 944
Final target: 919.
Remember that the bigger time-frames signal us that it will surge but the likelihood of correction before moving up is pretty high.

GOLD METAL MARKET TRADE SETUPS & SIGNALS For 16th Dec 2019www.youtube.com
I Publish Daily chart updates on over 49 Assets including Forex pairs, Indices, Commodities, Metals, Cryptos and more. Watch them via the above link
